The Gender Gap in Meaningful Work
Abstract
An understanding of differences in nonmonetary work conditions is fundamental for a complete characterization of individuals’ well-being at work. Thus, to fully characterize gender inequalities in the labor market, scholars have begun to explore gender differences in nonmonetary work conditions. We examine one such condition—meaningful work—using nationally representative survey data linked with worker and employer administrative data. We document a large and expanding gender gap in meaningful work, wherein women experience their jobs as more meaningful than men do. We then explore patterns underlying this difference. We find little correlation between women’s higher experience of meaningful work and either labor market decisions related to first parenthood or women’s underrepresentation in leadership jobs. Instead, the gender gap appears to be highly correlated with the sorting of more women into occupations with a high level of beneficence: the sense of having a prosocial impact. Though both women and men experience such jobs as more meaningful, women do so by a larger margin. Next, we consider the relationship between the gender difference in meaningful work and the gender wage gap, contributing to the discussion on compensating differentials in work amenities. We find that, whereas the gender gap in meaningful work closes a substantial part of the wage gap in lower paid jobs, it does little to close the gap in higher paid jobs in which the gender wage gap is largest.
This paper was accepted by Yan Chen, behavioral economics and decision analysis.
Funding: J. Rickne received financial support from the Wallenberg Academy Fellow Grant, the Swedish Research Council for Health, Working Life, and Welfare 2019-01251. O. Folke received financial support from the Swedish Research Council 2018-00703_VR, The Swedish Research Council for Health, Working Life, and Welfare 2019-01251.
Supplemental Material: The online appendix and data are available at https://doi.org/10.1287/mnsc.2022.01807.
1. Introduction
The labor market is characterized by many gender differences. Recent research in economics examining gender differences in the labor market emphasizes the importance of considering differences in nonmonetary work conditions, such as flexibility, autonomy, and incidence of sexual harassment, the experience of which are important for a complete characterization of well-being at work (Eriksson and Kristensen 2014, Cassar et al. 2016, Mas and Pallais 2017, Wiswall and Zafar 2017, Samek 2019, Folke and Rickne 2022, Maestas et al. 2023). There is, thus, an increasing recognition in the field that an examination of gender differences in nonmonetary work conditions is imperative for a comprehensive understanding of gender differences in well-being in the labor market more broadly.
We analyze the gender gap in one nonmonetary work characteristic whose relevance to individual well-being has received increasing attention in recent years: meaningful work. Meaningful work refers to the sense of impact or purpose derived from and what is believed to be achieved as a result of a person’s work (Brief and Nord 1990, Wrzesniewski and Dutton 2001, Ariely et al. 2008, Rosso et al. 2010, Cassar and Meier 2018). There is a substantial body of literature in organizational psychology and sociology on the importance of meaningful work to individual well-being (Brief and Nord 1990, Wrzesniewski and Dutton 2001, Rosso et al. 2010, Caza and Wrzesniewski 2013). Indeed, meaning at work is shown to be crucial to people’s identity and psychological well-being (e.g., Wrzesniewski 2003; see Karlsson et al. 2004, Cassar and Meier 2018, Nikolova and Cnossen 2020 for a discussion of the literature from an economics perspective). It contributes to individuals’ affective well-being (Arnold et al. 2007), their experience of life as meaningful (Steger and Dik 2009), and their satisfaction with life (Steger et al. 2012, Duffy et al. 2013). Karlsson et al. (2004) summarize Victor Frankl’s (1962) insight popularized in his book Man’s Search for Meaning as such: “It is people’s innate will to find meaning, and not their striving for pleasure, power, or wealth, that is the strongest motivation of living” (p. 62). Thus, although several work conditions undoubtedly influence individuals’ overall utility at work, the experience of meaning at work is one that is particularly important.1
Our paper characterizes and explores patterns underlying meaningful work by gender using survey data from Sweden. This data enables us to complement existing research on meaningful work, largely stemming from organizational behavior and sociology (Rosso et al. 2010) because it is (1) nationally representative and (2) can be matched to administrative data, including income. The nationally representative nature of our data set allows us to speak to patterns across an entire labor market. It enables us to explore differences across sections of the labor market and, as a result, to draw broader conclusions than work that is limited to more restricted samples (e.g., Bailie 1993; Wrzesniewski et al. 1997; Grant 2008a, b). By replicating key results with cross-country International Social Survey Programme survey data, we further broaden the generalizability of our findings. The fact that our measure of meaning at work can be matched to administrative data also enables us to go beyond patterns based on self-reports and examine patterns between meaning at work and revealed, actual worker and workplace characteristics and choices. Our study, thus, complements literature linking the experience of meaning at work to self-reported worker experiences and workplace characteristics (Steger and Dik 2009). Finally, by matching our data to one important worker characteristic—wages—we are furthermore able to join the discussion in economics about compensating differentials for job amenities (Thaler and Rosen 1976, Wiswall and Zafar 2017), exploring how incorporating the gender gap in meaningfulness into the wage gap affects a broader interpretation of gender well-being in the labor market.
Our paper documents a large and growing gap to women’s advantage, which replicates recent findings in the context of the U.S. labor market (Kaplan and Schulhofer-Wohl 2018, Maestas et al. 2023). We furthermore push forward our understanding of the gender gap in meaningful work by exploring patterns underlying this gap as well as by assessing how the gender gap in meaningfulness relates to the gender wage gap.
We first empirically explore the construct of our measure of meaning at work. We describe correlations with psychological pathways to meaning, seek to validate our self-reported measure by demonstrating intuitive correlations between our measure and self-reported proxies for well-being and actual workplace turnover, and describe the sociodemographic and labor market traits that are correlated with the measure. We then examine whether there is a relationship between the gender gap in meaningful work and first parenthood, between the gender gap and the gender composition of different hierarchical positions, and between the gender gap and the gender composition of different occupations.
Given the relevance of life events, such as first parenthood, in explaining numerous gender differences in the labor market (Waldfogel 1997, Budig and England 2001, Angelov et al. 2016), we anticipated that there might be a relationship between first parenthood and the gender gap in meaningful work. We find no evidence of such a relationship, however. Likewise, we find little evidence of a relationship between sorting into different hierarchical positions and the gender differences in meaning at work. Our data are consistent with the argument that people who occupy higher positions in organizational hierarchies generally find their work to be more meaningful (Bowie 1998, Martela and Riekki 2018). Given that men, instead of women, tend to occupy higher positions at work, we, thus, find suggestive evidence that the gender gap in meaningful work exists despite vertical gender segregation.
There is a strong relationship between the gender gap in meaningful work and gender-based sorting into occupations with different traits. We analyze this pattern by categorizing occupations based on a four-factor model of psychological pathways to work meaningfulness: autonomy, competence, relatedness, and beneficence (Cassar and Meier 2018, Martela and Riekki 2018). We find that women are more likely than men to work in occupations with high beneficence, defined as a high level of prosociality (and measured in our data by expert ratings from the O*NET database). Both women and men experience these jobs as more meaningful, which creates a mechanical relationship between women’s overrepresentation in occupations with high beneficence and their aggregate advantage in meaningful work. In addition, women derive more meaning than men as the level of beneficence at work increases. We discuss several factors that could give rise to these patterns, including gender norms and stereotypes, preferences, and skills.
To assess how incorporating the gender gap in meaningfulness into the wage gap affects a broader interpretation of gender well-being in the labor market, we quantify the monetary valuation of meaningful work with the method proposed by Bell (2020) and add this valuation to estimates of the gender wage gap. Notably, the gender gap in meaningful work exists mainly in the lower half of the wage distribution, which is where the gender gap in wages is relatively small. We find that, in this part of the wage distribution, meaningfulness compensates women for about one third of the wage gap. At higher wage levels, the wage gap is substantially larger, whereas the gender gap in meaningful work is small. Therefore, whereas the gender gap in meaningful work closes a substantial part of the wage gap in lower paid jobs, it does little to close the gap in higher paid jobs in which the gender wage gap is largest (e.g., Blau and Kahn 2017).
Our paper makes several contributions. First and foremost, we contribute to an understanding of the importance and implications of nonmonetary attributes of work. Economists are increasingly recognizing the role of work conditions in characterizing gender differences in the labor market. This strand of research focuses on time–space flexibility (e.g., Mas and Pallais 2017, Wiswall and Zafar 2017, Adams-Prassl et al. 2023), commuting distance (Petrongolo and Ronchi 2020, Le Barbanchon et al. 2021), competitiveness (Niederle and Vesterlund 2007, Buser et al. 2014, Flory et al. 2015, Reuben et al. 2019, Samek 2019), sexual harassment (Folke and Rickne 2022), and workplace safety (Lavetti and Schmutte 2021, Morchio and Moser 2021). We focus on a work attribute that has been relatively underexamined in economics despite its importance to individuals’ overall well-being (Karlsson et al. 2004, Cassar and Meier 2018, Nikolova and Cnossen 2020) and its implications for organizational productivity (Gartenberg et al. 2019). Whereas extant research shows that gender differences in preferences for this work attribute differ (Burbano et al. 2023), we consider how men and women differ in their actual experience of meaning at work. We document a sizable and growing advantage of women’s experience of this job trait and explore patterns underlying this gap.
By discussing how meaningful work relates to the gender wage gap, we contribute to the discussion in economics regarding wage inequality and work conditions (Maestas et al. 2023). We specifically join recent research that ascribes (or does not ascribe) parts of the gender wage gap to differences in working conditions (e.g., Bertrand et al. 2010, Goldin 2014, Mas and Pallais 2017, Reuben et al. 2019, Le Barbanchon et al. 2021). Our findings suggest that the gender gap in utility derived from work in the lower half of the wage distribution is smaller than wages alone would suggest, whereas this is largely not the case in the upper half.2
Our paper also makes a small contribution to an understanding of patterns underlying occupational sorting by gender. It has been established that women are less likely to pursue jobs in stereotypically male fields (Fernandez and Sosa 2005, Fernandez and Friedrich 2011) because they anticipate discrimination, question their ability to succeed, and identify less strongly with those jobs (Correll 2001, Correll and Benard 2006, Cech et al. 2011, Barbulescu and Bidwell 2013, Delfino 2021). Furthermore, research shows that congruence between prosocial job characteristics and the female stereotype (Lee and Huang 2018) affect the sorting of men and women into different occupations (Abraham and Burbano 2021), resulting in women’s overrepresentation and men’s underrepresentation in communal roles (Croft et al. 2015, Block et al. 2018). We find that women experience jobs with high beneficence as more meaningful than men, thus pointing to the relevance of considering experience of meaning at work as one important pathway in understanding the relationship between perceived gender congruence and occupational sorting.
In what follows, we (1) describe our data and measurements, including a validation of our measurement of meaningful work; (2) document and characterize gender differences in meaningful work; (3) examine patterns underlying the gender gap in meaningful work; and (4) consider implications of this gap for the gender gap in wages.
2. Data, Measurements, and Summary Statistics
We link detailed employer and employee administrative data with cross-sections of survey data for self-reports of individuals’ experience with work as meaningful. Our main data source is the Swedish Work Environment Survey, the Swedish government’s biannual survey that maps the development of work conditions in the labor market, conducted by Statistics Sweden. It contains about 100+ questions about work environment traits as well as a four-digit occupation code and is stratified by age, sex at birth, occupation, industry, and social class, which ensures representativeness for the fully employed population. The survey is nationally representative and gives a highly accurate and complete picture of the labor market. The survey is entirely anonymous, and Statistics Sweden does not inform employers that their workers have been sampled. This makes it unlikely that workers feel pressure to self-report a certain way, reducing the likelihood of social desirability bias in responses.
We match each respondent to an annual population-wide panel of administrative records via a (mandatory) personal ID code. This panel includes every permanent citizen of the country between 1979 and 2019. Variables come from government agencies and provide measurements that are not self-reported and have very few missing observations. They include sex at birth, education level, and the birth year of any child. Data from the tax agency include labor income and sector of employment (public or private) for the largest source of labor income in each year. These data let us calculate workplace size by summing up the number of people who have the same workplace as their largest source of annual labor income. In this calculation, we define a workplace as the unique combination of an organizational ID code and a workplace ID code.
For our main analysis, we pool 15 biannual surveys between 1991 and 2019. This results in 121,222 observations of self-rated meaningful work. Excluding people who are not working age (19–64 years old) and observations with missing data on the workplace, firm ID codes, demographics, or occupation removes 9,623 observations. The final sample size is 111,599, of which 52% are women.
In analyses including wages or pathway variables, our sample sizes are smaller. Requiring all pathway variables to be nonmissing leaves 84,193 observations, mainly because the autonomy and relatedness measures only became available in 1995. When we analyze wages, data on monthly wages come from a mandatory employer survey, the Swedish Salary Statistics Survey, conducted annually by Statistics Sweden. It covers all public organizations, all large private employers (>500 workers), and a stratified random sample of medium and small firms in the private sector, capturing approximately 50% of all private sector workers. Organizations must report the wage for each employee who worked at least one hour during the sampling week. These data start becoming available in 1997, and the coverage expands gradually over time. Our data sample with nonmissing wage information contains 41,607 observations.
2.1. Representativeness of the Survey Data
Table 1 compares sociodemographic and labor market traits in the survey sample (column (1)) with those of the employed Swedish population (column (2)), using the same age interval of 19–64 years. The proportion of individuals by gender, age category, education level, and birth region as well as the proportion of public-sector workers, average annual labor earnings, average monthly wage,3 and the distribution of people across one-digit occupation codes are highly similar.4 Repeating this comparison for the sample with nonmissing data for the pathway variables shows a similar and high level of representativeness (Online Table W1, columns (1)–(3)). That is less true for the wage sample, for which the nonrandom sampling of the salary statistics results in an overrepresentation of workers with tertiary education and in the public sector (Online Table W1, columns (1), (4), and (5)). To adjust for imbalances, we use Statistics Sweden’s sample weights as analytical weights throughout the paper.
|

Table 1. Summary Statistics for the Survey Sample and the Employed Population
| Survey sample | Population | Difference (1) − (2) | |
|---|---|---|---|
| (1) | (2) | ||
| Female | 0.52 | 0.48 | 0.04 |
| Age | |||
| 19–35 | 0.29 | 0.35 | −0.06 |
| 36–50 | 0.40 | 0.38 | 0.02 |
| 51+ | 0.31 | 0.27 | 0.04 |
| Education level | |||
| Below high school | 0.15 | 0.15 | 0.00 |
| High school | 0.48 | 0.5 | −0.02 |
| Tertiary education or PhD | 0.37 | 0.35 | 0.02 |
| Birth region | |||
| Born in Sweden | 0.92 | 0.87 | 0.05 |
| Born in Europe, excluding Sweden | 0.06 | 0.08 | −0.02 |
| Born outside of Europe | 0.02 | 0.05 | −0.03 |
| Public sector | 0.40 | 0.35 | 0.05 |
| Log labor earnings | 7.63 | 7.63 | 0.00 |
| Log wage | 10.03 | 10.05 | −0.02 |
| One-digit occupations (ISCO-88) | |||
| 0 Armed forces | 0.001 | 0.03 | −0.029 |
| 1 Legislators, senior officials and managers | 0.04 | 0.05 | −0.01 |
| 2 Professionals | 0.20 | 0.19 | 0.01 |
| 3 Technicians and associate professionals | 0.23 | 0.19 | 0.04 |
| 4 Clerks | 0.10 | 0.09 | 0.01 |
| 5 Service workers and shop and market sales workers | 0.17 | 0.21 | −0.04 |
| 6 Skilled agricultural and fishery workers | 0.02 | 0.01 | 0.01 |
| 7 Craft and related trade workers | 0.10 | 0.09 | 0.01 |
| 8 Plant and machine operators and assemblers | 0.10 | 0.09 | 0.01 |
| 9 Elementary occupations | 0.04 | 0.06 | −0.02 |
| Number of observations | 111,599 | 64,142,469 | |
Notes. Columns (1) and (2) compare demographic and labor market traits in two data sets. Column (1) uses pooled, biannual cross-sections of the Swedish Work Environment Survey (1991–2019 for all variables except for wages, for which the data are 1997–2019; N(Wages) = 41,607). Column (2) uses data for all employed permanent residents in the same age range (19–64) and the same years. The population data are restricted to the employed, using an annual income threshold of one Swedish price base amount (≈US$5,500).
2.2. Operationalization of Key Variables
2.2.1. Female.
Binary sex at birth is coded by Statistics Sweden directly from the mandatory personal identification code. Female equals one if an individual’s recorded sex at birth is female, zero if male.
2.2.2. Meaningful Work.
In the Swedish Work Environment Survey, respondents answer the question, “Do you experience your work as mostly meaningless or meaningful?” by choosing between five responses ranging from one (very meaningless) to five (very meaningful).5 The average score is 3.95, and the standard deviation is one scale step (1.007). More than one third (36%) experience their work as very meaningful, and another third (35%) chose the second highest category. One fifth (22%) chose the third, middle-of-the-road category, and 7% chose the two lowest categories of meaningless work (5% and 2%, respectively). The proportion of our sample indicating the lowest categories of meaning at work (7%) is very similar to the 8% statistic in other work that, using cross-country evidence, captures the proportion who indicate their job to be “socially useless” (Dur and van Lent 2019). Note that we use the terms “meaningful work” and “meaning at work” interchangeably in this paper.
2.2.3. Pathways to Meaningful Work.
Previous research has employed a four-factor model of the psychological underpinnings of meaningful work (e.g., Cassar and Meier 2018, Martela and Riekki 2018). Three factors—autonomy, competence, and relatedness—are derived from self-determination theory, which focuses on predicting meaning in life more broadly (Deci and Ryan 1985, 2000; Ryan and Deci 2000; Weinstein et al. 2012). A fourth is derived from research on beneficence; that is, work that has a prosocial impact. We follow this literature in our operationalization of each pathway.
Autonomy refers to a “sense of volition and internal perceived locus of causality in one’s undertakings. The individual feels that the actions emanate from the self and reflect who one really is, instead of being the result of external pressures” (Martela and Riekki 2018, p. 2). In a work setting, it describes a worker’s sense of independence in determining the parameters of the worker’s work situation (Cassar and Meier 2018). We create a composite variable for autonomy by combining responses to four questions.6 We standardize each of these ordinal variables to have a mean of zero and standard deviation of one, take the average of the four standardized variables, and standardize this average. Online Table W2 lists these survey questions and their response categories in full.
Competence is defined as a “sense of mastery and efficiency in one’s activities. One feels that one is capable at what one does and is able to accomplish projects and achieve one’s goals” (Martela and Riekki 2018, p. 2). People feel that their jobs are meaningful if they perceive themselves to be competent at performing them, that is, when they are aptly able to apply their talents, skills, and/or knowledge on the job. If they perceive their job as too difficult and, thus, that they lack the competence to accomplish its goals, or if they perceive their job to be too easy such that it does not effectively utilize their talents, skills, and/or knowledge, individuals’ sense of meaning at work is diminished. We standardize a single survey question to capture this: “Do you feel that the tasks involved in your job are too difficult or too easy, for you?” Before the standardization, we recode the question into three categories: (1) far too easy or far too hard, (2) too easy or too hard, and (3) just right.
Relatedness captures the positivity of individuals’ social relationships with others in the workplace. We use the average of four standardized survey questions that ask about relationships with managers and colleagues at work to capture this characteristic. Two questions ask about the perception of appreciation and support from either colleagues or supervisors. The other two ask about conflicts (reverse coded). Again, we standardize each variable, take the average, and standardize a second time. Online Table W2 lists in full the questions and response categories.7
Beneficence refers to the sense of making a positive contribution to society, that is, doing something that benefits other people. In the workplace, jobs high in beneficence put the worker’s actions into a bigger social context and fulfill a need for sense making (Grant 2007, 2008b; Meier and Stutzer 2008; Aknin et al. 2013). We follow previous research that uses downloadable data from the O*NET database to measure occupational traits and work conditions.8 We select four variables to capture beneficence: (i) concern for others, (ii) social perceptiveness, (iii) assisting and caring for others, and (iv) service orientation. Online Table W3 lists the detailed descriptions of these traits. We link them to our data by a cross-walk between occupation codes at the four-digit level. After standardizing the four variables to a mean of zero and a standard deviation of one, we take the average to get an aggregate index value for each occupation and then standardize this average.
2.2.4. Hierarchical Position.
We use three variables to categorize hierarchical positions according to an intuitive categorization based on workplace size and self-reported data on being a supervisor and the number of subordinates. Robustness tests show that our results remain the same with an alternative definition by which we set the cutoffs based on variable distributions. Respondents answer yes or no to whether the job involves “leading or delegating the work of others,” and those who respond affirmatively are asked to give their number of subordinates. We categorize workplaces into three sizes: 1–5 (small), 6–49 (medium), and 50+ (large) people. Within these, we also categorize subordinates (versus managers), using the supervisor indicator. Small firms only have these two positions. In medium-size firms, we separate middle and top managers by their number of subordinates (<26 or ≥26). In large firms, we distinguish between lower middle managers (subordinates <26), upper middle managers (subordinates 26–50), and top managers (subordinates >51).
2.2.5. Female–Male Stereotype Index.
We use publicly available data from three papers that quantify gender stereotypes of jobs: Shinar (1975), Liben and Bigler (2002), and Kay et al. (2015).9 We match each paper’s index variable to the Swedish occupation codes by job title. This matching results in at least one index value for nearly two thirds (62%) of our observations. We standardize each index to a mean of zero and a standard deviation of one and analyze them separately. We combine them into a joint index by taking the average of any available values in each occupation. Higher values on our resulting female–male stereotype index indicate a more female-stereotyped job, and lower values indicate a more male-stereotyped one.
2.2.6. Demographic Traits.
The demographic traits used as control variables throughout the paper are the categories of age, education level, and (global) birth region listed in the top portion of Table 1.
2.3. Validating Our Measurement of Meaningful Work
To provide some context for our measure, it is important to note that, in the field of organizational behavior, there have been many different scales used in research on meaning at work, making it challenging to identify a single, agreed-upon, validated measure for this construct (see Rosso et al. 2010 for a review). In the few papers in economics on the topic, a single item is commonly used (Kaplan and Schulhofer-Wohl 2018, Cotofan et al. 2023), making our measurement consistent with this approach.10
We take several steps to validate our measurement of meaningful work. We first test whether this variable has statistical relationships in the expected directions with the four pathway variables from the meaning literature. Table 2 shows these correlations, first in a bivariate and then in a multivariate regression, including basic demographic controls and year fixed effects.11 These correlations are consistent with the four-factor model of the psychological underpinnings of meaningful work. All four factors correlate positively with self-reported meaning with statistical significance at the 1% level on aggregate as well as if we split the analysis by sex at birth (see Online Table W5 for correlations split by gender). These correlations support the validity of our measure despite the variable being self-reported and the possibility that survey fatigue could result in noisy responses.
|
Table 2. Validating the Measurement of Meaningful Work
| DV: Meaningful work (Std) | (1) | (2) | (3) | (4) | (5) | (6) | (7) |
|---|---|---|---|---|---|---|---|
| Autonomy | 0.26*** | 0.27*** | 0.22*** | 0.22*** | |||
| (0.00) | (0.00) | (0.00) | (0.01) | ||||
| Competence | 0.17*** | 0.13*** | 0.12*** | 0.12*** | |||
| (0.00) | (0.00) | (0.00) | (0.00) | ||||
| Relatedness | 0.18*** | 0.12*** | 0.13*** | 0.14*** | |||
| (0.00) | (0.00) | (0.00) | (0.00) | ||||
| Beneficence | 0.24*** | 0.28*** | 0.29*** | 0.28*** | |||
| (0.00) | (0.00) | (0.01) | (0.01) | ||||
| Log(Wage) | 0.25*** | 0.23*** | |||||
| (0.02) | (0.02) | ||||||
| Demographic controls | X | ||||||
| Year fixed effects | X | ||||||
| Observations | 88,173 | 111,199 | 86,886 | 110,499 | 84,193 | 39,380 | 39,380 |
Notes. The table shows estimates from regressing meaning at work in standard deviations on four pathway variables, also in standard deviations, and controls. Demographic controls are education level (three dummies), age (three dummies), and region of birth (two dummies). Standard errors in parentheses.
***p < 0.01; **p < 0.05; *p < 0.1.
Interestingly, the sizes of the correlations differ in two ways for women and men (Online Table W5). Whereas the correlations for competence, relatedness, and log wages are highly similar in size, men’s experience of meaningful work is more highly correlated with autonomy than that of women (0.35 versus 0.22), and women’s experience of meaningful work is more highly correlated with beneficence than that of men (0.29 versus 0.18).
A second validation test shows that self-reported meaningful work is correlated in the expected directions with job satisfaction, leave considerations, and turnover. Figure 1 reports point estimates from regressing these three outcomes (measurement details in the figure note) on the meaningful work variable. Black dots show estimates from bivariate regressions with only year fixed effects, dark gray dots from specifications that add demographic controls, and light gray dots from specifications with fixed effects for year and workplace.
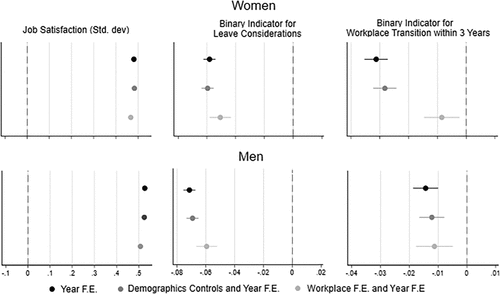
Notes. The figure shows point estimates from regressing three work outcomes on self-reported meaningful work in standard deviations from the Swedish Work Environment Survey. Job satisfaction is measured with the question “Do you feel very dissatisfied or very satisfied with your job?” answered on a five-point scale ranging from “very dissatisfied” to “very satisfied” and transformed to standard deviations. Leave considerations is a dummy variable for responding yes to the question “Have you considered quitting your job for health reasons in the last 12 months?” Workplace transition is a dummy variable for transitioning to a new workplace within three years of taking the survey: one for switching and zero for remaining. A workplace is the unique combination of the organization and establishment ID codes for a person’s largest source of labor income in a particular year. This dummy is set to missing if the surveyed workplace ceases to exist in the three-year window, and we also exclude respondents who reach the legal retirement age within this window (62 or older in the survey year). To focus on voluntary exits, it is also set to missing if the person transitions to nonemployment, defined as a transition where annual labor drops below 0.5 Swedish price base amounts (US$2,750) (following Hotz et al. 2018). Demographic controls are dummies for three age categories, three education categories, and three categories of birth region. Numerical estimates and sample sizes are reported in Online Table W6.
For both women and men, a one-standard-deviation increase in meaning is associated with about a 0.5-standard-deviation increase in self-reported job satisfaction. Our measure of meaning is, therefore, correlated with job satisfaction in the expected way. The positive but moderate correlation is also consistent with meaning and job satisfaction being separate concepts. “Meaning” refers to one attribute that would arguably contribute to one’s job satisfaction. Meanwhile, job satisfaction is a broader construct that encompasses many other aspects in addition to meaning, such as job security, scheduling flexibility, and income to name a few.12
Our measure of meaning is also associated with a five- to seven-percentage-point lower likelihood of considering leaving the employer for health reasons against baseline proportions of 23% for women and 17% for men. The correlations with actual job transitions are smaller but statistically significant at the 5% level across specifications at about one to three percentage points against baseline proportions of 20% for women and 18% for men. The overall picture in Figure 1 is that women and men value meaning at work similarly. Estimate sizes are mostly similar by gender, and those that differ do so in opposite directions. Looking at the estimates without workplace fixed effects, men’s estimates on leave considerations are slightly larger than women’s, and women’s estimates on job transitions are slightly larger than men’s.
Taken together, these analyses provide support for the use of our measurement as a proxy for meaningful work. Our results are also robust to alternate coding of our main variable.13
3. Descriptive Statistics of Meaningful Work
To begin to explore gender differences in meaningful work, we first report the gender gap in self-reported meaningful work and the variation in meaningfulness for women and men across the control variables in our analysis: survey year, demographics (age, education, and region of birth), and wages.
Pooling all survey years, we observe that women in the Swedish labor market experience their jobs as more meaningful than men do. The gap is 0.18 standard deviations to women’s advantage.14 This is consistent with findings in recent research focused on the U.S. labor market (Kaplan and Schulhofer-Wohl 2018, Maestas et al. 2023). Splitting the comparison by survey year shows that the gender gap is present from the start of our sample period and grows slowly over time (Figure 2, panel (a) male and female, panel (b) difference). The gap doubled in size from about 0.1 standard deviations in 1991 to about 0.2 standard deviations 28 years later in 2019.
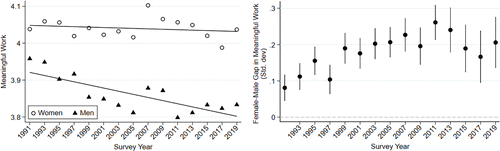
Notes. The left side shows averages of the ordinal variable for self-reported meaningful work by sex at birth in each wave of the Swedish Work Environment Survey (1991–2019, n = 111,599). The right side standardizes the variable for meaningful work and reports yearly female–male gaps in standard deviations along with 95% confidence intervals.
Levels of meaningful work covary with some of the demographic traits (left-hand side of Online Figure W1). Self-reported meaning increases with age from the 20 s into the 50 s, after which the level stabilizes. Tertiary education is associated with the experience of work as more meaningful work, whereas there is little variation across region of birth.
The relationship between age and meaningful work is similar for both women and men, though we observe that the gender gap is larger at middle age brackets compared with younger or older age brackets. The gender gap is the smallest at the lowest level of education (0.05 std; 15% of the data are in this category, Table 1) and larger at the two higher ones (0.15–0.20). Gender gaps are similar across regions of birth.
Wages are positively correlated with meaning among both women and men (Figure 3, panel (a) male and female, panel (b) difference), but this relationship is steeper for men than for women in the top portion of the wage distribution. Meaning is expected to be positively correlated with income because some of the pathways to meaning (e.g., autonomy and competence) are positively correlated with income. Average meaningfulness for men in the top 5% of the wage distribution lies 0.65 scale steps (0.65 standard deviations) above the average for the bottom 5%, whereas the corresponding increase for women is somewhat smaller at 0.47 scale steps. In the lower half of the wage distribution, women lead men in meaningful work by about 0.4 standard deviations (albeit less so in the lowest paid jobs). The gap declines gradually in the top 20% of the wage distribution and reaches zero at the top.
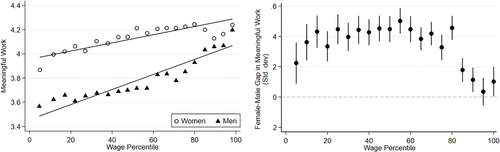
Notes. The left-side figure shows averages of the ordinal variable for self-reported meaningful work by gender for increments of five percentiles of the wage distribution, calculated by year in the entire Swedish employed, working-age population. Wage data are available for 1997–2019 (n = 41,475). The right-side figure standardizes the variable for meaningful work and reports yearly female–male gender gaps in standard deviations along with 95% confidence intervals.
4. Patterns Underlying the Gender Gap in Meaningful Work
Having documented the existence of a gender gap in meaningful work, we now explore the relationship between this gap and (1) changes in work environments as women and men become parents, (2) overrepresentation of men at higher hierarchical positions in organizations, and (3) horizontal occupational segregation of women and men into jobs with different traits.
A long-standing literature in sociology and a growing literature in economics emphasize that first parenthood can trigger increased gender inequality in the labor market (Waldfogel 1997, Budig and England 2001, Angelov et al. 2016). Parenthood activates reevaluations of labor market choices in ways that are influenced by gender norms for parental responsibilities (Hochschild 1989). Women may seek work arrangements with shorter work hours and commutes, for example, to facilitate their greater parental responsibilities in the household (e.g., Felfe 2012, Le Barbanchon et al. 2021). A result of particular interest to our analysis is that of Pertold-Gebicka et al. (2016). Using Danish administrative data, they find that women but not men switch into the public sector when becoming parents. If parenthood leads women to switch into the public sector, this might simultaneously increase their experience of work as more meaningful (e.g., Besley and Ghatak 2005, Dur and Zoutenbier 2014).
Vertical and horizontal gender segregation are important characteristics of gender differences in the labor market (e.g., Blau and Kahn 2017). Vertical segregation refers to a declining proportion of women at higher organizational positions compared with lower ones (Levanon and Grusky 2016). Horizontal segregation refers to the uneven distribution of women and men across occupations. Both forms of segregation may be relevant to the gender gap in meaningfulness because jobs at different vertical and horizontal levels may differ widely in both the nature of their tasks and work environments.
We start by reporting how the gender gap in meaningful work responds to holding constant variables that correspond to these three factors. We regress meaning in standard deviations on a dummy variable for female sex at birth (column (1), Table 3) and add controls in the subsequent columns. The gap of 0.18 standard deviations declines slightly to 0.15 with demographic controls (column (2)). It barely moves in size when holding constant parenthood (yes = 1 and no = 0, column (3)). Adding dummies for the nine hierarchical positions does not close the gap, instead increasing it slightly (column (4)). The fixed effects for occupation (364 titles), by contrast, make a bigger difference; adding these shrinks the gap to 0.04 in column (5).15 Comparing the impact of the occupation fixed effects to a specification that includes both parenthood and hierarchical position (from column (6) and (7)) shows a similar drop.
|
Table 3. Regression Analysis for the Gender Gap in Meaningful Work
| DV: Meaningful work (Std. dev) | (1) | (2) | (3) | (4) | (5) | (6) | (7) |
|---|---|---|---|---|---|---|---|
| Woman | 0.18*** | 0.15*** | 0.14*** | 0.19*** | 0.04*** | 0.18*** | 0.05*** |
| (0.01) | (0.01) | (0.01) | (0.01) | (0.01) | (0.01) | (0.01) | |
| Year fixed effects | x | x | x | X | x | x | x |
| Demographic controls | x | x | X | x | x | x | |
| Parenthood dummy | x | x | x | ||||
| Hierarchy dummies | x | x | x | ||||
| Occupation fixed effects | x | x | |||||
| Observations | 111,566 | 111,566 | 111,566 | 111,146 | 111,566 | 111,146 | 111,146 |
Notes. Standard errors in parentheses. Data are 15 pooled cross-sections of the Swedish Work Environment Survey (1991–2019). Parenthood is a dummy variable for being the parent to at least one child. Hierarchy dummies are nine dummies for categories within three firm sizes and levels (see Section 2.2). Demographic controls are education level (three dummies), age (three dummies), and region of birth (two dummies).
***p < 0.01; **p < 0.05; *p < 0.1.
Online Table W7 shows that these results replicate in a sample excluding observations for “meaningless” jobs and holding constant log wages throughout the analysis. Controlling for wage increases the size of the gender gap in meaning (from 0.28 to 0.35 in the sample with nonmissing wage data), whereas occupation fixed effects reduce the size of the gap by about one half. Online Table W7, Panel C, presents the same regressions as in Table 3 but with job satisfaction as the dependent variable (DV). This gap is smaller, and controlling for occupation in those regressions does not affect the size. Interestingly, this suggests that occupation plays an important role in influencing meaning, but not in determining job satisfaction, which is a broader concept.
Whereas the parenthood dummy did not affect the gender gap in meaning in Table 3, this crude specification might not capture dynamic changes that happen around first parenthood. A more detailed analysis supports the lack of importance of first parenthood in explaining the gender gap in meaning, however. Following the method of Pertold-Gebicka et al. (2016), we estimate the gender gap in meaningful work for time points starting five years before a first child’s birth and ending 10 years thereafter. This analysis replicates the expansion of gender gaps in log labor income, part-time work, and to a smaller extent log wages at first parenthood (Online Figure W2). At the same time, there is no expansion of the gap in meaningfulness (Online Figure W3). This result holds across subsamples of data with different lengths and gender divisions of paid parental leave (Online Figures W4 and W5).16 Section W1 in the online appendix describes these analyses of parenthood and meaningful work in more detail.
The regression analysis in Table 3 also suggests that, notably, there is no relationship between vertical segregation and the gender gap in meaningful work. We provide more evidence of this by showing how average levels of meaningfulness vary across hierarchical levels (left-hand side of Figure 4) and by gender (right-hand side of Figure 4). The gap between subordinates and managers is small in small workplaces at just 0.06 standard deviations. In medium- and large-size workplaces, however, managers experience 0.4 to 0.5 standard deviations higher meaningfulness than subordinates (this pattern mirrors previous research, e.g., Bowie 1998, Martela and Riekki 2018).17

Notes. The left side shows averages of the ordinal variable for self-reported meaningful work by hierarchical level. Data are 15 waves of the Swedish Work Environment Survey (1991–2019, n = 111,146). The right side reports averages by sex at birth.
Figure 4 also shows that women’s average level of meaning is higher at all hierarchical levels, and furthermore, there does not appear to be a clear pattern in the relative size of this gender gap across hierarchical levels. To understand what this means for the aggregate gender gap in meaningful work, it is important to note that there is a declining share of women in higher positions. The share of women drops from 40% to 28% between the subordinate and manager positions in small workplaces, from 54% to 37% between the lowest and highest position in medium-size workplaces, and from 53% to 29% in large workplaces (detailed numbers are provided in Online Table W8). Our results are, thus, suggestive of the notion that women’s aggregate level of meaning in the labor market would be (even) higher relative to men’s if vertical gender segregation was eliminated. In other words, the gender gap in meaningful work exists despite vertical gender segregation.18
4.1. Exploring Occupational Traits and Meaningful Work
The analysis so far clearly points to occupational segregation as central for understanding the gender gap in meaningful work. Our analysis shows that between 50% and 75% of the gender gap appears to be explained by women’s sorting into occupations from which both men and women derive higher meaning. Indeed, the gap could arise because occupations more commonly held by women are experienced as more meaningful by both women and men. It could also arise because women experience occupations with certain traits as more meaningful than their male colleagues occupying the same job.
We start by comparing levels of meaning in occupations with different shares of women. We calculate the share of women in each four-digit occupation at the annual level for the full Swedish workforce and match these proportions with the survey data. We then plot meaning by gender and brackets of this variable (Figure 5). This shows that strongly female-dominated occupations are experienced as more meaningful and strongly male-dominated occupations are experienced as less meaningful by both genders. The gender gaps are small (below 0.05 standard deviations and lacking statistical significance at the 5% level) when the share of women in the occupation is between 20% and 70%. The meaning advantage for women appears in the most female-dominated occupations (80% and over), and interestingly, men self-report their work as more meaningful than women by about 0.2 standard deviations when the share of women in the occupation is between 0% and 10% (Figure 5). We return to these potential gaps within occupations later.
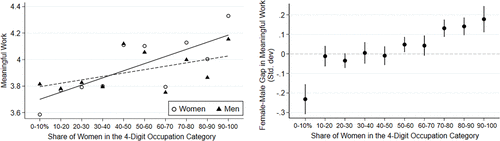
Notes. Data are pooled biannual cross-sections of the Swedish Work Environment Survey (1991–2019). The left figure splits the data into 20 equally large bins; the right side shows female–male gaps with 95% confidence intervals for 10-percentage-point intervals in the share of women. n = 111,599.
Given that both men and women appear to derive greater meaning from female-dominated occupations as seen in Figure 5, we next ask: what factors make jobs commonly held by women more meaningful than jobs commonly held by men? To answer this question, we test whether occupations with more women have higher levels of each of the four meaning pathway variables. We then use a simple regression analysis to test whether such correlations can help to explain the aggregate gender gap in meaningful work.
Figure 6 shows binned averages for the pathway variables across the occupations’ share of women. Of the four variables, beneficence stands out as strongly correlated with the share of women. Going from 0% to 100% women in an occupation is associated with a two-standard-deviation higher score on the beneficence trait. Looking at the data for specific occupations provides some additional insight into what is driving this pattern. Among the specific occupations with the highest beneficence levels are highly female-dominated occupations, such as nursing associate professionals and nursing and midwifery professionals. Conversely, we see some of the lowest beneficence levels in male-dominated occupations such as miners, shotfirers and quarry workers, and lifting-truck operators.
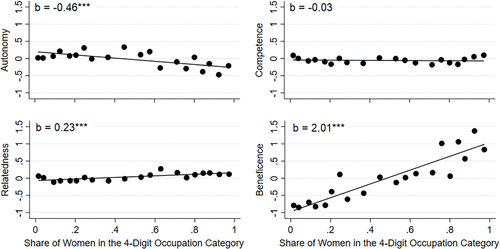
Notes. The figure shows binned averages of four pathway variables for meaningful work described in Section 2.2 and Online Table W3 across the share of women in four-digit occupations. The data are 15 pooled cross-sections of the Swedish Work Environment Survey, restricted to observations with nonmissing data for the four-digit occupation code, n = 84,193 for observations with nonmissing values on all variables in the figure. b-coefficients from bivariate ordinary least squares (OLS) regression lines, *** p < 0.01, ** p < 0.05, * p < 0.1.
The other three meaning pathway variables are not positively correlated with the share of women. Autonomy, if anything, has a negative correlation with proportion of women in an occupation; competence has a near-zero correlation; and relatedness has a positive correlation (though smaller than that for beneficence).
Table 4 shows results from a regression analysis that examines whether the pathway variables help to close the gender gap. The outcome variable is meaningfulness in standard deviations, which we regress on the dummy for female and the four pathway variables both in separate regression and together. By examining how the coefficient on the female dummy changes, we can test whether the level of beneficence or that of the other three traits most explains the gender gap in meaning.
|
Table 4. The Gender Gap in Meaningful Work and Four Pathway Variables
| DV: Meaningful work (Std. dev) | (1) | (2) | (3) | (4) | (5) | (6) |
|---|---|---|---|---|---|---|
| Female | 0.17*** | 0.26*** | 0.17*** | 0.15*** | 0.02** | 0.06*** |
| (0.01) | (0.01) | (0.01) | (0.01) | (0.01) | (0.01) | |
| Autonomy | 0.26*** | 0.25*** | ||||
| (0.00) | (0.00) | |||||
| Competence | 0.17*** | 0.12*** | ||||
| (0.00) | (0.00) | |||||
| Relatedness | 0.19*** | 0.13*** | ||||
| (0.00) | (0.00) | |||||
| Beneficence | 0.21*** | 0.25*** | ||||
| (0.00) | (0.00) | |||||
| Year fixed effects | x | x | x | x | x | x |
| Demographic controls | x | x | x | x | x | x |
| Observations | 84,193 | 84,193 | 84,193 | 84,193 | 84,193 | 84,193 |
Notes. Standard errors in parentheses. Data are 15 pooled cross-sections of the Swedish Work Environment Survey (1991–2019). Demographic controls are fixed effects for categories of age, education level, and birth region (see Table 1).
***p < 0.01; **p < 0.05; *p < 0.1.
The results in Table 4 for adding each of the job traits separately in columns (2)–(5) shows that only beneficence appears to account for the gender gap. The average gap of 0.17 standard deviations (column (1)) increases rather than decreases (to 0.26) when holding constant autonomy. It is not affected by adding competence and relatedness. Notably, the average gap goes to zero when we add beneficence. This suggests that the fact that female-dominated occupations have a higher level of beneficence is an important explanation of the gender gap in meaningful work.19
Next, we examine the gender gap in meaningful work within occupations. As we already saw in Figure 5, women’s and men’s levels of meaning differ somewhat by share of women in the occupation. The female–male gap shown in the right-hand side of Figure 5 for different levels of this variable reflects a higher value for women than men in female-dominated occupations and the opposite in the most male-dominated occupations. Women find strongly female-dominated occupations to be more meaningful than their male counterparts, and men find the most male-dominated jobs to be more meaningful than do women.
We analyze whether women have a larger meaning advantage in jobs with higher levels of the four pathway variables. To do so, we estimate
Here, the outcome variable is meaningful work in standard deviations, F is the dummy variable for female sex at birth, and Trait is each of the pathway variables. A positive estimate of the coefficient on the interaction between female sex and the trait, β, shows that the female–male gap in meaningfulness is larger in occupations with a higher level of a given occupational trait (e.g., beneficence). The key control is αo, occupation fixed effects at the four-digit level, which allows us to isolate the within-occupation variation in meaning across men and women. Finally, we include year fixed effects αt and demographic controls X and cluster the standard errors at the four-digit occupation level.
The results in Table 5 show that women experience more meaning relative to men in occupations that have higher levels of beneficence. A one-standard-deviation higher value of beneficence is related to an increase in the gender gap in meaning by nearly 0.1 of a standard deviation. A one standard deviation higher level of autonomy has the opposite correlation. It is related to a similarly large decrease (reversal) of the gender gap. For competence and relatedness, the coefficients are close to zero and small.
|
Table 5. Within-Occupation Gender Gaps in Meaningful Work
| DV: Meaningful work (Std. dev) | Trait: Autonomy | Trait: Competence | Trait: Relatedness | Trait: Beneficence |
|---|---|---|---|---|
| (1) | (2) | (3) | (4) | |
| Trait × Female | −0.08*** | 0.01 | −0.01 | 0.09*** |
| (0.01) | (0.01) | (0.01) | (0.02) | |
| Trait | 0.32*** | 0.13*** | 0.19*** | — |
| (0.01) | (0.01) | (0.01) | ||
| Demographic controls | x | x | x | x |
| Time fixed effects | x | x | x | x |
| Occupation fixed effects | x | x | x | x |
| Observations | 84,193 | 84,193 | 84,193 | 84,193 |
Notes. The table shows estimates for the interaction effect between the dummy variable for female and each index listed at the top of the column and estimated with regression Equation (1). Standard errors clustered at the four-digit occupation level in parentheses. Column (4) is empty for the beneficence trait because it is measured at the occupation level; as such, estimating Equation (1) does not give us an estimate on the uninteracted trait variable.
***p < 0.01; **p < 0.05; *p < 0.1.
In sum, we find evidence of two ways that occupational gender segregation contributes to women’s higher level of meaningful work in the labor market. Women are more likely to be employed in occupations that both women and men find to be more meaningful and that, on average, have higher levels of beneficence. Women also find jobs with high beneficence (even) more meaningful than men do. These patterns might have several underlying theoretical explanations. Women might have stronger preferences for prosocial jobs or greater skills in performing such jobs, or they might receive more positive reactions from society when holding them. Whereas we cannot disentangle or disprove these explanations, we can discuss their validity in light of our data.
Regarding preferences, surveys show that women place greater value on the social value of work. When asked what motivates their career choice, women are more likely to cite opportunities to be helpful to others in society and to work with people, whereas men are more likely to cite economic opportunities (Fortin 2008). Burbano et al. (2023) use cross-country survey data and a conjoint analysis with U.S. MBA students to show that women find the social aspects of a job to be more important than men do, especially in highly developed countries and among highly skilled individuals, and this affects their industry of work. Non et al. (2022) use a discrete choice experiment to demonstrate that companies with prosocial missions are particularly valued by women.
Other research argues that women have superior social skills than men and, therefore, sort into “people-oriented” occupations. Borghans et al. (2014) show that people with greater self-reported social skills are more likely to work in occupations that place a greater emphasis on “people tasks” and these occupations also have higher shares of women. Lordan and Pischke (2022) use data from three countries to show that women’s job satisfaction is greater in jobs with job attributes of “people” and “brains” and lower for “brawn.” There is no correlation for men.
Gender norms can help to explain the higher shares of women in occupations with higher beneficence. Prosocial jobs and/or the tasks performed in them are more strongly associated with the female social role (Croft et al. 2015, Block et al. 2018). This is particularly true for care-oriented jobs (Shinar 1975, Fiske and Stevens 1993, Liben and Bigler 2002, Abele 2003, Kay et al. 2015).20 Breaking gender norms in one’s occupational choice might both depress a person’s sense of self and cause negative, retaliatory reactions from colleagues and broader society as formalized by Akerlof and Kranton (2000). Over time, the female gender role has broadened more than the male though the disparity in roles persists (Croft et al. 2015). Agentic traits have become somewhat more accepted as part of the female gender role, whereas communal traits have not become more accepted as part of the male role (Croft et al. 2015, Sendén et al. 2019).
An analysis of the index of gender stereotypes of occupations supports this conjecture. Jobs with the highest beneficence are also the most strongly female-stereotyped according to our index (described in Section 2.2). The pairwise correlation coefficient between the two variables is 0.73 (Online Figure W8 graphs this correlation and Online Figure W9 the correlation for each of the three subindices). Using the gender stereotype index instead of the pathway traits in the interaction model (Equation (1)) also shows the same pattern: larger gaps in the most female-stereotyped occupations (results in Online Table W11).
4.2. External Validity
Sweden is a country with a high level of economic development and stability and relatively small income inequality, including between women and men. It has a large and universalistic welfare state with generous policies of parental leave and job loss protection, which might have implications for the external validity of our results.
To help address the external validity of our Swedish data sample, we complement our study with cross-country survey data from the 2015 Work Orientation Module in the International Social Survey Programme (2017). We follow Hu and Hirsh (2017) and combine three survey questions into an index of meaningful work: ratings regarding “My job is useful to society,” “My job is interesting,” and “In my job, I can help other people.” This data enables us to make three observations about the experience of meaning at work in a larger, cross-country sample that are consistent with our findings from the Swedish context. First, women’s average meaning at work is higher than men’s, and this difference is mainly correlated with the third component of helping others. Second, the level of meaning is higher in occupations with a larger share of women, and this relationship, too, is highly correlated with the beneficence component. Third, the gender gap and correlation with the occupation’s share of women are of similar sizes in split sample analysis of countries with different levels of economic development, inequality, and volatility. Our results are, therefore, seemingly consistent across different contexts—some similar to Sweden and some very different. Details of this analysis are provided in Online Appendix Section W2, Tables W12 and W13.
5. Implications for Gender Inequality in Work Compensation
Finally, we examine how a valuation of meaningful work affects estimates of gender inequalities in work compensation and, as a result, a broader conceptualization of gender inequality in well-being in the labor market. To understand how the experience of meaning at work affects gender inequalities in work compensation across the wage distribution, we need to examine two things. First, we need to know men’s and women’s monetary valuation of meaningful work; second, we need to combine this information with information on the level of meaningful work across different wage levels (already discussed in Section 3 and shown in Figure 3).
Recent research shows that workers are willing to sacrifice wages to work at jobs with characteristics we expect to correlate with greater meaning. People hired in field experiments were willing to work for 12% and 44% less when informed about the corporate social responsibility of the hiring firm (Burbano 2016) and for 26% less when informed about the hiring firm’s social mission to help children (Hedblom et al. 2019) for example. A hypothetical job choice experiment by Maestas et al. (2023) quantifies the valuation of jobs with “frequent” rather than “occasional” opportunities to make a positive impact on one’s community or society. Although men and women were not statistically different from each other at the 5% level, men valued this job trait as the equivalent of a 4.4-percentage-point wage increase and women as a 3.6-percentage-point increase.
To calculate the monetary equivalent for meaningful work more directly, we use the method proposed in Bell (2020). This method seeks to overcome the challenge of controlling for individual ability in observational data. As we see in Figure 3, meaningful work correlates positively with higher wages, which could be due to more productive workers both receiving higher wages and experiencing their jobs as more meaningful. Holding individual productivity constant is, therefore, key to reliably estimating the potential wage reduction—a negative compensating differential—that workers incur to obtain more meaningful work.
Figure 7 reports a sequence of point estimates on the variable for meaningful work (in standard deviations) in regressions with log wage as the outcome. For comparison, the top marker shows the positive point estimate from a bivariate regression. To make workers more comparable, we then add control variables for demographics, parenthood and civil status, and fixed effects for sector (seven categories), industry (five-digit code), and occupation (four-digit codes). This pulls the point estimate toward zero. The bottom point estimate adds Bell’s (2020) approach to controlling for unobserved ability in the wage regression and lets the estimate on the amenity capture the difference in wage between workers who are closely comparable in this aspect but have different amenity levels. To measure unobserved ability, Bell (2020) proposes to first regress a proxy for ability (here, years of education) on the wage and the amenity (here, meaningful work). The predicted level of ability (education) from this regression is then used as the control for unobserved ability in a regression of wages on the amenity of focus (meaningful work) and no other controls. With this adjustment, we now observe negative point estimates on the wage variable. The size indicates that a one-standard-deviation increase in meaning of work is associated with a negative compensating differential of about 4%–5% of the wage and is similar for men and women.
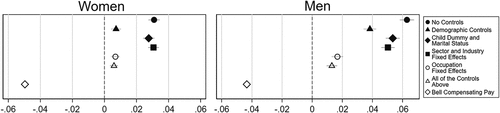
Notes. Estimated coefficients from OLS regressions of the individual log(wage) on self-reported meaningful work in standard deviations. Demographic controls are dummies for four age categories, two dummies for having secondary or tertiary education, and two dummies for being born in Europe or outside Europe with Sweden as the reference. The child dummy takes the value one for respondents who are parents and zero otherwise, and the same for the dummy for marriage. Sector fixed effects are for seven categories, and industry fixed effects are for five-digit industry codes. Occupation fixed effects are at the four-digit level of the Swedish occupation code (SSYK). The bottom estimate implements Bell’s (2020) method for estimating compensating pay with education as the ability proxy. Wage data come from the Swedish official salary statistics. N women = 23,987; N men = 17,632.
A sample split analysis by time (before and after 2006) shows no difference in the estimated sizes of men’s and women’s compensating differentials (top panel of Online Table W15). A sample split by wage level (above or below median) shows a large difference (bottom panel of Online Table W15). In the lower half of the wage distribution, women’s and men’s estimates are similar at 3% for women and 2% for men. In the top half, both groups have larger estimates, and the women’s estimate of 12% is twice as large as the men’s of 6%. We return to this heterogeneity later.
One might worry that the results in Figure 7, in which Bell’s (2020) estimation method produces a negative sign on the amenity variable in the wage regression, is an artifact of the method itself or, alternatively, is unique to meaningful work. To help address this potential concern, Online Figure W10 shows that the method also returns compensating differentials in the expected directions for other amenities: flexible work times, physical exhaustion (reverse coded), and influence over work structure.21 Notably, these numbers should be interpreted as realized pay differences resulting from both demand and supply for an amenity rather than a pure measure of preferences.
We can now use the monetary valuation of meaningful work to examine the degree to which it affects estimates of gender (remuneration) inequality in the labor market. For the years for which we have wage data (1997–2019), the unadjusted wage gap is 13.4% to women’s disadvantage, whereas the gender difference in meaning is 0.27 standard deviations. By multiplying each individual’s level of meaningful work with the gender-specific compensating pay for this amenity, we can measure the gender difference in meaning in wage equivalencies. Performing this calculation shows that the gender gap in meaning is equivalent to a 1.2-percentage-point wage difference. Thus, on average, women’s higher meaning of work compensates for about 9.5% of the gender wage gap.22
We further extend the analysis to study the impact of the gender gap in meaningful work on the gender wage gap over time and across the wage distribution. This analysis plots the heterogeneity in the gender wage gap in log points to the log point gap in the combined measure of wages plus the monetary equivalent of meaningfulness. Figure 8 shows these results across survey years (left side) and wage percentiles grouped into deciles (right side).
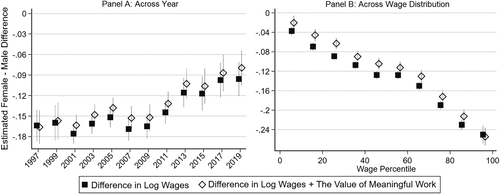
Notes. The black markers in the left graph show the estimate on a dummy variable for female sex at birth in wage regressions run in subsamples of data for each survey year. The black markers in the right graph show those coefficients for subsamples of 10 wage percentiles, in which wage percentiles are calculated by year, age, and gender for the employed labor force. Vertical lines show 95% confidence intervals. Gray dots show the female–male gender gap in the sum of the wage and monetary equivalent of meaning. The latter is calculated by multiplying the individual’s reported level of meaning with the estimated value of meaning from Figure 7.
The unadjusted gender wage gap decreased four percentage points from 16% to 10% between 1997 and 2019. After factoring in the growing gender gap in meaningful work (recall Figure 2), the gap decreased even more, starting at 16% and ending at about 8%. Women’s growing advantage in meaningful work, hence, contributed to a more rapid convergence of total work “compensation” than that observable from wage statistics alone.
As in other countries, the Swedish gender wage gap grows toward the top of the wage distribution (e.g., Blau and Kahn 2017). Recall that, in Figure 3, the gender gap in meaning has the opposite pattern with women enjoying an advantage in lower wage jobs but no advantage in higher paid ones. It follows that the gender gap in meaningful work compensates for a relatively large fraction of the gender wage gap—around one fifth—when wages are relatively low. In high-wage jobs, however, the larger gender wage gap does not change when adding the valuation of the (negligible) gender gap in meaningful work. This suggests that even a broader conceptualization of gender inequality in the labor market that incorporates both monetary and this aspect of nonmonetary remuneration remains stark and significant when gender wage inequality is most pronounced: at the higher end of the wage distribution.
6. Discussion and Conclusions
Most people spend most of their waking hours at work. Whether this work is meaningful or meaningless is, therefore, fundamental for individuals’ well-being at work as well as for their general well-being. Research on gender differences in the labor market documents many advantages for men in terms of wages, status, and prestige, for example. This paper shows that women experience a relative benefit in one work characteristic—meaning at work—and explores factors underlying this pattern.
Using detailed Swedish data, we find no evidence that the gender gap in meaning stems from changing labor market choices at parenthood unlike gender gaps in earnings or flexible work conditions that have been linked to this life event. We also find no support for the notion that the relative positioning of men and women along hierarchical positions (vertical segregation) might serve as an explanation for women’s higher level of meaning. We find a strong relationship between the gender gap in meaningful work and the overrepresentation of women in certain kinds of occupations: those having a high level of beneficence, that is, a greater prosocial impact. We find evidence of a somewhat nuanced relationship between the beneficence of occupations and the experience of meaning by gender. Though both men and women experience high-beneficence occupations as more meaningful, this relationship is even stronger for women, creating a within-occupation gender gap in meaningful work that grows with the beneficence level of a job. We provide suggestive evidence that gender stereotypes may offer one possible explanation for this pattern. Given that high-beneficence occupations align more closely with the female gender stereotype, this may lead men to derive less meaning from taking on these role-incongruent jobs. This mechanism is consistent with evidence that prosocial jobs are more strongly associated with the female social role (Croft et al. 2015, Block et al. 2018) as well as with the notion that women find prosocial aspects of a job more important than men do (Burbano et al. 2023). Certainly, gender differences in preferences or skills could also contribute to higher shares of women in occupations with higher beneficence; future work could seek to disentangle these potential mechanisms.
We examine one important implication of the gender gap in meaningful work by considering whether women’s higher experience of meaningful work might change our interpretation or assessment of gender inequality in remuneration at work if we consider total work remuneration to be a function of both meaning and wages. Because women experience their work as more meaningful than men, we expect that adding the monetary valuation of this amenity to that of wages would reduce the size of the gender remuneration gap compared with that of the gender wage gap alone. Notably, when considering this implication across the wage distribution, we find that this only applies to jobs in the lower half of the wage distribution and does not affect the gender wage gap when it is the largest: for the highest paying jobs. We emphasize that we do not mean to imply a reduced societal imperative to address the gender wage gap. We do, however, contend that meaning at work is an important job attribute to include when capturing a complete picture of working conditions and worker well-being. We focus on one job attribute; future work could examine other job amenities in addition to meaningful work.
One pathway to gender equality in meaningful work could involve an inflow of men into female-dominated occupations with high beneficence. This process has been slow, however, potentially because of lower wages and interpersonal mistreatment of these male gender minorities (Folke and Rickne 2022). Raising wages in these meaningful jobs and combating sexual harassment could help facilitate occupational integration. Softening gender norms that may make men less reluctant to take these jobs might also increase their sense of meaningfulness once holding them, which could be another pathway.
Our paper is not without limitations that point to opportunities for future research. One limitation is that our exploration of the explanations of the gender difference in meaningful work provides correlational but not causal evidence that gender stereotypes related to job traits such as beneficence cause gender differences in experiences of meaning. Future work could test whether the patterns we observe are causal in nature.
Given that our data come from Sweden, it is important to note that there may be specifics of the Swedish context that contribute to our results such that replication in other country contexts serve as helpful complements to our paper. Nonetheless, we maintain that these data also come with a number of substantial advantages over that used in previous studies on meaningful work by enabling us to match to administrative (real-world rather than self-reported) workplace data and wage levels and enabling us to examine the gender gap in meaningful work across an entire labor market (rather than being limited to certain industries or convenience samples among, for example, university students). Furthermore, to strengthen the case for external validity, we show that cross-country survey data replicates the gender gap in meaningful work and its link to social beneficence as well as the link between women-dominated occupations and job traits. These correlations hold up across subsamples of countries with different macroeconomic conditions.
Our measure of meaningful work, given that it is based on a survey question, could be subject to social desirability bias. This could result in an over-characterization of women’s experience of meaning in female role–congruent jobs, for example. However, it is difficult to imagine a measure of meaning at work that is not self-reported given that the literature on meaning at work presumes that perceptions of meaning are rooted in individuals’ subjective interpretations of their work experiences (Brief and Nord 1990, Baumeister 1991, Wrzesniewski 2003, Rosso et al. 2010). It also seems unlikely that social desirability bias could explain all the patterns we observe, such as the aggregate gender gap in meaning at work being driven by men in lower paying jobs, for example.
We focus on examining a single implication of the gender difference in meaningful work by exploring how it relates to the gender wage gap. Future research could explore other implications. For example, researchers could explore whether men’s experience of work as less meaningful plays a role in helping to explain why men with low levels of education are overrepresented in “deaths of despair” related to drug overdoses, suicides, and alcohol-related liver mortality. Indeed, one explanation connects these deaths, which are, of course, the tip of the iceberg in terms of underlying stress, to negative prospects in the labor market and family life or a “loss of the structures that give life a meaning” (Case and Deaton 2017, p. 413). Future work could also explore political implications for the gender gap in meaningfulness at work; for example, whether men’s lower levels of meaningfulness might contribute to the rise in grievance-based politics and radical and radical-right populism among certain groups of men.
Given the importance of meaning at work to individual utility and well-being and, thus, to our understanding of well-being at work, it is notable that gender differences in this work characteristic have been relatively understudied. Our paper represents an important step forward in characterizing this important phenomenon.
The authors thank participants at multiple seminars and especially Mabel Abraham, Maria Cotofan, Robert Dur, and Anya Samek for very helpful comments. Equal authorship; author names are listed in alphabetical order.
1 Employees’ sense of meaning at work is also linked to organizational outcomes that benefit firms, including increased employee motivation (Rosso et al. 2010, Gartenberg et al. 2019), less absenteeism (Steger et al. 2012), and reduced turnover intentions (Scroggins 2008, Arnoux-Nicolas et al. 2016).
2 Of course, in line with other research that documents compensation differentials that reduce the effective wage gap (such as commuting distance in the case of Le Barbanchon et al. 2021 for example), we do not mean to imply a reduced societal imperative to addressing the gender wage gap. We do, however, emphasize that meaning at work is one important job attribute when considering a more complete picture of working conditions and well-being.
3 In this table and all other analysis, we deflate labor earnings and wages to constant prices.
4 We show the difference in variable means in the survey sample and in the population. Because of the large sample sizes, even very small differences are significant at a high confidence level, so we do not include significance “stars.”
5 In Swedish, Upplever du att mycket av ditt arbete är meningslöst eller meningsfullt? The Swedish term meningsfullt is not ambiguous and was not further explained in the question. A meaningful activity is generally defined as activity that is important or worthwhile.
6 (1) Can you, in general, determine your own work hours within certain boundaries? (2) Can you decide on your own pace of work? (3) Do you feel that your job is nonautonomous and unfree or autonomous and free? (4) Does it happen that you partake in decisions on the structure of your work (for example, what will be done, how it will be done, or which people will do the work together with you)?
7 (1) Does it happen that your manager shows appreciation for something that you did? (2) Does it happen that other people show appreciation for something that you did (e.g., colleagues, patients, customers, clients)? (3) Are you involved in any form of conflict or quarrel with supervisors/managers at work? (4) Are you involved in any form of conflict or quarrel with colleagues at work?
8 The O*NET database (http://www.O*NETonline.org/) collects data on the task content of jobs from stratified random samplings of workers. These data are frequently used in economics research on job traits. Prominent examples include research on job flexibility and gender (Goldin 2014) for example. Cortes and Pan (2018) study occupational gender segregation and measure occupations’ social contribution using three of the four variables in our index.
9 Shinar (1975) asked college students to quantify their perceptions of 129 occupational titles along a seven-point scale from masculine (one) to neutral (four) to feminine (seven). Liben and Bigler (2002) asked adults to score 80 occupations’ gender type on a seven-point scale between (1) for males only, (2) much more likely for males, (3) somewhat more likely for males, (4) equally likely for males and females, (5) somewhat more likely for females, (6) much more likely for females, (7) for females only. Kay et al. (2015) quantify stereotypes based on the top 100 Google Image search results. A first list of 96 occupations taken from the Bureau of Labor Statistics was restricted to those with searchable terms in the job titles. For these, three MTurkers labeled the gender of each individual in each image. Images in which at least two coders agreed that all portrayed individuals were either women or men were kept, and occupations with fewer than 80 remaining images were excluded. The gender index is the share of images portraying all women among these remaining 80+ images. Of the 96 job titles, 45 could be coded using this method. Most of the occupations in the three indices can be matched to our data: 90/129 for Shinar (1975), 65/80 for Liben and Bigler (2002), and 40/45 for Kay et al. (2015). Unmatched occupations are too narrow to fit even four-digit occupation codes, such as “President of the United States,” “FBI agent,” “Supreme Court judge,” “perfume salesperson,” “announcer,” or “football broadcaster.” Some have also aged out of the labor market, such as “elevator operator” and “telephone operator.”
10 To use our representative and repeated survey-based sample to which administrative data can be matched, we rely on the best proxy for our measure available in the survey.
11 We allow sample sizes to vary depending on availability of the variables and show in Online Table W4 that the results are not sensitive to using only observations with nonmissing data on all variables in the table.
12 In our results section, we discuss results that show, whereas there is a gender gap in job satisfaction (as has been shown by, e.g., Clark 1997), occupational fixed effects do not affect this gap. They do affect the gender gap in meaning, however. This suggests the important role of occupation in influencing meaning but not in determining job satisfaction, which is a broader concept.
13 For example, our results are robust to an alternate specification of the variable in which we code all the “meaningless” parts of the scale as zero and only code the “meaningful” parts of the scale as positive (see bottom of Online Table W4 and Panel A, Online Table W7).
14 The gap is the same size in the pathway variable sample (0.20) and larger in the wage sample (0.28), which starts later in the time period and contains more jobs with a higher share of women because of its sample skew toward the public sector.
15 The coefficient drops by the same margin to 0.044 when using fixed effects for three-digit codes (113 titles) and by about 50% to 0.096 when using occupation codes at the two-digit level (27 job titles).
16 The median couple takes 322 days of paid leave (women’s median number is 286 and men’s is 24). The median gender division is that the woman takes 92% of the couple’s total paid days of leave. This calculation is based on leave taken in the child’s first two years of life and counts “net day,” that is, summarizes any days of part-time parental leave to full days.
17 In Online Figure W6, we replicate the results in Figure 4 using a definition of hierarchical levels based on terciles of the workplace size distribution and terciles of the number of subordinates.
18 The online appendix contains an extended analysis of the relationship between gender, position, and meaning by comparing how wage levels and opportunities for career advancement affect our analysis. Using the annual administrative data for the whole work force (2001–2019), we calculate the average (real) log wage for each four-digit occupation code in each year and take the average of these averages for each occupation across the entire period. To capture advancement opportunities, we first take people who belong to each four-digit occupation code in each year and calculate their average log wage three years later. We then take the difference between that future wage and the current and calculate the average change within each occupation (in log points). We standardize both variables and show that their averages increase at higher hierarchical positions (see Online Table W8). We also show that they are positively correlated with self-reported meaningfulness (Online Figure W7). Including them in a regression of meaning on the female dummy and dummies for hierarchical position increases the gender gap slightly (from 0.19 to 0.20; see Online Table W9). This means that our dummy variables for hierarchical positions within workplace-size categories in the main analysis largely capture the variation in factors that influence meaningfulness and differ across positions. It also indicates that, within position, there is no sizeable gender gap in these factors that might result in erroneous interpretations of our main results.
19 In Online Table W10, we run a similar test of regressing meaningful work in standard deviations on the share of women in the occupation and adding the pathway variables. In this analysis, the bivariate correlation between the share of women and meaningful work shows that a 10-percentage-point increase in women in an occupation is associated with a 0.04-standard-deviation increase in meaningful work. Adding each of the job traits separately in columns (2)–(5) shows that only beneficence can account for this correlation. When including beneficence, the correlation drops close to zero and loses statistical significance at the 10% level.
20 Other relevant research shows that organizations’ prosocial characteristics, such as commitments to community and environmental issues, are considered female-typed (Lee and Huang 2018, Shea and Hawn 2019) and that congruence between gender stereotypes and prosocial characteristics of organizations affects job-seeker interest (Abraham and Burbano 2021).
21 The analysis of flexible work times shows a much larger compensating differential for men than for women. We show in an extended analysis how this is a result of the distribution of women and men across occupations and workplaces. Men may work in jobs for which flexibility is more costly for the employer as theorized by Goldin (2014). If this is the case, the wage cut for a flexible schedule would be larger in occupations or workplaces with more men. When we weight the analysis of compensating differentials for schedule flexibility to make the distribution of (1) occupations or (2) workplaces for one gender the same as the distribution for the other, the gender gap in compensating pay for flexibility disappears (upper panel of Online Table W14). Notably, reweighting in this way does not change the estimates for meaningful work (results in the lower panel of Online Table W14).
22 In Online Figure W11, we repeat this exercise but instead use the values for the compensating differentials from the low and high wage subsamples shown in Online Table W15. Using these values, the gender difference in meaning compensates for slightly more of the gender wage gap (1.6 instead of 1.2 log points), but the overall patterns look the same as in Figure 7.
References
- (2003) The dynamics of masculine-agentic and feminine-communal traits: Findings from a prospective study. J. Personality Soc. Psych. 85(4):768–776.Crossref, Google Scholar
- (2021) Congruence between leadership gender and organizational claims affects the gender composition of the application pool: Field experimental evidence. Organ. Sci. 33(1):393–413.Link, Google Scholar
- Adams-Prassl A, Hara K, Milland K, Callison-Burch C (2023) The gender wage gap in an online labour market: The cost of interruptions. Rev. Econom. Statist. Forthcoming.Google Scholar
- (2000) Economics and identity. Quart. J. Econom. 115(3):715–753.Crossref, Google Scholar
- (2013) Making a difference matters: Impact unlocks the emotional benefits of prosocial spending. J. Econom. Behav. Organ. 88:90–95.Crossref, Google Scholar
- (2016) Parenthood and the gender gap in pay. J. Labor Econom. 34(3):545–579.Crossref, Google Scholar
- (2008) Man’s search for meaning: The case of Legos. J. Econom. Behav. 67(3–4):671–677.Crossref, Google Scholar
- (2007) Transformational leadership and psychological well-being: The mediating role of meaningful work. J. Occupational Health Psych. 12(3):193–203.Crossref, Google Scholar
- (2016) Perceived work conditions and turnover intentions: The mediating role of meaning of work. Frontiers Psych. 12(7):704.Google Scholar
- (1993) Understanding retirement from sports—Therapeutic ideas for helping athletes in transition. Counseling Psych. 21(3):399–410.Crossref, Google Scholar
- (2013) Do women choose different jobs from men? Mechanisms of application segregation in the market for managerial workers. Organ. Sci. 24(3):737–756.Link, Google Scholar
- (1991) Work, Work, Work Work: Meanings of Life (The Guilford Press, New York).Google Scholar
- (2020) Job amenities & earnings inequality. Job market paper, Harvard University, Cambridge, MA.Google Scholar
- (2010) Dynamics of the gender gap for young professionals in the financial and corporate sectors. Amer. Econom. J. Appl. Econom. 2(3):228–255.Crossref, Google Scholar
- (2005) Competition and incentives with motivated agents. Amer. Econom. Rev. 95(3):616–636.Crossref, Google Scholar
- (2017) The gender wage gap: Extent, trends, and explanations. J. Econom. Literature 55(3):789–865.Crossref, Google Scholar
- (2018) Worth less? Why men (and women) devalue care-oriented careers. Frontiers Psych. 9:1353.Crossref, Google Scholar
- (2014) People, skills, and the labor-market outcomes of underrepresented groups. Indust. Labor Relations Rev. 67(2):287–334.Crossref, Google Scholar
- (1998) A Kantian theory of meaningful work. J. Bus. Ethics 17(9/10):1083–1092.Crossref, Google Scholar
- (1990) Meanings of Occupational Work: A Collection of Essays (Lexington Books, Lexington, MA).Google Scholar
- (2001) The wage penalty for motherhood. Amer. Sociol. Rev. 66(2):204–225.Crossref, Google Scholar
- (2016) Social responsibility messages and worker wage requirements: Field experimental evidence from online labor marketplaces. Organ. Sci. 27(4):1010–1028.Link, Google Scholar
- (2023) Gender differences in preferences for meaning at work. Amer. Econom. J. Econom. Policy Forthcoming.Google Scholar
- (2014) Gender, competitiveness, and career choices. Quart. J. Econom. 129(3):1409–1447.Crossref, Google Scholar
- (2017) Mortality and morbidity in the 21st century. Brookings Papers Econom. Activity 2017(1):397–476.Crossref, Google Scholar
- (2016) Competing for the benefit of offspring eliminates the gender gap in competitiveness. Proc. Natl. Acad. Sci. USA 113(19):5201–5205.Crossref, Google Scholar
- (2018) Nonmonetary incentives and the implications of work as a source of meaning. J. Econom. Perspect. 32(3):215–238.Crossref, Google Scholar
- (2013) How work shapes well-being. David S, Boniwell I, Ayers AC, eds. The Oxford Handbook of Happiness (Oxford University Press, Oxford, UK), 693–710.Google Scholar
- (2011) Professional role confidence and gendered persistence in engineering. Amer. Sociol. Rev. 76(5):641–666.Crossref, Google Scholar
- (1997) Job satisfaction and gender: Why are women so happy at work? Labour Econom. 4(4):341–372.Crossref, Google Scholar
- (2001) Gender and the career choice process: The role of biased self-assessments. Amer. J. Sociol. 106(6):1691–1730.Crossref, Google Scholar
- (2006)
Biased estimators? Comparing status and statistical theories of discrimination . Thye SR, Lawler EJ, eds. Advances in Group Processes, Vol. 23 (Emerald Group Publishing Limited, Bingley, UK), 89–116.Crossref, Google Scholar - (2023) Macroeconomic conditions when young shape job preferences for life. Rev. Econom. Statist. 105(2):467–473.Crossref, Google Scholar
- (2018)
Occupation and gender . Averett S, Argys L, Hoffman S, eds. The Oxford Handbook of Women and the Economy (Oxford University Press, Oxford, UK), 425–452.Google Scholar - (2015) An underexamined inequality: Cultural and psychological barriers to men’s engagement with communal roles. Personality Soc. Psych. Rev. 19(4):343–370.Google Scholar
- (1985) The general causality orientations scale: Self-determination in personality. J. Res. Personality 19(2):109–134.Crossref, Google Scholar
- (2000) The “what” and “why” of goal pursuits: Human needs and the self-determination of behavior. Psych. Inquiry 11(4):227–268.Crossref, Google Scholar
- (2021) Breaking gender barriers: Experimental evidence on men in pink-collar jobs. IZA Discussion Paper 14083, Institute of Labor Economics, Bonn, Germany.Google Scholar
- (2013) Calling and life satisfaction: It’s not about having it, it’s about living it. J. Counseling Psych. 60(1):42–52.Crossref, Google Scholar
- (2019) Socially useless jobs. Indust. Relations 58(1):3–16.Crossref, Google Scholar
- (2014) Working for a good cause. Public Admin. Rev. 74(2):144–155.Crossref, Google Scholar
- (2014) Wages or fringes? Some evidence on trade-offs and sorting. J. Labor Econom. 32(4):899–928.Crossref, Google Scholar
- (2012) The motherhood wage gap: What about job amenities? Labour Econom. 19(1):59–67.Crossref, Google Scholar
- (2011) Gender sorting and application interface. Indust. Relations 50(4):591–609.Crossref, Google Scholar
- (2005) Competing for jobs: Labor queues and gender sorting in the hiring process. Soc. Sci. Res. 37(4):1061–1080.Crossref, Google Scholar
- (1993) What’s so special about sex? Gender stereotyping and discrimination. Oskamp S, Costanzo M, eds. Gender Issues Contemporary Soc. (Sage Publications, Thousand Oaks, CA), 173–196.Google Scholar
- (2015) Do competitive workplaces deter female workers? A large-scale natural field experiment on job entry decisions. Rev. Econom. Stud. 82(1):122–155.Crossref, Google Scholar
- (2008) The gender wage gap among young adults in the United States: The importance of money vs. people. J. Human Resources 43(4):884–918.Google Scholar
- (2022) Sexual harassment and gender inequality in the labor market. Quart. J. Econom. 137(4):2163–2212.Crossref, Google Scholar
- (1962) Man’s Search for Meaning: An Introduction to Logotherapy (Beacon Press, Boston, MA).Google Scholar
- (2019) Corporate purpose and financial performance. Organ. Sci. 30(1):1–18.Link, Google Scholar
- (2014) A grand gender convergence: Its last chapter. Amer. Econom. Rev. 104(4):1091–1119.Crossref, Google Scholar
- (2007) Relational job design and the motivation to make a prosocial difference. Acad. Management Rev. 32(2):393–417.Crossref, Google Scholar
- (2008a) Employees without a case: The motivational effects of prosocial impact in public service. Internat. Public Management J. 11(1):48–66.Crossref, Google Scholar
- (2008b) The significance of task significance: Job performance effects, relational mechanisms, and boundary conditions. J. Appl. Psych. 93(1):108–124.Crossref, Google Scholar
- (2019) Toward an understanding of corporate social responsibility: Theory and field experimental evidence. NBER Working Paper No. 26222, National Bureau of Economic Research, Cambridge, MA.Google Scholar
- (1989) The Second Shift: Working Parents and the Revolution at Home (Penguin, New York).Google Scholar
- (2018) Parenthood, family friendly workplaces, and the gender gaps in early work careers. NBER Working Paper No. 24173, National Bureau of Economic Research, Cambridge, MA.Google Scholar
- (2017) Accepting lower salaries for meaningful work. Frontiers Psych. 8:1649.Crossref, Google Scholar
International Social Survey Programme (2017) Work orientations module. https://www.gesis.org/issp/modules/issp-modules-by-topic/workorientations/.Google Scholar- (2018) The changing (dis-) utility of work. J. Econom. Perspect. 32(3):239–258.Crossref, Google Scholar
- (2004) The economics of meaning. Nordic J. Political Econom. 30:61–75.Google Scholar
- (2015) Unequal representation and gender stereotypes in image search results for occupations. Inkpen K, Woo W, eds. Proc. 33rd Annual ACM Conf. Human Factors Comput. Systems (Association for Computing Machinery, New York), 3819–3828.Google Scholar
- (2021) Gender differences in sorting on wages and risk. Working paper, Ohio State University, Columbus, OH.Google Scholar
- (2021) Gender differences in job search: Trading off commute against wage. Quart. J. Econom. 136(1):381–426.Crossref, Google Scholar
- (2018) Gender bias, social impact framing, and evaluation of entrepreneurial ventures. Organ. Sci. 29(1):1–16.Link, Google Scholar
- (2016) The persistence of extreme gender segregation in the twenty-first century. Amer. J. Sociol. 122(2):573–619.Crossref, Google Scholar
- (2002) The developmental course of gender differentiation: Conceptualizing, measuring, and evaluating constructs and pathways. Monographs Soc. Res. Child Development 67(2):vi–147.Google Scholar
- (2022) Does Rosie like riveting? Male and female occupational choices. Economica 89(353):110–130.Crossref, Google Scholar
- (2023) The value of working conditions in the United States and implications for the structure of wages. Amer. Econom. Rev. 113(7):2007–2047.Crossref, Google Scholar
- (2018) Autonomy, competence, relatedness, and beneficence: A multicultural comparison of the four pathways to meaningful work. Frontiers Psych. 9:1–14.Google Scholar
- (2017) Valuing alternative work arrangements. Amer. Econom. Rev. 107(12):3722–3759.Crossref, Google Scholar
- (2008) Is volunteering rewarding in itself? Economica 75(297):39–59.Crossref, Google Scholar
- (2021) The gender pay gap: Micro sources and macro consequences. CEPR Discussion Paper 16383, CEPR Press, Paris and London.Google Scholar
- (2007) Do women shy away from competition? Do men compete too much? Quart. J. Econom. 122(3):1067–1101.Crossref, Google Scholar
- (2020) What makes work meaningful and why economists should care about it. Labour Econom. 65:101847.Crossref, Google Scholar
- (2022) Mission of the company, prosocial attitudes and job preferences: A discrete choice experiment. Labour Econom. 74:102087.Crossref, Google Scholar
- (2016) Employment adjustments around childbirth. IZA Discussion Paper 9685, Institute of Labor Economics, Bonn, Germany.Google Scholar
- (2020) Gender gaps and the structure of local labor markets. Labour Econom. 64:101819.Google Scholar
- (2019) Taste for competition and the gender gap among young business professionals. NYU Abu-Dhabi Working Paper #0031, New York University, Abu Dhabi, UAE.Google Scholar
- (2010) On the meaning of work: A theoretical integration and review. Res. Organ. Behav. 30:91–127.Crossref, Google Scholar
- (2000) Self-determination theory and the facilitation of intrinsic motivation, social development, and well-being. Amer. Psych. 55(1):68–78.Crossref, Google Scholar
- (2019) Gender differences in job entry decisions: A university-wide field experiment. Management Sci. 65(7):3272–3281.Link, Google Scholar
- (2008) Antecedents and outcomes of experienced meaningful work: A person-job fit perspective. J. Bus. Inquiry 7(1):68–78.Google Scholar
- (2019) The (not so) changing man: Dynamic gender stereotypes in Sweden. Frontiers Psych. 10(37):1–17.Google Scholar
- (2019) Microfoundations of corporate social responsibility and irresponsibility. Acad. Management J. 62(5):1609–1642.Crossref, Google Scholar
- (1975) Sexual stereotypes of occupations. J. Vocational Behav. 7(1):99–111.Crossref, Google Scholar
- (2009) If one is looking for meaning in life, does it help to find meaning in work? Appl. Psych. Health Well-Being 1(3):303–320.Crossref, Google Scholar
- (2012) Measuring meaningful work: The work and meaning inventory (WAMI). J. Career Assessment 20(3):322–337.Crossref, Google Scholar
- (1976)
The value of saving a life: Evidence from the labor market . Terleckyj N, ed. Household Production and Consumption (NBER, Cambridge, MA), 265–302.Google Scholar - (1997) The effect of children on women’s wages. Amer. Sociol. Rev. 62(2):209–217.Crossref, Google Scholar
- (2017) Preference for the workplace, investment in human capital, and gender. Quart. J. Econom. 133(1):457–507.Crossref, Google Scholar
- (2012)
Motivation, meaning, and wellness: A self-determination perspective on the creation and internalization of personal meanings and life goals . Wong PTP, ed. The Human Quest for Meaning: Theories, Research, and Applications, 2nd ed. (Routledge, New York), 81–106.Google Scholar - (2003)
Finding positive meaning in work . Dutton JE, ed. Positive Organizational Scholarship: Foundations of a New Discipline (Berrett-Koehler, San Francisco, CA), 296–308.Google Scholar - (2001) Crafting a job: Revisioning employees as active crafters of their work. Acad. Management Rev. 26(2):179–201.Crossref, Google Scholar
- Wrzesniewski A, McCauley C, Rozin P, Schwartz B (1997) Jobs, careers, and callings: People’s relations to their work. J. Res. Personality 31(1):21–33.Google Scholar