


Communicating Corporate Culture in Labor Markets: Evidence from Job Postings
Abstract
We examine how culture information in job postings influences firms’ hiring outcomes. We utilize machine learning methods to measure five core values present in job postings and demonstrate that culture information helps attract job seekers, as it is associated with higher worker inflows. The effect strengthens when job seekers value culture in their job searches and face frictions in learning about culture from other sources. Additional analyses indicate that individual cultural dimensions in job postings are more salient to job seekers when they have heightened preferences for that particular value. Finally, culture information is associated with a higher likelihood that interviews result in offers, and greater acceptance of those offers. Overall, our results suggest that culture information in job postings helps job seekers sort into culturally aligned firms.
This paper was accepted by Ranjani Krishnan, accounting.
Conflict of Interest Statement: The authors declare that they have no relevant or material financial interests that relate to the research described in this paper.
Funding: A. H. Huang acknowledges financial support from the National Natural Science Foundation of China [Grant 72172079].
Supplemental Material: The data files are available at https://doi.org/10.1287/mnsc.2024.07272.
1. Introduction
Corporate culture is a critical attribute when choosing a job.1 A longstanding literature in economics suggests that nonwage attributes, such as culture, can influence job searches (e.g., Mas and Pallais 2017, Maestas et al. 2023). Job seekers have increasingly emphasized culture in recent years, with some evidence suggesting that they now consider culture to be as important as salary when evaluating job prospects (Estrada 2020). Despite its importance, culture remains difficult to observe, resulting in significant information frictions and search costs for job seekers (Guiso et al. 2008, 2015b; Grennan 2019; Graham et al. 2022). We examine whether corporate job vacancy postings emphasizing information about core cultural values alleviate such frictions and improve hiring outcomes.
We argue that job postings with culture information help companies better identify and attract job seekers with similar cultural preferences. This prediction builds on two assumptions. First, based on prior research, we assume that employees value culture (Sheridan 1992, Glassdoor 2018). Second, job postings can provide job seekers with information that is more relevant, accessible, and salient than information provided elsewhere, such as corporate websites and job review sites.2 Culture information from these sources may be too general and may not apply to the position of interest, which resides within a business unit or location with its own subculture.3 In contrast, job postings contain relevant culture information for specific positions. Moreover, job seekers relying on external information sources bear additional search costs, as they need to collect and assimilate information from multiple sources while evaluating different job prospects.4
Our prediction is not without tension. For instance, job seekers may instead focus primarily on advancement opportunities, specific job requirements (e.g., skillsets), or salary, which firms have been under increasing regulatory scrutiny to disclose (Liu 2022). This focus can render culture information less important in the job search (deHaan et al. 2023). In addition, job seekers may view noncompany sources, such as Glassdoor or informal networks, as more informative, reducing the role of job postings as a primary source. Ultimately, the extent to which the level of culture information in job postings is associated with hiring outcomes warrants an empirical investigation.
We focus on five cultural values that are most frequently present in corporate websites and official value statements (Guiso et al. 2015b, Sull et al. 2020): integrity, teamwork, innovation, respect, and quality. We adopt a semisupervised machine learning approach from Li et al. (2021) to measure the extent to which job postings discuss these values. Specifically, we train a neural network model using approximately 12 million job postings from 2010–2020 to learn the meanings of words and phrases in the context of job postings and use the model’s output to construct a dictionary containing the words most relevant to each cultural value. We then follow prior studies (e.g., Li et al. 2021, Graham et al. 2022) and calculate a composite score (disclosed culture) that measures the degree to which job postings broadly emphasize culture (across multiple dimensions), or the salience and intensity of culture language in the job posting.
In practice, culture varies within a company and across teams, and hiring managers write job postings to reflect the needs and cultural fit for their teams (Castilla and Rho 2023). To provide context on this, we begin by analyzing sources of variation in disclosed culture. We find that, although firm fixed effects explain a sizeable portion of the variation in our culture measure (31.7%), the majority remains unaccounted for. These statistics support evidence from practice regarding job postings varying within firms. When including firm and job characteristics as determinants, we find that culture is more likely to be emphasized in roles requiring greater experience or managerial or interpersonal skills, and in periods of high job demand. By contrast, culture information is less prevalent in technical roles, those for which employers prioritize skills, and when firms rely more on compensation as a recruitment tool. Our subsequent analyses control for these characteristics and include a comprehensive set of fixed effects to help isolate the effects of culture information.
Our main analyses examine the relation between disclosed culture and employee inflows. We obtain detailed data on worker inflows from Revelio Labs. Our baseline results show a strong positive relation between disclosed culture and subsequent worker inflows at the firm-Metropolitan Statistical Area (MSA)-quarter level. The results are economically meaningful: a one within-fixed-effect standard deviation increase in disclosed culture is associated with a 9.7% increase in employee inflow, relative to the sample median. In additional analyses, we corroborate our main findings via two alternative hiring outcome measures. We show that disclosed culture shortens vacancy durations, suggesting quicker identification of suitable candidates. At the same time, more salient culture disclosures are associated with lower subsequent outflows, consistent with new hires having better cultural alignment with the company.
Next, we explore the mechanisms underlying this effect. We begin by conducting two cross-sectional analyses to examine predictable variation in the effect of disclosed culture on inflows. The first set of analyses examines how much job seekers value culture as reflected in job features and labor market conditions. We find that disclosed culture is more strongly associated with employee inflows in creative roles but that its effect weakens for entry-level positions. These results suggest that culture information is more effective when job seekers place greater emphasis on cultural fit but plays a limited role when they focus primarily on career opportunities. In addition, we find the effect of culture information weakens when the unemployment rate is high and when firms have fewer openings, consistent with culture being particularly valuable when job seekers face less competition in the labor market.
Our second set of analyses examines the role of information asymmetry, as our predictions assume that job seekers have limited information about culture. We thus expect the effect of disclosed culture to weaken when job seekers have access to more and better alternative sources of information about culture. Consistent with this argument, we find that our results are less pronounced among larger facilities (with presumably better information environments) and for firms with more high-quality reviews available on job review sites. Overall, our cross-sectional results suggest that disclosed culture matters more when job seekers value cultural fit and less when they have access to alternative sources of culture information.
Next, we assess the cultural fit channel, which suggests that culture information helps job seekers sort into jobs that better fit their preferences. Assessing cultural fit poses an empirical challenge as we cannot observe job seekers’ preferences. To circumvent this challenge, we perform two sets of analyses. First, we examine scenarios that may heighten job seekers’ preferences for certain cultural values. The first test uses the Black Lives Matter (BLM) movement as a shock that increases the weight that job seekers place on the respect dimension of culture (Li et al. 2021). The second test exploits time-varying patterns of corporate misconduct in the industry as settings in which job seekers will emphasize the integrity dimension of culture. Consistent with expectations, we find that job postings containing respect-related information have a stronger effect on worker inflows following BLM and those containing integrity-related information have a similar effect when industries have experienced more significant violations in recent periods.
Second, we further assess the cultural fit channel by examining job candidates’ reviews of the interview process on Glassdoor. If culture information facilitates cultural fit, we expect firms providing this information to have higher offer rates to candidates and candidates to have higher acceptance rates, as job seekers apply to better-fitting positions. We find results consistent with these predictions, indicating that culture information fosters cultural fit and, consequently, better matches between firms and job seekers.
Finally, we conduct a battery of robustness tests that help strengthen our claim that culture information influences worker inflows. For example, we include additional controls such as a firm-level culture measure based on earnings calls (Li et al. 2021) and the education and experience of incoming workers, use alternative scalers, and ascertain the robustness of our findings across different subsamples. Our results persist across all settings.
Our study contributes to the literature across several dimensions. First, we extend the academic literature on corporate culture (e.g., Guiso et al. 2015a, b; Grennan 2019; Pacelli 2019; Dikolli et al. 2020; Li et al. 2021, 2025; Graham et al. 2022) by providing large-scale evidence on culture information in job postings. We show that, unlike culture information in conference calls, corporate websites, or regulatory violations, culture information in job postings varies within firms, likely reflecting the subcultures of business units. Our finding that this information influences hiring outcomes extends recent research on job postings as informative disclosures with labor and capital market implications (Sran 2025). As such, we also contribute to the nascent literature on labor and accounting (Barrios 2022, Choi et al. 2023, Hann et al. 2024, Ham et al. 2025) and complement the longstanding literature on the role of nonwage attributes in labor market sorting (e.g., Sullivan and To 2014, Mas and Pallais 2017, Hall and Mueller 2018, Maestas et al. 2023). Relatedly, our finding that job seekers’ cultural preferences shape their responses to job postings also contributes to the behavioral economics of accounting (Hanlon et al. 2022), reinforcing the growing evidence that individual preferences and work environment characteristics are important determinants of economic outcomes.
Second, we extend studies examining the value of information that results from job searches (e.g., Hales et al. 2018, Huang et al. 2020, Dube and Zhu 2021, Campbell and Shang 2022). These studies primarily focus on information from employee review platforms such as Glassdoor and Indeed, and how that information affects firm behavior and relates to capital market outcomes. We extend this literature by examining how job postings alleviate information frictions related to job searches. In doing so, we also build on the nascent line of accounting research examining employee job search costs (Choi et al. 2023, deHaan et al. 2023). Our results are consistent with culture information in job postings reducing information asymmetry regarding firm core values and job search costs for employees.
More broadly, our focus on culture disclosures is relevant in light of recent Securities and Exchange Commission (SEC) initiatives requiring firms to provide more detailed descriptions of their human capital. Early evidence from the human capital disclosure mandate suggests that firms recognize the importance of corporate culture, as nearly 20% of them discuss this issue (e.g., Batish et al. 2021). Our paper complements recent studies on human capital disclosure (e.g., Bourveau et al. 2022, Demers et al. 2022, Mayew and Zhang 2022) by exploring the disclosure of human capital factors in unconventional disclosure platforms such as job postings.
2. Prior Literature and Hypothesis Development
2.1. Prior Literature
Our objective is to show how culture information in job postings influences firms’ hiring outcomes. Broadly speaking, prior studies define corporate culture as an intangible asset that represents the shared assumptions, values, and beliefs that inform employee behavior (Kreps 1990, Schein 1990, O’Reilly and Chatman 1996). Corporate culture is difficult to measure or describe, particularly for firm outsiders.
Prior studies have established a variety of frameworks and methodologies for examining and measuring culture. One line of research infers corporate culture based on the behavior or attributes of executives or key individuals in the firm (e.g., Biggerstaff et al. 2015, Davidson et al. 2015, Liu 2016, Pan et al. 2017, Merkley et al. 2020). Other studies attempt to infer a firm’s culture based on associations or patterns that cannot otherwise be explained by common observables (e.g., Cartwright and Cooper 1993, Cronqvist et al. 2009, Fahlenbrach et al. 2012, Pacelli 2019). Recent work has further attempted to measure specific dimensions of corporate culture, going beyond a firm-level composite measure (e.g., Guiso et al. 2015b, Li et al. 2021). Our study builds on this literature and adopts a multidimensional view of corporate culture, following Guiso et al. (2015b) and Li et al. (2021).
Research supports the notion that corporate culture matters for both firms and job seekers in the context of job searches. From the firm’s perspective, extensive research emphasizes the benefits of aligning employee values with organizational values. Akerlof and Kranton (2000, 2005) argue that when employees’ identities align with the organization, they are more likely to act in line with organizational objectives. Van den Steen (2005) shows that the alignment of beliefs improves coordination in organizations. Ghoshsamaddar et al. (2021) use a regulatory shock that affects employee mobility to show that a strong culture helps companies retain employees. Jeffers and Lee (2019) develop a measure of corporate culture using coworker connectivity on LinkedIn and show that firms with stronger cultures depend less on explicit contracts to retain human capital. Recent studies show that employee selection can help achieve value alignment (Chatman 1991, Kristof 1996, Campbell 2012, Abernethy et al. 2015, Swaney 2017, Liu et al. 2019, Deller and Sandino 2020). Cai (2023) provides further evidence that formal culture-fit systems during employee selection can ease the challenge of embedding values and improve the diffusion of culture within organizations. Consistent with these insights, practitioner evidence indicates recruiting benefits for companies that promote culture in job postings (Johnson 2020).
From the job seeker’s perspective, culture matters in job choice. Prior research examines how individuals sort into jobs based on their preferences and skills (e.g., Roy 1951). A growing literature shows how nonwage attributes can influence job searches, suggesting an important role for culture (Akerlof and Kranton 2005, Bénabou and Tirole 2011, Sullivan and To 2014, Mas and Pallais 2017, Hedblom et al. 2019, Ashraf et al. 2020, Choi et al. 2023, Maestas et al. 2023). Experiments further show that applicants often choose organizations with more supportive cultures, even at lower pay levels (Catanzaro et al. 2010). Relatedly, symbolic attributes such as values and image strongly affect employer attractiveness (Lievens and Highhouse 2003). Gadgil and Sockin (2020) use a sample of corporate scandals and show that negative reputation shocks decrease worker sentiment, largely because of diminished perceptions of management and culture. To our knowledge, limited research examines how job seekers respond to firms’ direct communication of culture.5 Instead, prior studies focus almost exclusively on the usefulness of alternative sources of information about culture. In particular, the focus has largely been on job review sites, such as Glassdoor and Indeed, where employees rate employers. In general, these studies suggest that job review sites provide useful information to employees and market participants (Hales et al. 2018, Chemmanur et al. 2019, Green et al. 2019, Huang et al. 2020, Dube and Zhu 2021, Campbell and Shang 2022).
Yet, growing evidence suggests there are limitations to the information provided by job review sites, given that they rely on voluntary data from employees (Karabarbounis and Pinto 2018, Gadgil and Sockin 2020, Marinescu et al. 2021) and are often too general to capture variation within firms. In contrast, job postings offer more precise information because they are written for specific roles and locations. This perspective suggests the presence of subcultures within organizations and is consistent with prior research in economics and organizational behavior that highlights variation in values across business units, functional roles, and geographic locations (e.g., Sackmann 1992, Hofstede 1998, Boisnier and Chatman 2003).
2.2. Hypothesis Development
Jobs bundle pecuniary and nonpecuniary attributes. The literature suggests that nonwage attributes can influence job searches and labor market sorting (e.g., Sullivan and To 2014, Mas and Pallais 2017, Hall and Mueller 2018, Maestas et al. 2023). In parallel, theories of person-organization fit argue that individuals self-select into firms whose values they share (e.g., Chatman 1991, Kristof 1996). Research on employer branding similarly shows that firms’ communicated identities meaningfully influence applicant quality and decisions (Cable and Turban 2001, Collins and Han 2004). In recent years, job seekers have increasingly emphasized culture (Estrada 2020). Yet, despite its importance, culture remains difficult to observe, thus generating information frictions for job seekers (Guiso et al. 2008, 2015b; Grennan 2019; Graham et al. 2022).
The information economics literature suggests that credible, informative disclosure can reduce mismatch risk and improve match efficiency (e.g., Stigler 1961). Job postings are a natural vehicle for such disclosure because they occur early in job searches and are less costly for applicants to process than other sources such as corporate websites and job review sites. A job posting provides hiring managers with an opportunity to communicate the benefits and requirements associated with a position, which is particularly valuable, given job seekers’ limited time and attention. Estimates suggest that the typical job seeker applies to 21 to 80 positions and spends only a few minutes reviewing each posting (Morgan 2020, Kolmar 2023).
In addition, external sources have at least two limitations. First, job review sites often require job seekers to input a review before they can observe reviews through a “give-to-get” model (e.g., Dube and Zhu 2021), which increases information acquisition costs. Second, external sources may contain information that is less relevant for a given position. For example, job review sites may contain descriptions of jobs at different locations or roles within a firm. Corporate websites are also “too vague” or contain information that is more relevant for other stakeholders, such as customers or investors (e.g., Boulland et al. 2026). These information sources may not be able to communicate distinct subcultures within a firm (e.g., Jones 1983, Sackmann 1992, Hofstede 1998). Therefore, job postings can help reduce the information frictions for job seekers to learn the culture associated with a position.
We expect that companies providing culture information can better attract workers and fill positions more efficiently. As noted by Wickman (2012), a company’s ability to hire strong employees is in part determined by how well it incorporates its core values into hiring. Culture information allows job seekers to sort into companies and positions that are a better cultural fit. Such sorting can be useful as the average corporate job opening receives 250 applications (Kolmar 2023). Culture information can help limit the pool of candidates to only those who believe they are a good fit for the position and lead to a higher acceptance rate, resulting in better hiring outcomes.
We note that our prediction is not without tension and draws on prior work in accounting and labor that examines how job seekers respond to firm disclosures (e.g., Choi et al. 2023, deHaan et al. 2023). These studies show that workers respond to disclosures when they value the underlying attribute and when they believe that the disclosure is credible and informative. A competing view is that job seekers may place little value on culture, with salary dominating their decisions. Indeed, a recent study suggests that 67% of job seekers cite salary as a top factor (Glassdoor 2018). Moreover, job seekers may learn about culture from alternative sources, reducing the incremental value of job postings. It is thus not clear whether and to what extent culture information will impact hiring outcomes.
3. Data, Variable Measurement, and Univariate Statistics
3.1. Measuring Culture Information in Job Postings
We adopt a semisupervised machine learning approach from Li et al. (2021) to measure the extent to which firms describe their core values in job postings. We focus on the five most common core values that firms highlight on their corporate websites (Guiso et al. 2015b). These values are integrity, teamwork, innovation, respect, and quality.
We obtain job posting data from Lightcast (formerly known as Burning Glass Technologies) for the period January 1, 2010, to December 31, 2020. Lightcast sources job postings from more than 65,000 websites, including company career sites, national and local job boards, and job posting aggregators.6 We retain job postings with more than 100 words, yielding an initial sample of about 25 million job postings from 4,911 firms.
The key challenge in measuring corporate culture is that firms discuss their values in different ways and that their language evolves. To overcome this challenge, we identify seed words that reliably define each cultural value and use a machine learning approach (word embedding) to expand these seed words to high-quality dictionaries that are specifically applicable to job postings (Mikolov et al. 2013, Li et al. 2021).7
Specifically, we use the culture seed words from Li et al. (2021) as a starting point and add “ethically,” “fair,” “commitment,” “diverse,” and “inclusive,” and remove “create” and “pride” based on how culture is described in the job posting context. (A full list of our seed words is provided in Table A.1, panel A, in Appendix A.) We train the Word2Vec word embedding model based on parsed job posting text to represent each word as a 300-dimensional vector that captures its semantics.8 To construct the expanded dictionaries, we first take the average of the vectors of seed words under the same culture category (Integrity, Teamwork, Innovation, Respect, and Quality) to represent that cultural value. For each cultural value, we then use the 500 words (phrases) with the closest association with that value, that is, the highest cosine similarity in vectors. Finally, we remove duplicate words and words that do not fit from the dictionaries. Table A.1, panel B, lists the most representative words in our expanded dictionary for each cultural attribute.9
After obtaining the expanded dictionaries, we measure each cultural value in a job posting by the weighted count of the number of words associated with that value divided by the total number of words in the posting. We calculate the weight using the term frequency-inverse document frequency (tf-idf) to account for the importance and prevalence of a word both within the posting and across the corpus. Table B.1 in Appendix B provides two examples of job postings from the same firm (Amazon) during the same period (2019 Q3) for different positions and locations, which exhibit different levels of disclosed culture. In the empirical analyses, we aggregate the culture variables to the unit of observation by taking the average of the values for all job postings in that unit. Most analyses are at the firm-MSA-quarter level, which proxy for a firm’s local hiring unit (such as a facility or office), to align with the notion of subculture. Empirically, this allows us to explore within-firm variation in disclosed culture and hiring outcomes across geographic locations and organizational functions.
We construct a composite score that covers all five cultural dimensions, Job Culture, following Li et al. (2021) and Graham et al. (2022). Defined as the sum of the five cultural dimensions, the score captures the salience and intensity with which firms describe their core values in job postings. To ease interpretation, we standardize it to have a mean of zero and a standard deviation of one. Details on the procedure of constructing the expanded dictionaries and measuring culture variables are in Appendix C.
3.2. Employee Inflow
In our analyses, we focus on employee inflows as our primary measure of successful hiring outcomes. Inflows provide a direct and observable indicator of whether culture information in job postings translates into successful hires. We obtain employee inflow data from Revelio Labs. The data provider estimates employee inflows and outflows from a variety of sources, including online professional profiles, resumes, and government data (Fadhel et al. 2022).10 The data cover more than 1.1 billion profiles, 4.5 million companies, and 5,200 cities and states. We define Inflow as the number of employees joining the firm-MSA in a quarter scaled by its beginning-of-quarter total number of employees.
3.3. Other Variables
Our analyses include a wide set of controls for job posting and firm characteristics. Job posting controls include the firm-MSA-quarter average of job posting features: requirements on education (Education) and experience (Experience), job complexity as reflected in the number of skill requirements (Skill Count), the number of words in the job posting (Length), recruitment demand measured with the number of job postings released (Hiring Intensity), job benefits including insurance (Insurance), other compensation (Other Comp), and work flexibility (Flexibility), and the percentage of job postings with nonmissing salary information (Salary Disclosed). We also conduct analyses that control for advertised mean salary information when available (Advertised Mean Salary) or expected salary based on similar job postings (Advertised Mean Salary (Expanded)). To mitigate the concern that both culture-related language in job postings and hiring outcomes are driven by jobs’ underlying tasks and responsibilities, we further control for the share of job postings across Standard Occupational Classification (SOC) categories. Nevertheless, fully separating culture disclosure from job content disclosure remains empirically challenging, and we acknowledge this as a caveat of our study.
In all analyses, we aggregate job posting controls to the unit of observation (e.g., firm-MSA-quarter) by taking the average of the values for all job postings in that unit. Firm controls include size (Size), profitability (return on assets (ROA)), leverage (Leverage), market-to-book ratio (MTB), and the percentage of intangible assets (IntanRatio). In subsequent analyses, we consider alternative outcome variables, such as hiring duration (Hiring Duration), employee outflows (Outflow), unscaled inflows and inflows scaled by postings, and Glassdoor measures related to the interview process, including the share of interview reviews mentioning culture (Interview Culture), the offer rate (Offer Rate), and the offer acceptance rate (Accept Rate). Variable definitions can be found in Table D.1 in Appendix D.
3.4. What Determines Disclosed Culture?
Figure 1 illustrates the time series trends in the five cultural dimensions (Integrity, Teamwork, Innovation, Respect, and Quality) in our sample period. Firms show a notable rise in the extent to which they highlight culture in job postings beginning around 2013–2014, with the trend continuing upward through the end of the sample period (2020). To assess sources of variation in disclosed culture, we employ variance decomposition and determinants analyses at the job posting level.
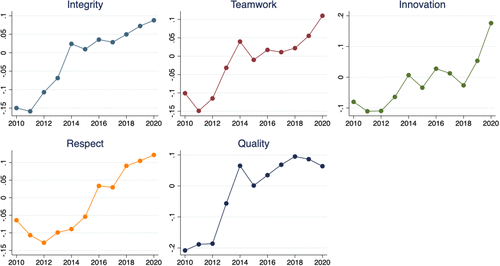
Notes. This figure displays time trends in culture scores for five specific dimensions (Integrity, Teamwork, Innovation, Respect, and Quality) over the period from 2010 to 2020. Each score is standardized to have a mean of zero and a standard deviation of one.
First, we estimate the following regressions to explore how much disclosed culture varies across firms, period, location, and occupation:
|

Table 1. Variance Decomposition
| Fixed effects | Adjusted R2 |
|---|---|
| (1) Firm | 31.71% |
| (2) Industry | 19.20% |
| (3) Month | 1.01% |
| (4) Occupation | 23.12% |
| (5) County | 7.32% |
| (6) Firm × Occupation | 53.07% |
| (7) Firm × County | 39.54% |
| (8) Firm × Month | 42.01% |
| (9) Occupation × County | 30.23% |
| (10) Occupation × Month | 28.10% |
| (11) County × Month | 9.81% |
Notes. This table examines sources of variation in job posting disclosed culture. Each row presents the adjusted R2 from a regression of Job Culture on the corresponding fixed effects. From rows (1) to (5), we include firm, industry (four-digit SIC), month, occupational category (Occupation), and county fixed effects, respectively. In rows (6) to (11), we consider the pairwise interactive fixed effect structures among firm, year-month, occupational category, and county. The unit of observation is at the job posting level. Variables are defined in Table D.1.
Next, we examine firm and job characteristics that can explain disclosed culture. Culture information may be more important for firms seeking to differentiate themselves or appeal to candidates for whom cultural fit matters more, for example, in roles with high interpersonal demands. Firms may also highlight culture information when they face pressure in attracting talent. On the other hand, firms may hesitate to emphasize culture in roles where technical skills matter more to avoid narrowing the candidate pool. We include these additional considerations in Equation (1) and estimate the following model:
Table 2 reports the regression results, with models progressively adding groups of variables or fixed effects. Column (1) includes firm-month and county-month fixed effects along with firm characteristics and job role indicators. The results highlight meaningful heterogeneity across roles: Managerial Roles, Creative Roles, and Sales Roles exhibit higher culture scores, whereas Blue-Collar Roles and Engineer Roles show lower scores. This pattern suggests that disclosed culture is more salient in people-facing or soft-skill-intensive roles. We also find a positive association between disclosed culture and Hiring Intensity, consistent with the notion that firms emphasize culture when recruiting pressure is high during growth phases.
|
Table 2. Determinants Analysis
| Dep. Var.: Job Culture | (1) | (2) | (3) | (4) |
|---|---|---|---|---|
| Size | 0.008 | 0.015* | 0.017** | 0.016** |
| (0.77) | (1.88) | (2.07) | (2.01) | |
| Leverage | 0.029 | −0.024 | −0.040 | −0.039 |
| (0.25) | (−0.18) | (−0.30) | (−0.29) | |
| MTB | 0.039 | 0.043 | 0.041 | 0.041 |
| (1.50) | (1.23) | (1.17) | (1.17) | |
| ROA | −0.095 | −0.948 | −1.158 | −1.114 |
| (−0.13) | (−1.30) | (−1.55) | (−1.45) | |
| IntanRatio | −0.105 | −0.104 | −0.107 | −0.104 |
| (−1.55) | (−1.12) | (−1.15) | (−1.13) | |
| Hiring Intensity | 0.032*** | 0.035*** | 0.034*** | 0.033*** |
| (6.32) | (12.12) | (11.97) | (12.04) | |
| Length | 0.456*** | 0.402*** | 0.393*** | 0.394*** |
| (30.30) | (26.12) | (23.17) | (23.14) | |
| Managerial Roles | 0.416*** | |||
| (20.91) | ||||
| Creative Roles | 0.101* | |||
| (1.70) | ||||
| Sales Roles | 0.088*** | |||
| (2.96) | ||||
| Blue-Collar Roles | −0.330*** | |||
| (−16.19) | ||||
| Engineer Roles | −0.044*** | |||
| (−3.14) | ||||
| Experience | 0.025*** | 0.025*** | ||
| (10.83) | (10.89) | |||
| Education | −0.001 | −0.001 | ||
| (−1.51) | (−1.53) | |||
| Skill Count | −0.002** | −0.002** | ||
| (−2.14) | (−2.24) | |||
| Salary Disclosed | −0.162*** | |||
| (−9.56) | ||||
| Insurance | −5.239 | |||
| (−1.12) | ||||
| Other Comp | 0.964 | |||
| (0.16) | ||||
| Flexibility | −2.198 | |||
| (−0.40) | ||||
| Unit of observation | Job Posting | |||
| Firm-month FE | Yes | Yes | Yes | Yes |
| County-month FE | Yes | Yes | Yes | Yes |
| Firm-occupation FE | No | Yes | Yes | Yes |
| Observations | 24,225,062 | 24,074,275 | 24,074,275 | 24,074,275 |
| Adjusted R2 | 0.5204 | 0.6442 | 0.6469 | 0.6480 |
Notes. This table reports results from regressions of Job Culture on various sets of determinants. Column (1) includes firm-month and county-month fixed effects. Columns (2)–(4) further add firm-occupation fixed effects. Standard errors are clustered at the firm, county, and month levels. All variables are winsorized at the top and bottom 1% of the cross-sectional distribution. The unit of observation is at the job posting level. Variables are defined in Table D.1. Dep. Var., dependent variable.
*, **, and ***, significant at 10%, 5%, and 1%, respectively.
In column (2), we add firm-occupation fixed effects to account for variation across positions, and in column (3), we include job requirements from postings: Experience, Education, and Skill Count. In column (4), we add job benefits, including Salary Disclosed, Insurance, Other Comp, and Flexibility.12 The model with all fixed effects, time-varying firm characteristics, and job requirements only explains less than two-thirds of the variation in Job Culture, consistent with the variance decomposition showing that Job Culture captures the subculture of the unit. In addition, positions requiring more experience are more likely to emphasize culture, possibly because these roles involve people management or other managerial responsibilities. Postings demanding more specific skills (as captured by skill count) contain less culture information, suggesting that firms filling technical roles prioritize skill requirements over cultural attributes. Finally, postings that disclose salary information are significantly less likely to emphasize culture.
Overall, the findings show that firms emphasize culture in job postings strategically, focusing on roles requiring greater experience, managerial, or interpersonal skills, whereas technical roles prioritize skills and may downplay culture to prevent narrowing the applicant pool. Culture becomes more salient in tight labor markets but less so when firms rely on compensation as a recruitment tool.13
4. Disclosed Culture and Hiring Outcomes
We focus on employee inflows, which most directly measure hiring outcomes. Our main analyses assess whether disclosed culture in a job posting is associated with increased employee inflows. We estimate the following regression at the firm-MSA-quarter level:
|
Table 3. Summary Statistics
| Variable | Obs. | Mean | S.D. | Q1 | Median | Q3 |
|---|---|---|---|---|---|---|
| Inflow | 1,323,642 | 4.699 | 9.449 | 0.000 | 1.422 | 5.298 |
| Job Culture | 1,323,642 | 0.261 | 0.109 | 0.185 | 0.252 | 0.332 |
| Integrity | 1,323,642 | 0.037 | 0.025 | 0.019 | 0.034 | 0.050 |
| Teamwork | 1,323,642 | 0.068 | 0.039 | 0.040 | 0.064 | 0.092 |
| Innovation | 1,323,642 | 0.081 | 0.052 | 0.043 | 0.071 | 0.109 |
| Respect | 1,323,642 | 0.033 | 0.029 | 0.013 | 0.026 | 0.046 |
| Quality | 1,323,642 | 0.041 | 0.028 | 0.022 | 0.037 | 0.055 |
| Education | 1,323,642 | 10.050 | 6.144 | 5.333 | 12.000 | 14.746 |
| Experience | 1,323,642 | 2.382 | 2.226 | 0.000 | 2.000 | 3.667 |
| Length | 1,323,642 | 5.309 | 0.409 | 4.966 | 5.318 | 5.606 |
| Hiring Intensity | 1,323,642 | 2.942 | 2.375 | 1.099 | 2.565 | 4.394 |
| Skill Count | 1,323,642 | 9.894 | 5.471 | 6.000 | 9.500 | 13.357 |
| Insurance | 1,323,642 | 0.126 | 0.332 | 0.000 | 0.000 | 0.000 |
| Other Comp | 1,323,642 | 0.091 | 0.287 | 0.000 | 0.000 | 0.000 |
| Flexibility | 1,323,642 | 0.163 | 0.369 | 0.000 | 0.000 | 0.000 |
| Salary Disclosed | 1,323,642 | 0.088 | 0.220 | 0.000 | 0.000 | 0.000 |
| Advertised Mean Salary | 324,642 | 10.740 | 0.556 | 10.308 | 10.694 | 11.110 |
| Advertised Mean Salary (Expanded) | 548,752 | 10.717 | 0.556 | 10.281 | 10.655 | 11.082 |
| Outflow | 814,928 | 6.571 | 7.899 | 3.284 | 5.209 | 7.603 |
| Hiring Duration | 1,230,627 | 3.607 | 0.633 | 3.391 | 3.855 | 4.069 |
| Size | 1,323,642 | 9.147 | 1.913 | 7.804 | 9.025 | 10.327 |
| ROA | 1,323,642 | 0.014 | 0.022 | 0.004 | 0.013 | 0.022 |
| Leverage | 1,323,642 | 0.647 | 0.212 | 0.507 | 0.639 | 0.790 |
| MTB | 1,323,642 | 3.494 | 8.742 | 1.401 | 2.400 | 4.195 |
| IntanRatio | 1,323,642 | 0.257 | 0.219 | 0.049 | 0.217 | 0.435 |
Notes. This table provides summary statistics of key variables for our sample. The reported statistics for Job Culture and its five component culture scores are based on their raw values before standardization. The unit of observation is at the firm-MSA-quarter level. All variables are winsorized at the top and bottom 1% of the distribution. Variable definitions are provided in Table D.1. Obs., observations.
Table 4, panel A, provides the results from estimating Equation (3). We consider several empirical specifications. In column (1), we first estimate a model with only firm control variables. The coefficient on Job Culture is positive and significant at the 1% level, suggesting that disclosed culture is positively associated with subsequent employee inflow. In column (2), we include the full set of controls and fixed effects and observe that the coefficient remains positive and significant at the 1% level. In terms of economic magnitude, a one within-fixed-effect standard deviation increase in disclosed culture is associated with an approximately 0.14-percentage-point increase in worker inflows, representing a 9.7% increase relative to the sample median.17
|
Table 4. Job Posting Culture Information and Employee Inflows
| Panel A: Main analyses and dynamic trends | ||||
|---|---|---|---|---|
| Dep. Var.: | Inflowt+1 | Inflowt | Inflowt+2 | |
| (1) | (2) | (3) | (4) | |
| Job Culture | 0.423*** | 0.204*** | 0.043** | 0.065*** |
| (11.04) | (8.35) | (2.33) | (2.85) | |
| Education | −0.001 | −0.002 | −0.002 | |
| (−0.34) | (−0.67) | (−0.61) | ||
| Experience | 0.020** | 0.018** | 0.002 | |
| (2.22) | (2.16) | (0.20) | ||
| Length | 0.085 | 0.089* | 0.107*** | |
| (1.67) | (1.74) | (2.74) | ||
| Hiring Intensity | 0.122*** | 0.177*** | −0.048*** | |
| (8.92) | (9.70) | (−5.29) | ||
| Skill Count | 0.006 | 0.006 | −0.001 | |
| (1.41) | (1.37) | (−0.30) | ||
| Insurance | 0.038 | 0.064 | 0.036 | |
| (0.63) | (1.26) | (0.83) | ||
| Other Comp | 0.031 | 0.015 | −0.005 | |
| (0.69) | (0.31) | (−0.13) | ||
| Flexibility | 0.002 | 0.060 | −0.069 | |
| (0.03) | (1.26) | (−1.54) | ||
| Salary Disclosed | 0.004 | 0.010 | −0.072 | |
| (0.05) | (0.14) | (−0.90) | ||
| Unit of observation | Firm-MSA-Quarter | |||
| Firm controls | Yes | Yes | Yes | Yes |
| Occupation dist. controls | No | Yes | Yes | Yes |
| Firm-MSA FE | No | Yes | Yes | Yes |
| MSA-quarter FE | No | Yes | Yes | Yes |
| Observations | 1,323,642 | 1,303,803 | 1,303,803 | 1,067,165 |
| Adjusted R2 | 0.0045 | 0.0695 | 0.0695 | 0.0685 |
| Panel B: Additional analyses | ||||
|---|---|---|---|---|
| Dep. Var.: | Inflowt+1 | Hiring Duration | Outflow | |
| (1) | (2) | (3) | (4) | |
| Job Culture | 0.300*** | 0.229*** | −0.025*** | −0.043* |
| (7.45) | (7.07) | (−6.01) | (−1.99) | |
| Education | 0.008 | −0.005 | 0.001** | 0.007* |
| (1.17) | (−1.00) | (2.32) | (1.78) | |
| Experience | 0.003 | 0.010 | 0.001 | −0.017** |
| (0.17) | (0.68) | (0.83) | (−2.68) | |
| Length | 0.058 | 0.080 | 0.022 | −0.137** |
| (0.53) | (1.12) | (1.54) | (−2.06) | |
| Hiring Intensity | 0.102*** | 0.102*** | −0.026*** | −0.103*** |
| (4.55) | (5.43) | (−7.06) | (−10.34) | |
| Skill Count | 0.001 | 0.004 | 0.001 | 0.003 |
| (0.12) | (0.59) | (0.62) | (0.77) | |
| Insurance | 0.058 | 0.042 | −0.009 | 0.057 |
| (1.10) | (0.84) | (−1.20) | (0.98) | |
| Other Comp | 0.029 | 0.016 | −0.011 | 0.062 |
| (0.49) | (0.30) | (−1.62) | (1.03) | |
| Flexibility | 0.028 | 0.069 | −0.011 | −0.039 |
| (0.65) | (1.46) | (−1.39) | (−0.87) | |
| Salary Disclosed | 0.023 | −0.167** | 0.039** | 0.029 |
| (0.22) | (−2.27) | (2.34) | (0.36) | |
| Advertised Mean Salary | 0.025 | |||
| (0.54) | ||||
| Advertised Mean Salary (Expanded) | 0.058* | |||
| (1.81) | ||||
| Dissatisfaction | 0.122*** | |||
| (2.90) | ||||
| Unit of observation | Firm-MSA-Quarter | |||
| Firm controls | Yes | Yes | Yes | Yes |
| Occupation dist. controls | Yes | Yes | Yes | Yes |
| Firm-MSA FE | Yes | Yes | Yes | Yes |
| MSA-quarter FE | Yes | Yes | Yes | Yes |
| Observations | 308,075 | 532,525 | 1,230,627 | 808,412 |
| Adjusted R2 | 0.1224 | 0.0906 | 0.1906 | 0.6175 |
Notes. This table reports the results from firm-MSA-quarter-level regressions of employee inflows on job posting culture scores. The main dependent variables in panel A, columns (1) and (2), are Inflowt+1. In column (3) (column (4)), the dependent variable is Inflowt (Inflowt+2). Columns (2)–(4) include firm-MSA and MSA-quarter fixed effects, as well as a set of controls capturing the shares of job postings across occupations. In panel B, columns (1)–(2) additionally control for advertised salaries disclosed in job postings. Column (1) considers salaries explicitly disclosed in job postings, whereas column (2) extends the analysis to include salaries disclosed in similar job postings. In columns (3) and (4), the dependent variables are Hiring Duration and Outflow, respectively. Firm controls include Size, ROA, Leverage, MTB, and IntanRatio. “Occupation dist. controls” are variables measuring the percentage of job postings in each of the 23 SOC occupation categories within the unit of observation. Standard errors are clustered at the firm, MSA, and quarter levels for both panels. All variables are winsorized at the top and bottom 1% of the cross-sectional distribution. The unit of observation is at the firm-MSA-quarter level. Variables are defined in Table D.1. FE, fixed effects; dist., distribution.
*, **, and ***, significant at 10%, 5%, and 1%, respectively.
Columns (3) and (4) extend the specification dynamically. Using inflows measured in quarters t and t+2, we find the coefficients on Job Culture to be positive and significant, indicating that disclosed culture is positively associated with inflows beginning in the contemporaneous period and persisting through the second quarter after job postings, though with smaller magnitudes.18
Next, we conduct a series of robustness and additional tests to ascertain the relation between disclosed culture and hiring outcomes. We begin by examining whether the effect of disclosed culture persists after accounting for expected salary, arguably the most important consideration for job seekers. We use the advertised salary present in job postings to measure expected salary. We do not include salary in our main analyses because the vast majority of job postings (around 92% of job postings in our sample) do not disclose salary information.19 In addition, some companies only provide a salary range that is wide and uninformative (e.g., Brown 2023, Stahle 2023). In column (1) of Table 4, panel B, we reestimate Equation (3) while controlling for the natural log of the mean salaries (Advertised Mean Salary) disclosed in job postings within a firm-MSA-quarter. As expected, the sample in these analyses is substantially smaller than that in our baseline tests (308,075 observations compared with 1,303,803 observations). Job Culture continues to load positively and significantly at the 1% level. The coefficient on the advertised salary measure is positive but insignificant, possibly because of the lack of power in this analysis.
To further explore this issue, we construct an expanded expected salary sample using average advertised salaries from similar job postings.20 This approach expands the sample to 532,525 observations (column (2)). We continue to find that Job Culture loads positively and significantly. We document a positive and significant coefficient on the advertised salary variable (Advertised Mean Salary (Expanded)), suggesting that salary information is also important in attracting workers. The results presented in columns (1) and (2) indicate that job seekers view culture information to be distinct from salary information.
Next, we use job posting duration as an alternative measure of hiring outcomes. We expect more culture information to lead to a quicker identification of suitable candidates and thus a shorter job posting duration. To test our prediction, we reestimate Equation (3) and replace the dependent variable with Hiring Duration, the natural log of the days the job posting remains open and active for applicants (Chen and Li 2023).21 As shown in column (3) of panel B, the coefficient on Job Culture is negative and significant, suggesting that disclosed culture helps firms fill vacancies more quickly.
Finally, we extend the analysis by exploring the relation between Job Culture and subsequent employee outflows. Minimal culture disclosure may lead job seekers to make overly optimistic assumptions about cultural fit, resulting in unmet expectations and higher outflows (Sheridan 1992). To test this, we reestimate Equation (3) using average employee outflow over the subsequent four quarters (Outflow) as the dependent variable, capturing potential departures that arise after employees have had sufficient time to recognize a poor cultural fit, search for alternative opportunities, and ultimately leave the organization.22 We control for Dissatisfaction, an indicator variable of whether a facility’s Glassdoor culture rating falls in the bottom 30% in a quarter. This control helps account for broader workplace conditions that drive departures, ensuring that the estimated effect of Job Culture captures disclosure-related matching rather than dissatisfaction-driven turnover. As reported in column (4), the coefficient on Job Culture is negative and significant at the 10% level, consistent with the notion that employees in high Job Culture firms have better culturally aligned new hires.23
Overall, the evidence in this section indicates that salient disclosed culture in job postings facilitates better job seeker-firm matching, improving hiring outcomes.
5. Mechanism Tests
Having established a robust relation between disclosed culture and employee inflow, we next assess the mechanisms for our findings. First, we conduct cross-sectional analyses to examine predictable variation in the effect of disclosed culture on inflows. Next, we provide evidence on the cultural fit channel using the variation in the salience of certain dimensions of culture and tests about the interview process.
5.1. Cross-Sectional Analyses
We conduct two sets of cross-sectional analyses to shed light on the mechanisms underlying the observed effect. Our proposed mechanism is that job seekers respond to disclosed culture because it reduces frictions in understanding firm culture and facilitates better sorting, which implies two conditions. First, job seekers value culture. Second, they perceive job postings to be informative about culture.
5.1.1. The Role of Job Seekers’ Valuation of Culture.
We begin by examining whether job seekers’ responses to culture information vary with how much they value culture, which we measure using job features and labor market conditions. First, cultural fit is likely to matter more to job seekers interested in creative roles because supportive environments that encourage psychological safety, risk-taking, and collaboration enhance employees’ creativity and innovativeness (e.g., Woodman et al. 1993, Harvey 2014). By contrast, job seekers of entry-level positions often prioritize career opportunities, which may diminish the importance of culture information. To test these predictions, we use occupations in Arts, Design, Entertainment, Sports, and Media (SOC code 27) to proxy for creative roles (Creative Roles) and postings with no education or experience requirements to proxy for entry-level jobs (No Education Requirement and No Experience Requirement).
We reestimate Equation (3) augmented individually with these variables and their interactions with Job Culture. Column (1) of Table 5 reports the results for creative roles, in which we use firm-MSA-quarter-occupation-level analysis to exploit variation in job types within facilities. We find the coefficient on Creative Roles × Job Culture to be positive and significant at the 5% level, suggesting that disclosed culture has a stronger effect on attracting employees for creative roles. Columns (2) and (3) report the results based on educational and experience requirements, respectively. The coefficients on No Education Requirement × Job Culture and No Experience Requirement × Job Culture are negative and significant at the 10% and 1% level, respectively, consistent with the notion that disclosed culture has a weaker effect on inflows for entry-level jobs.
|
Table 5. Disclosed Culture, Employee Inflows, and Job Features
| Dep. Var.: Inflowt+1 | (1) | (2) | (3) | (4) | (5) |
|---|---|---|---|---|---|
| Creative Roles × Job Culture | 0.252** | ||||
| (2.31) | |||||
| No Education Requirement × Job Culture | −0.066* | ||||
| (−1.79) | |||||
| No Experience Requirement × Job Culture | −0.086*** | ||||
| (−2.84) | |||||
| Unemployment × Job Culture | −1.492** | ||||
| (−2.15) | |||||
| Δ Hiring Intensity × Job Culture | 0.091*** | ||||
| (4.73) | |||||
| Job Culture | 0.092*** | 0.227*** | 0.237*** | 0.294*** | 0.205*** |
| (4.65) | (7.33) | (7.88) | (6.03) | (8.32) | |
| No Education Requirement | −0.040 | ||||
| (−0.72) | |||||
| No Experience Requirement | −0.169*** | ||||
| (−3.73) | |||||
| Δ Hiring Intensity | 0.259*** | ||||
| (13.18) | |||||
| Unit of observation | Firm-MSA-Quarter-Occupation | Firm-MSA-Quarter | |||
| Job controls | Yes | Yes | Yes | Yes | Yes |
| Firm controls | Yes | Yes | Yes | Yes | Yes |
| Occupation dist. controls | No | Yes | Yes | Yes | Yes |
| Firm-MSA FE | Yes | Yes | Yes | Yes | Yes |
| MSA-quarter FE | Yes | Yes | Yes | Yes | Yes |
| Quarter-occupation FE | Yes | No | No | No | No |
| Observations | 2,230,372 | 1,303,803 | 1,303,803 | 1,303,803 | 1,303,803 |
| Adjusted R2 | 0.0237 | 0.0695 | 0.0696 | 0.0695 | 0.0695 |
Notes. This table shows how the association between disclosed culture and employee inflows varies across different job features or labor market conditions. The dependent variable is Inflowt+1 for all columns. The job features considered include Creative Roles in column (1), No Education Requirement in column (2), and No Experience Requirement in column (3). Labor market conditions are captured by Unemployment in column (4) and Δ Hiring Intensity in column (5). Control variables are as specified in Table 4, panel A. In column (1), the unit of observation is at the firm-MSA-quarter-occupation level, and the specification includes firm-MSA, MSA-quarter, and quarter-occupation fixed effects. In columns (2)–(5), the unit of observation is at the firm-MSA-quarter level, and the specifications include firm-MSA and MSA-quarter fixed effects. “Occupation dist. controls” are variables measuring the percentage of job postings in each of the 23 SOC occupation categories within the unit of observation. Standard errors are clustered at the firm, MSA, and quarter levels. All variables are winsorized at the top and bottom 1% of the cross-sectional distribution. Variables are defined in Table D.1.
*, **, and ***, significant at 10%, 5%, and 1%, respectively.
Second, labor market conditions can shape how much job seekers consider culture information. When competition for jobs is high, job seekers may prioritize securing employment over culture. Therefore, we expect their responses to culture information to weaken in more competitive labor markets. We measure the supply of labor using local unemployment rate (Unemployment) and the demand of labor using changes in firms’ number of job postings (Δ Hiring Intensity). Columns (4) and (5) report the results. Consistent with our prediction, we observe a negative coefficient on Unemployment × Job Culture (significant at the 5% level) and a positive coefficient on Δ Hiring Intensity × Job Culture (significant at the 1% level). Thus, disclosed culture affects inflows more when job seekers face less labor competition.
5.1.2. The Role of Information Asymmetry.
Next, we explore the role of information asymmetry that a job seeker faces with respect to learning about a position’s culture. As discussed in Section 2, job seekers may learn about culture from alternative sources, which reduces their reliance on job postings. We therefore expect the effect of job postings on inflows to weaken when these alternative sources are more prevalent and helpful. To test this conjecture, we reestimate Equation (3) and interact Job Culture with three proxies for information asymmetry. First, we use facility (i.e., firm-MSA) size, assuming that larger facilities are more visible locally, reducing information asymmetry. Second, we consider the number of current employee reviews on Glassdoor and, third, the helpfulness of those reviews, as rated by Glassdoor users.
Table 6 presents the results. Column (1) reports the results based on facility size. Large Facility is an indicator variable that equals one if the total number of employees of a facility is in the top 30% of firm-MSAs in that quarter, and zero otherwise. We find the coefficient on Large Facility × Job Culture to be negative and significant at the 1% level, indicating that the effect of disclosed culture on inflows weakens when the facility is larger and thus culture information is more easily accessible. Column (2) reports the results based on the number of Glassdoor reviews. More Reviews is an indicator variable that equals one if the count of current employee reviews on Glassdoor over the past year is in the top 30% of firm-MSAs in that quarter, and zero otherwise. The coefficient on More Reviews × Job Culture is negative and significant at the 1% level, suggesting that the effect of disclosed culture on inflows weakens when more reviews are available. Column (3) reports the results based on the helpfulness of Glassdoor reviews. High Helpfulness is an indicator variable that equals one if the average helpfulness of reviews from current employees is in the top 30% of the firm-MSAs in that quarter, and zero otherwise. The coefficient on High Helpfulness × Job Culture is negative and significant at the 1% level, suggesting that the effect of disclosed culture on inflows weakens when Glassdoor reviews are more helpful.
|
Table 6. Disclosed Culture, Employee Inflows, and Information Asymmetry
| Dep. Var.: Inflowt+1 | (1) | (2) | (3) |
|---|---|---|---|
| Large Facility × Job Culture | −0.185*** | ||
| (−6.19) | |||
| More Reviews × Job Culture | −0.125*** | ||
| (−3.32) | |||
| High Helpfulness × Job Culture | −0.191*** | ||
| (−3.74) | |||
| Job Culture | 0.289*** | 0.216*** | 0.207*** |
| (9.95) | (8.42) | (8.44) | |
| Large Facility | −0.173*** | ||
| (−3.46) | |||
| More Reviews | −0.317*** | ||
| (−7.38) | |||
| High Helpfulness | −0.175*** | ||
| (−3.21) | |||
| Unit of observation | Firm-MSA-Quarter | ||
| Job controls | Yes | Yes | Yes |
| Firm controls | Yes | Yes | Yes |
| Occupation dist. controls | Yes | Yes | Yes |
| Firm-MSA FE | Yes | Yes | Yes |
| MSA-quarter FE | Yes | Yes | Yes |
| Observations | 1,303,803 | 1,303,803 | 1,303,803 |
| Adjusted R2 | 0.0696 | 0.0696 | 0.0695 |
Notes. This table reports how the relation between disclosed culture in job postings and employee inflows varies with job seeker information asymmetry. The dependent variable is Inflowt+1 for all columns. Job seeker information asymmetry is measured with Large Facility in column (1), More Reviews in column (2), and High Helpfulness in column (3). Control variables are as specified in Table 4, panel A. “Occupation dist. controls” are variables measuring the percentage of job postings in each of the 23 SOC occupation categories within the unit of observation. Standard errors are clustered at the firm, MSA, and quarter levels. All variables are winsorized at the top and bottom 1% of the cross-sectional distribution. The unit of observation is at the firm-MSA-quarter level. All columns include firm-MSA and MSA-quarter fixed effects. Variables are defined in Table D.1.
*** indicates significance at the 1% level.
Taken together, our results show that disclosed culture has a stronger effect on inflows when job seekers place a higher value on cultural fit and a weaker effect when alternative information sources about culture are more prevalent and helpful. These findings are consistent with job seekers responding to disclosed culture driving inflows.
5.2. Culture-Fit Channel
Next, we examine the cultural fit channel using two additional empirical designs. The first one delves into situations when certain cultural dimensions have a higher salience for job seekers. The second test explores the hiring process using job applicants’ reviews of the interview process on Glassdoor.
5.2.1. Individual Cultural Dimension Analyses.
Because we lack direct measures of job seekers’ preferences, we use two settings where external conditions may heighten the importance of specific cultural dimensions. These settings allow us to infer job seekers’ preferences based on changes in how individual cultural dimensions affect inflows. First, we use the BLM movement, which began at the end of May 2020, as a plausibly exogenous shock that increased job seekers’ preference for the respect cultural value, which reflects diversity, equity, and inclusion (Li et al. 2021). The protests were one of the largest social movements in U.S. history (Buchanan et al. 2020). We expect culture information related to “respect” to more strongly attract employees after BLM. To test this conjecture, we define BLM as an indicator that equals one for the months between June 2020 and November 2020 and zero for the months between December 2019 and May 2020 and estimate the following regression using a monthly-level sample during this year:
|
Table 7. Job Posting Culture and Employee Inflows: Individual Cultural Dimension Analyses
| Cultural dimension | Respect | Integrity | ||
|---|---|---|---|---|
| Dep. Var.: Inflowt+1 | (1) | (2) | (3) | (4) |
| BLM × Respect | 0.072** | |||
| (2.65) | ||||
| BLM × Non-Respect Culture | −0.041 | |||
| (−1.36) | ||||
| Violation × Integrity | 0.059** | |||
| (2.52) | ||||
| Violation × Non-Integrity Culture | 0.002 | |||
| (0.09) | ||||
| Respect | −0.032 | |||
| (−1.50) | ||||
| Non-Respect Culture | 0.023 | |||
| (1.06) | ||||
| Integrity | 0.099*** | |||
| (4.88) | ||||
| Non-Integrity Culture | 0.183*** | |||
| (7.30) | ||||
| Violation | −0.071* | −0.072* | ||
| (−1.84) | (−1.86) | |||
| Unit of observation | Firm-MSA-Month | Firm-MSA-Quarter | ||
| Job controls | Yes | Yes | Yes | Yes |
| Firm controls | Yes | Yes | Yes | Yes |
| Occupation dist. controls | Yes | Yes | Yes | Yes |
| Firm-MSA FE | Yes | Yes | Yes | Yes |
| MSA-month FE | Yes | Yes | No | No |
| MSA-quarter FE | No | No | Yes | Yes |
| Observations | 298,717 | 298,717 | 1,303,803 | 1,303,803 |
| Adjusted R2 | 0.2704 | 0.2703 | 0.0695 | 0.0695 |
Notes. This table presents results examining the relationship between employee inflows and specific cultural dimensions using two settings related to individual cultural values. Columns (1)–(2) focus on how the association between culture information in job postings and inflow changes around the Black Lives Matter (BLM) movement. The sample consists of 298,717 firm-MSA-month-level observations in the one-year period centered around May 2020, that is, from December 2019 to November 2020. The key variables of interest are Respect in column (1) or the sum of Integrity, Teamwork, Innovation, and Quality (Non-Respect Culture) in column (2). Columns (1)–(2) include firm-MSA and MSA-month fixed effects. Standard errors are clustered at the firm, MSA, and month levels in columns (1)–(2). Columns (3)–(4) analyze how the relation between culture and employee inflow changes in response to significant violations. The key variables are Integrity in column (3) and the sum of Respect, Teamwork, Innovation, and Quality (Non-Integrity Culture) in column (4). In columns (3)–(4), the unit of observation is at the firm-MSA-quarter level. Both columns include firm-MSA and MSA-quarter fixed effects. “Occupation dist. controls” are variables measuring the percentage of job postings in each of the 23 SOC occupation categories within the unit of observation. Standard errors are clustered at the firm, MSA, and quarter levels in columns (3)–(4). Variables are defined in Table D.1.
*, **, and ***, significant at 10%, 5%, and 1%, respectively.
Next, we use industry-level violations as a setting that is associated with increased preferences of job seekers for integrity. Regulatory violations and corporate misconduct heighten ethical concerns, potentially making integrity-related culture more important for job seekers. We thus expect culture information related to integrity to be more attractive to job seekers in industries experiencing higher levels of recent corporate misconduct. To test this conjecture, we estimate the following regression:
In sum, findings from these two analyses support the cultural fit channel, showing predictable variation in how disclosed culture affects inflows that aligns with changes in job seekers’ preferences.
5.2.2. Interview Analyses.
Next, we assess the cultural fit channel using the context of job interviews. Interview outcomes provide evidence about the hiring process itself and shed light on the intermediate steps in recruiting, which complements our main analyses based on hiring outcomes. If disclosed culture facilitates cultural fit, firms should be more likely to extend offers to interviewed candidates and candidates who receive offers should be more likely to accept when culture information is more salient in job postings. To test these predictions, we estimate the following model at the firm-quarter level:
We report the results in Table 8. Panel A presents the summary statistics of the sample. Culture is mentioned in 2.3% of interview reviews, 42.4% of interviews yield offers, and 86.3% of offers are accepted. Panel B presents the regression results. In column (1), using Interview Culture as the dependent variable, we find that the coefficient on Job Culture is positive and significant at the 1% level. This result indicates that firms highlighting culture are more likely to emphasize culture during interviews, further validating that firms discuss culture in job postings to seek employees who will fit with their cultures.
|
Table 8. Job Posting Culture and Interviews
| Panel A: Summary statistics | ||||||
|---|---|---|---|---|---|---|
| Variable | Obs. | Mean | S.D. | Q1 | Median | Q3 |
| Interview Culture | 25,323 | 0.023 | 0.094 | 0.000 | 0.000 | 0.008 |
| Offer Rate | 25,323 | 0.424 | 0.266 | 0.250 | 0.429 | 0.600 |
| Accept Rate | 21,465 | 0.863 | 0.261 | 0.833 | 1.000 | 1.000 |
| Panel B: Regressions | |||
|---|---|---|---|
| Dep. Var.: | (1) | (2) | (3) |
| Interview Culture | Offer Rate | Accept Rate | |
| Job Culture | 0.019*** | 0.038** | 0.060*** |
| (4.75) | (2.41) | (4.87) | |
| Unit of observation | Firm-Quarter | ||
| Job controls | Yes | Yes | Yes |
| Firm controls | Yes | Yes | Yes |
| Occupation dist. controls | Yes | Yes | Yes |
| Quarter FE | Yes | Yes | Yes |
| Industry FE | Yes | Yes | Yes |
| Observations | 25,323 | 25,323 | 21,465 |
| Adjusted R2 | 0.0106 | 0.1604 | 0.0396 |
Notes. This table provides results examining how culture information in job postings affects subsequent interview outcomes. The sample consists of 25,323 firm-quarter-level observations. Panel A reports the summary statistics of the main variables used in the analyses. Panel B reports the results from regressions of interview outcomes on Job Culture. Control variables are as specified in Table 4, panel A. “Occupation dist. controls” are variables measuring the percentage of job postings in each of the 23 SOC occupation categories within the unit of observation. Industry and quarter fixed effects are included. Standard errors are clustered at the firm and quarter levels. All variables are winsorized at the top and bottom 1% of the cross-sectional distribution. Variables are defined in Table D.1.
** and *** indicate significance at the 5% and 1% levels, respectively.
We then test whether disclosed culture in job postings is associated with a higher likelihood that firms extend offers to job seekers (Offer Rate) and their acceptance of offers (Accept Rate). Consistent with the notion that more disclosed culture helps attract more suitable candidates into the interview pool, we find that Job Culture is positively associated with both likelihoods (columns (2) and (3)).
Overall, our interview analyses suggest that culture information facilitates better cultural fit and, consequently, better matches between firms and job seekers.
6. Additional Analyses
Our results thus far indicate a strong and positive association between disclosed culture and employee inflows and that this effect is likely driven by disclosed culture facilitating job seeker-firm matching. Next, we conduct several additional analyses to assess alternative explanations and ascertain the robustness of results. First, to help strengthen our argument that culture information in job postings rather than that in other sources drives our effects, we control for ECall Culture, the earnings-call corporate culture measure developed by Li et al. (2021), Website Culture, the discussion of culture on firms’ “About Us” pages, and Glassdoor Culture, the Glassdoor culture ratings from current employees.26 In columns (1)–(3) of Table 9, panel A, we find that after controlling for ECall Culture, Website Culture, and Glassdoor Culture, Job Culture is still positively associated with inflow, suggesting that job postings contain culture information that is distinct and informative to job seekers.
|
Table 9. Job Posting Culture Information and Employee Inflows: Robustness Tests
| Panel A: Alternative controls and dependent variables | |||||||
|---|---|---|---|---|---|---|---|
| Dep. Var.: | (1) | (2) | (3) | (4) | (5) | (6) | (7) |
| Inflowt+1 | Inflowt+1 | Inflowt+1 | Inflowt+1 | Unscaled Inflowt+1 | Inflow Scaled by Postingst+1 | Inflowt+1 | |
| Job Culture | 0.186*** | 0.239*** | 0.279*** | 0.208*** | 0.112*** | 0.008** | |
| (6.84) | (5.68) | (8.20) | (8.34) | (4.17) | (2.50) | ||
| ECall Culture | −0.037 | ||||||
| (−1.16) | |||||||
| Website Culture | −0.017 | ||||||
| (−0.38) | |||||||
| Glassdoor Culture | 0.024 | ||||||
| (1.32) | |||||||
| Graduate | −0.226 | ||||||
| (−1.57) | |||||||
| Undergraduate | −0.157 | ||||||
| (−1.31) | |||||||
| Seniority | 0.167*** | ||||||
| (3.69) | |||||||
| Bottom Culture | −0.211*** | ||||||
| (−6.15) | |||||||
| Top Culture | 0.194*** | ||||||
| (5.24) | |||||||
| Unit of observation | Firm-MSA-Quarter | ||||||
| Job and firm controls | Yes | Yes | Yes | Yes | Yes | Yes | Yes |
| Occupation dist. controls | Yes | Yes | Yes | Yes | Yes | Yes | Yes |
| Firm-MSA FE | Yes | Yes | Yes | Yes | Yes | Yes | Yes |
| MSA-quarter FE | Yes | Yes | Yes | Yes | Yes | Yes | Yes |
| Observations | 923,588 | 434,877 | 655,667 | 1,303,803 | 1,303,803 | 1,285,656 | 1,303,803 |
| Adjusted R2 | 0.0730 | 0.0795 | 0.0699 | 0.0696 | 0.7731 | 0.1857 | 0.0695 |
| Panel B: Alternative samples | ||||||||
|---|---|---|---|---|---|---|---|---|
| Dep. Var.: Inflowt+1 | (1) | (2) | (3) | (4) | (5) | (6) | (7) | (8) |
| Sample: | No California Business | No Tech Firms | Fewer Required Skills | Tech Firms | Excl. Managerial Positions | Large Firms | Small Firms | Singular Occupation Type Only |
| Job Culture | 0.218*** | 0.207*** | 0.226*** | 0.209*** | 0.243*** | 0.138*** | 0.229*** | 0.229*** |
| (8.33) | (8.32) | (6.89) | (3.96) | (7.14) | (5.35) | (4.92) | (7.00) | |
| AI Jargon | −0.022 | |||||||
| (−0.50) | ||||||||
| Unit of observation | Firm-MSA-Quarter | |||||||
| Job and firm controls | Yes | Yes | Yes | Yes | Yes | Yes | Yes | Yes |
| Occupation dist. controls | Yes | Yes | Yes | Yes | Yes | Yes | Yes | Yes |
| Firm-MSA FE | Yes | Yes | Yes | Yes | Yes | Yes | Yes | Yes |
| MSA-quarter FE | Yes | Yes | Yes | Yes | Yes | Yes | Yes | Yes |
| Observations | 1,091,659 | 1,129,264 | 354,313 | 170,115 | 621,823 | 407,239 | 367,968 | 640,236 |
| Adjusted R2 | 0.0656 | 0.0675 | 0.0473 | 0.1261 | 0.0470 | 0.0898 | 0.0785 | 0.0320 |
Notes. This table provides robustness tests to our main findings. In panel A, we add alternative controls and use alternative dependent variables. In panel B, we test our findings in several subsamples. The unit of observation is at the firm-MSA-quarter level. “Occupation dist. controls” are variables measuring the percentage of job postings in each of the 23 SOC occupation categories within the unit of observation. Firm-MSA and MSA-quarter fixed effects are included. Standard errors are clustered at the firm, MSA, and quarter levels. Variables are defined in Table D.1. Excl., excluding. ** and *** indicate significance at the 5% and 1% levels, respectively
One possible concern is that firms communicating culture in job postings may be lowering hiring standards to meet staffing needs, driving our results. Untabulated analyses show no relation between disclosed culture and the education and experience of new hires, inconsistent with this explanation. To further mitigate this concern, we control for the education and experience of the inflow workforce in Equation (3). In column (4), we continue to find that the coefficient on Job Culture is positive and significant.
Next, to ensure that the denominator used to scale employee inflows does not drive our results, we use an unscaled measure of inflows or inflows scaled by the number of job postings in the previous quarter, which approximately measures labor demand, as the dependent variable.27 We report the results in columns (5) and (6). The coefficients on Job Culture remain positive and statistically significant.
We also explore whether culture acts as a motivator or a hygiene factor for job seekers, drawing on Herzberg’s two-factor theory. If culture is only a hygiene factor, we would expect that its presence, regardless of emphasis, would reduce dissatisfaction and that increasing the amount of culture information would have little effect. To examine this, we group firm-MSA-quarters into Bottom Culture (bottom 30%) and Top Culture (top 30%) within each quarter and reestimate Equation (3) including these indicators. The results are reported in column (7). We find that the coefficient on Bottom Culture is negative and that on Top Culture is positive, implying that the degree of cultural emphasis matters, beyond whether culture is present. That is, culture functions as a motivator for job seekers who value culture alignment rather than serving as merely a baseline hygiene factor.
We use job postings and employee inflow sourced primarily through online platforms, which likely overrepresents online job postings and white-collar jobs. In panel B, we consider subsamples to ensure the generalizability of our findings. First, we examine whether technology firms drive our results, because they may be more likely to advertise culture. We reestimate Equation (3) excluding facilities of firms headquartered in California where many technology firms reside or facilities of firms with a two-digit Standard Industrial Classification (SIC) code of 35 or 73. The results are reported in columns (1) and (2), and our main inferences are unchanged.
Second, we consider whether job specificity or job type drives our findings. In column (3), we retain only observations specifying low skill requirements (in the bottom 30% in the average number of skills of the firm-MSAs in that quarter). In column (4), we follow Baruffaldi et al. (2020) and control for the prevalence of AI-related keywords in job postings for a subsample of technology firms. In column (5), we exclude firm-MSA-quarter observations with job postings that demand skills typically associated with leadership positions, such as project management and people management. Our results remain robust in all tests, suggesting that our findings are not caused by skill-related information in job postings or confined to managerial roles.
Third, we test the robustness of our results across different firm sizes. Because Revelio estimates employee inflows and outflows based on data sources such as online professional profiles and resumes, these measures may be less accurate for small firms because of their limited publicly available information. We reestimate Equation (3) for large and small firms (top and bottom 30% in terms of total assets at the beginning of the quarter, respectively) separately and report the results in columns (6) and (7). The coefficients on Job Culture remain positive and significant for both samples. Nevertheless, despite our effort to ensure the generalizability of our findings, we acknowledge that our results may not extend to labor market populations that are underrepresented in the data (such as those with only offline job postings).
Finally, one central prediction in our study is that making culture information salient in job postings helps attract job seekers and ultimately helps fill employment vacancies. Ideally, we would measure the effect of a job posting on the firm’s ability to fill the corresponding job. However, because this information is unobservable, we rely on firm-MSA-quarter-level aggregation for our main tests. To alleviate concerns about measurement errors, we reexamine Equation (3) for a subsample of observations that only contain one SOC code. As shown in column (8), our inferences remain unchanged, as the coefficient on Job Culture remains positive and significant at the 1% level. In an untabulated test, we repeat the analysis at the firm-MSA-quarter-occupation level while including quarter-occupation fixed effects. We find that the coefficient on Job Culture remains positive and significant, further demonstrating the robustness of our results. Note that these two additional analyses further mitigate the concern that both culture-related language in job postings and hiring outcomes are driven by jobs’ underlying tasks and responsibilities.
In sum, although we cannot rule out all alternative explanations, the collective evidence from our empirical analyses based on different outcome variables and empirical designs suggests that disclosed culture likely improves hiring outcomes through facilitating job seeker-firm matching.
7. Conclusion
Corporate culture represents one of the critical factors that job seekers consider. We examine the labor market effects of emphasizing corporate culture information in job postings and find that highlighting core values in a job posting attracts job seekers, especially when cultural fit matters more to those job seekers and information asymmetries are more pronounced. Our findings are relevant in light of recent SEC requirements emphasizing the disclosure of material information about human capital, such as information about culture. In addition, our study has practical implications. Greater transparency about culture can help job seekers make better decisions about potential employers. Despite these benefits, managers should be mindful that emphasizing cultural fit too strongly may inadvertently discourage diversity, suggesting a need to balance culture alignment with inclusion goals.
We view our paper as opening several fruitful directions. First, researchers could develop empirical designs that more cleanly separate the cultural framing of a job from its underlying tasks and responsibilities. Second, although our analyses focus on job seekers’ responses, future research can examine how managers decide which aspects of culture to disclose and whether these disclosures lead to better matches in terms of performance outcomes.
This paper benefited from helpful suggestions from Dennis Campbell, Jung Ho Choi, Fabrizio Ferri, Janet Gao, Michael Guo, Jonathan Glover, Jillian Grennan, Kai Li, Sara Malik, David Reeb, Michael Shen, Gurpal Sran, Suraj Srinivasan, Sebastian Tideman, Benjamin Yost, Ronghuo Zheng, and seminar and conference participants at MIT, National University of Singapore, Syracuse University, 2023 Berkeley Culture Conference, MIT Asia 2022 Accounting Conference, FARS 2023 Midyear Meeting, Hawaii Accounting Research Conference 2023, AFA 2023 Annual Meeting, CFEA 2022 Meeting, and the ICGI 2022 Conference. The authors are grateful to Cindy Kuang and Jinyuan Guo for excellent research assistance.
Appendix A. Seed and Representative Words/Phrases in Culture Dictionaries
Table A.1 lists words and phrases associated with cultural values.
|
Table A.1. Seed and Representative Words/Phrases in Culture Dictionaries
| Panel A: Seed words/phrases for cultural values | |
|---|---|
| Cultural values | Seed words/phrases |
| Integrity | Integrity, ethic, ethical, ethically, accountable, accountability, trust, honesty, honest, honestly, fair, fairness, responsibility, responsible, transparency, transparent |
| Teamwork | Teamwork, collaboration, collaborate, collaborative, cooperation, cooperate, cooperative |
| Innovation | Innovation, innovate, innovative, creativity, creative, passion, passionate, efficiency, efficient, excellence |
| Respect | Respect, respectful, talent, talented, employee, dignity, empowerment, empower, diverse, diversity, inclusive, inclusivity, inclusion |
| Quality | Quality, customer, commitment, customer commitment, dedication, dedicated, dedicate, customer expectation |
| Panel B: Thirty most representative words/phrases in each cultural value’s dictionary | |
|---|---|
| Cultural values | Representative words/phrases in the dictionary |
| Integrity | Integrity, accountability, transparency, honesty, accountable, ethical, professionalism, honest, fairness, behavior, transparent, trust, ownership, honesty integrity, uphold, fair, consistent, importance, highest ethical standard, role model, business ethic, ownership accountability, performance, company value, objective, ethically, safety, ethic, confidence, ethical behavior |
| Teamwork | Collaboration, cooperation, collaborative, collaboratively, teamwork, collaborate, peer, cooperative, foster, cross-functional, cross functional, cooperate, collaborates, partnership, productive, positive, cross-functionally, cohesive, colleague, business partner, cooperatively, influence, partnering, leadership, team work, amongst, partner, engage, team, cross functionally |
| Innovation | Innovation, innovative, innovate, passion, creative, creativity, excellence, passionate, focus, data-driven, approach, sustainable, product innovation, best-in-class, champion, mindset, idea, energy, challenge, continuous improvement, world-class, think, success, aim, user experience, thought leadership, way, mind, pragmatic, intelligent |
| Respect | Respect, culture, diversity, empower, diverse, talent, core value, embrace, inspire, empowerment, collective, talented, encourage, workforce, workplace, contribution, supportive, believe, respectful, recognition, inclusive, mutual respect, employee engagement, career development, perspective, inspiring, community, strength, employee, reward |
| Quality | Commitment, strive, dedication, quality, dedicate, value, customer commitment, goal, customer expectation, customer, satisfaction, high-quality, customer satisfaction, committed, dedicated, expectation, quality product, exceed customer expectation, responsiveness, commit, customer success, deliver, client, quality service, promise, customer experience, service excellence, client satisfaction, effort, consistently |
Appendix B. Job Posting Examples
Table B.1 presents two examples of job postings. Panel A (B) presents an example with a high (low) culture score. Words in bold are the seed and the 30 most representative words/phrases listed in Table A.1 in Appendix A.
|
Table B.1. Job Postings with High and Low Culture Scores
| Panel A: Example of a job posting with a high culture score | ||
|---|---|---|
| Firm: Amazon.com | Role: Program Manager III - Technical Training | |
| Date: 2019-08-31 | Location: Sumner, WA | Culture score percentile: 98th |
| Are you inspired by invention? Is problem solving through teamwork in your DNA? Do you like the idea of seeing how your work impacts the bigger picture? Answer yes to any of these and you’ll fit right in here at Amazon’s research and development team. We are a team of doers who work passionately to apply cutting edge advances in robotics, automation and software to solve real-world challenges to transform the Amazon customer experiences. We are seeking exceptional candidates who possess a blend of learning design and program management skills to successfully support new developing training programs for technologies within Amazon Fulfillment Centers. This job will require a unique combination of flexibility, creativity, leadership skills and contractor management. As part of this highly visible team, candidates have the opportunity to work cross-functionally with multiple engineering teams within Amazon to contribute to the continuous innovation of the next generation Fulfillment System. As a Program Manager for R&D Technical Training, you will be responsible for managing the development of training by vendors for the technology designed and tested by Amazon’s Advanced Technology team. You will work with Subject Matter Experts and vendors to assess the training needs for technology and design a curriculum to support the need. You will audit materials developed by vendors and the initial rounds of training delivered. The Program Manager will also collaborate closely with the rest of the AT Technical Training team as well as with internal customer training teams to design, pilot and deploy innovative training solutions, (Mobile and Station Based), which are scalable at a global level. Basic Qualifications: • BS/MS in adult learning and instructional design. Technical degree a plus. • At least 7 years of experience leading multiple mission critical technical projects simultaneously in a robotics engineering or other large scale technical implementation. • Ability to develop detailed project schedules coordinating multiple stakeholders to deliver products on time and within budget. • Strong background within the software and hardware engineering industries in order to align with team and vendor Subject matter experts. • Manage definition, collection and development of data driven reporting dashboards which can be displayed on one common platform. • Experience developing and rolling out onboarding and training programs for all positions in the department. • Willingness to travel 50% of the year. • Self-motivated, able to influence and solve problems independently and in team settings. • Proven experience to assess organizational learning and development needs. • Experience with learning management and knowledge base systems. • Experience in and key participation with process improvement projects. Ability to manage multiple training projects and/or programs. • Exceptional written and verbal communication skills. • Recognized as the subject matter expert and go to person for all learning needs. Preferred Qualifications: • Project Management Certification (PMP) and/or MBA. • Proven ability to multitask and prioritize critical tasks with a high attention to detail. • Experience driving execution of vision and goals for the team. • May develop long-term strategies and influenceleadership decisions. • Experience working with senior management and high-profile customer. • Experience with video-based eLearning and classroom instructional design and delivery. • Strong background within the software and hardware engineering industries. • Experience using Agile, SharePoint, Jira or Confluence. | ||
| Panel B: Example of a job posting with a low culture score | ||
|---|---|---|
| Firm: Amazon.com | Role: Reliability, Maintenance, and Engineering (RME) Technician | |
| Date: 2019-09-15 | Location: Fort Worth, TX | Culture score percentile: 4th |
| The Reliability, Maintenance, and Engineering (RME) is hiring for a Maintenance Technician. The Maintenance Technician will be responsible for assisting in the installation, maintenance, and repair of the automated packaging and distribution equipment. A successful candidate in this role will accomplish the following: • Perform preventive/predictive maintenance of conveyance equipment using the appropriate job plans, procedures, and manuals • Maintain and repair distribution center racking • Complete preventative maintenance routines, documentation and procedures • Track and store department inventory, including spare parts • Develop and maintain positive working relationships across all levels of the organization • Conduct maintenance and basic troubleshooting of robotics and robotic work cells • Troubleshoot electrical and mechanical problems related to all material handling equipment components • Maintain and troubleshoot motors, photo eyes, relays, proximity sensors, solenoids, motor starters, tachs, etc. • Assist in mentoring junior technicians by providing guidance and directions to help them develop their skill set • Assist with basic electronics/Programmable Logic Controls troubleshooting Physical Demands (Must be able to perform with or without reasonable accommodation): • Lift and move totes up to 49 pounds each • Regular bending, lifting, stretching and reaching both below the waist and above the head • Occasionally push and pull wheeled dollies loaded with products up to 100 pounds during site visits • Engage in full manual dexterity in both hands and wrists • Walking in the FC and around area with great frequency; facilities are over a quarter mile in length • Ability to climb ladders and gangways safely and without limitation • Dexterity in eye/hand coordination, feet (foot pedals), manual (picking, pinching, holding, grasping), and wrist motion (repetitive flexion/rotation) • Working conditions may include small spaces, dust, fumes/odors, hot/cold temperatures, inside/outside noise, vibration, standing on concrete for long hours and wet or uneven surfaces • Must be able to stand/walk for up to 10-12 hours Basic Qualifications • High school diploma or equivalent • Able to work all days and shifts, including overtime (24 hours a day, 7 days a week operation, including holidays) • PC competency, Word & Excel and Windows OS • Experience in the following areas: ◦ Automated conveyor systems and controls ◦ Repair of material handling equipment ◦ Predictive/Preventative maintenance tools and procedures ◦ Metal and wood fabrication ◦ Blueprint and electrical schematic reading ◦ Electrical and electronic principles Preferred Qualifications Degree from a vocational school or college with a focus in the Mechanical or Electrical field • 2+ years apprenticeship or equivalent experience in the Mechanical or Electrical field • Experience with Material Handling Equipment (MHE) safety standards accordance with Original Equipment Manufacturer (OEM) and Safety standards • Project Management experience • Experience with a Computerized Maintenance Management System (CMMS) • Experience with robotic operation/maintenance • Able to troubleshoot basic Input/Output functions Amazon.com is an Equal Opportunity Employer Minority/Women/Disability/Veteran/Gender Identity/Sexual Orientation/Age | ||
Appendix C. Detailed Procedure to Construct Culture Variables
In this appendix, we offer a detailed discussion on how we construct the expanded culture dictionaries and measure culture variables. We closely follow the methodology in Li et al. (2021) and use their codes (available at https://github.com/MS20190155/Measuring-Corporate-Culture-Using-Machine-Learning).
C.1. Using Word Embedding to Represent the Meaning of Words
To capture the complex and subtle meanings of words and phrases, we utilize word embedding through the Word2Vec model. This model quantifies the meaning of each word with a distinct numerical vector. For a straightforward illustration, take the words “King” and “Queen.” Although both signify royalty, they differ in gender. Imagine representing the meaning of each term with a three-dimensional vector encompassing attributes of humanity, rulership, and gender. In this framework, “King” might be vectorized as (1,1,1) and “Queen” as (1,1,0). Despite the one differing attribute, these two words would exhibit a high degree of similarity, with a cosine similarity of 0.82, signifying close relationship in the context of these dimensions.
C.2. Training the Word2Vec Model
Because of limited computing resources, training the model utilizing 100% of the job posting data was not feasible. Therefore, we randomly selected 50% of job postings each year, that is, a total of 12 million job postings, using the Pandas function. Following the GitHub code of Li et al. (2021), we employ CoreNLP for parsing job postings and utilize Gensim to identify phrases and train the Word2Vec model using the following hyperparameters (for parameters not specified below, the default values provided by Python’s Gensim library are used):
Threshold of the phraser module for forming the phrases: 10
Minimum number of times bigrams need to appear in the corpus to be considered as phrases: 10
Dimension of Word2Vec vectors: 300
Objective function: Continuous Bag of Words (CBOW)
Window size in Word2Vec training: 5
Minimum number of occurrences to be considered in the Word2Vec training process: 5
Number of iterations in Word2Vec training: 20
C.3. Generating Culture Dictionaries
We employ the trained Word2Vec model to create an expanded dictionary for assessing cultural values. We represent each cultural dimension—integrity, teamwork, innovation, respect, and quality—by averaging the vectors of the corresponding seed words, which are detailed in Table A.1, panel A. We then select the 500 words that exhibit the strongest association, that is, the highest cosine similarity, with each cultural value. For words that are included in more than one cultural value, we only retain the word in the dictionary of the value to which it has the greatest cosine similarity with the mean vector of its seed words. We manually review the dictionaries to remove words that are not relevant to the cultural value in our context (e.g., invest, matter, continue), too general (e.g., key, hard, want), or too specific (e.g., DNA, IT team).
C.4. Creating Culture Scores
We assess each cultural value in a job posting by calculating the tf-idf weighted frequency of words in its expanded dictionary, normalized by the job posting’s total word count. tf-idf reflects the term’s significance within a document and the term’s commonality across the entire corpus. Term frequency is computed as the count of a term t in document d, divided by the total term count in document d. Inverse document frequency of a term t is calculated as the logarithm of the quotient of the total document count over the number of documents containing the term t. For each cultural value, we then calculate its value for a unit of observation, for example, firm-MSA-quarter, by taking its mean in all job postings in the unit. Last, we calculate the composite score, Job Culture, by summing the five cultural values and standardizing it to a mean of zero and a standard deviation of one.
Appendix D. Variable Definitions
Table D.1 provides detailed definitions of the variables. The unit of observation is at the firm-MSA-quarter, firm-MSA-month, firm-MSA-quarter-occupation, firm-quarter, or job posting level.
|
Table D.1. Definitions of Variables
| Variables | Definitions |
|---|---|
| Variables from Lightcast | |
| Job Culture | The sum of the five culture scores across specific cultural dimensions, including Integrity, Teamwork, Innovation, Respect, and Quality, standardized to a mean of zero and a standard deviation of one. See Appendix C for the detailed procedure. |
| Education | The average education requirement (in number of years) of job postings. |
| Experience | The average experience requirement (in number of years) of job postings. |
| Length | The natural log of the average number of words in job postings. |
| Hiring Intensity | The natural log of the total number of job postings. |
| Skill Count | The average number of skills required in job postings. |
| Insurance | An indicator variable that takes the value of one if the job posting contains at least one keyword of insurance benefit, identified by phrases such as “health insurance,” “dental insurance,” and “comprehensive health coverage.” |
| Other Comp | An indicator variable that takes the value of one if the job posting contains at least one keyword of other monetary compensation including retirement benefit, identified by phrases such as “401(k),” “stock options,” and “equity compensation.” |
| Flexibility | An indicator variable that takes the value of one if the job posting contains at least one keyword of job flexibility benefit, identified by phrases such as “flexible schedule,” “remote work,” and “work from home.” |
| Salary Disclosed | The percentage of job postings with available salary information. |
| Advertised Mean Salary | The natural log of the average of the mean of minimum and maximum salaries. |
| Advertised Mean Salary (Expanded) | The natural log of the average of the mean of minimum and maximum salaries. If salary information is not explicitly provided in job postings, the average of the mean of minimum and maximum salaries provided in similar job postings is used. Similar job postings are defined as those from the same company, with the same SOC type, having the same level of seniority (i.e., the same number of years of work experience specified in job postings), located within the same MSA, and posted in the same quarter. If there are no similar job postings in this group, we relax the time period requirement to “the same year” or relax the location requirement to “the same state” (in this sequence) to find similar job postings. |
| Hiring Duration | The natural log of the average days between a job posting’s publication and expiration. |
| Creative Roles | An indicator variable for occupations with a two-digit SOC code of 27 (Arts, Design, Entertainment, Sports, and Media occupations). |
| Managerial Roles | An indicator variable for occupations with a two-digit SOC code of 11 (Management). |
| Sales Roles | An indicator variable for occupations with a two-digit SOC code of 41 (Sales). |
| Blue-Collar Roles | An indicator variable for occupations with two-digit SOC codes between 47 and 53. |
| Engineer Roles | An indicator variable for occupations with a two-digit SOC code of 17 (Architecture and Engineering). |
| No Education Requirement | An indicator variable for job postings that do not specify any education requirements. |
| No Experience Requirement | An indicator variable for job postings with no specific experience requirements. |
| Δ Hiring Intensity | The change in hiring intensity relative to the previous quarter. |
| Respect | The Respect culture scores of job postings, standardized to a mean of zero and a standard deviation of one. |
| Non-Respect Culture | The sum of the four culture scores across specific cultural dimensions, including Integrity, Teamwork, Innovation, and Quality, standardized to a mean of zero and a standard deviation of one. |
| Integrity | The Integrity culture scores of job postings, standardized to a mean of zero and a standard deviation of one. |
| Non-Integrity Culture | The sum of the four culture scores across specific cultural dimensions, including Teamwork, Innovation, Respect, and Quality, standardized to a mean of zero and a standard deviation of one. |
| Top Culture | An indicator variable that takes the value of one when Job Culture is in the top 30% of the firm-MSAs in that quarter, and zero otherwise. |
| Bottom Culture | An indicator variable that takes the value of one when Job Culture is in the bottom 30% of the firm-MSAs in that quarter, and zero otherwise. |
| AI Jargon | The average tf-idf scores for a set of AI-related keywords proposed by Baruffaldi et al. (2020), standardized to a mean of zero and a standard deviation of one. |
| Variables from Revelio | |
| Inflow | The level of employee inflows in a quarter scaled by the total number of employees at the beginning of the quarter, multiplied by 100. |
| Outflow | The average employee outflow over the subsequent four quarters (one year), with each quarter’s outflow scaled by the total number of employees at the beginning of that quarter and multiplied by 100. |
| Large Facility | An indicator variable that takes the value of one when the total number of employees for a firm-MSA-quarter is in the top 30% in that quarter, and zero otherwise. |
| Graduate | The share of new inflows with a graduate degree. |
| Undergraduate | The share of new inflows with an undergraduate degree. |
| Seniority | The average seniority level of employee inflows. Seniority ranges from 1 (most junior) to 7 (most senior). The measure is predicted by Revelio, which estimates seniority based on an employee’s job title, company, industry, age, prior seniority, and position history. |
| Unscaled Inflow | The unscaled level of employee inflows. |
| Inflow Scaled by Postings | The level of employee inflows in a quarter scaled by the total number of job postings in the previous quarter. |
| Variables from Glassdoor | |
| More Reviews | An indicator variable that takes the value of one if the count of current employee reviews on Glassdoor over the past year (including the current quarter) is in the top 30% of the firm-MSAs in that quarter, and zero otherwise. |
| High Helpfulness | An indicator variable that takes the value of one when the average number of helpfulness votes on reviews received over the past year (including the current quarter) is in the top 30% of the firm-MSAs in that quarter, and zero otherwise. |
| Glassdoor Culture | The average Glassdoor culture ratings for the firm-MSAs from current employees in that quarter. If not available, the average Glassdoor culture ratings for the firms from current employees in that quarter are used. |
| Dissatisfaction | An indicator variable that takes the value of one if Glassdoor culture ratings are in the bottom 30% of the firm-MSAs in that quarter, and zero otherwise. |
| Interview Culture | The percentage of interview reviews that explicitly mention the word “culture” or “cultural” in a firm-quarter. |
| Offer Rate | The share of interviews that result in a job offer in a firm-quarter. |
| Accept Rate | The percentage of interviewees that accept the offers if granted in a firm-quarter. |
| Other variables | |
| Unemployment | MSA-level unemployment rate. |
| ECall Culture | Culture scores based on the Q&A sections in conference calls, developed by Li et al. (2021), obtained from the authors of that study. |
| Website Culture | Culture scores based on corporate-level disclosure extracted from the historical “About Us” page of the corporate website. |
| Violation | The count of significant violations in each industry-quarter, where a violation is considered significant if its penalty falls within the top quartile of the cross-sectional distribution. |
| BLM | An indicator variable that takes the value of one for the six months after the BLM movement (2020 June–2020 November), and zero for the six months prior to BLM (2019 December–2020 May). |
| Size | The natural log of total assets. |
| ROA | Net income scaled by total assets. |
| Leverage | Total liabilities scaled by total assets. |
| MTB | Market value to book value ratio. |
| IntanRatio | Intangible assets scaled by total assets. |
Appendix E. Map of Units of Analysis
Table E.1 presents a map of units of analysis to the corresponding tables in the paper, along with a brief rationale for the use of alternative units of analysis.
|
Table E.1. Map of Units of Analysis
| Unit of observation | Tests using this specification | Notes |
|---|---|---|
| Main specification | ||
| Firm-MSA-quarter | Table 3; Table 4; Table 5, columns (2)–(5); Table 6; Table 7, columns (3)–(4); Table 9 | Primary unit of analysis |
| Other specifications | ||
| Job posting | Table 1, Table 2 | Job posting-level analyses are used for variance decomposition and for examining the determinants of disclosed culture for job postings. |
| Firm-MSA-quarter-occupation | Table 5, column (1) | Used in analyses that examine cross-sectional variation across occupation types. |
| Firm-MSA-month | Table 7, columns (1)–(2) | Used in an analysis with a one-year window that requires finer fixed effects. |
| Firm-quarter | Table 8 | Used in interview analyses, which do not include location information. |
1 Corporate culture represents the shared assumptions, values, and beliefs that inform employee behavior within a firm (Kreps 1990, Schein 1990, Crémer 1993, O’Reilly and Chatman 1996, Guiso et al. 2015b). Our focus is primarily on the core values communicated through job postings. We use the term “culture” and “core values” interchangeably.
2 Anecdotal evidence also suggests significant recruiting benefits for companies that promote culture in job postings (e.g., Johnson 2020).
3 For example, a job posting for a managerial position at corporate headquarters for a consumer-facing firm will likely highlight different values and norms than one for a position in the firm’s local stores.
4 For example, job review sites introduce search costs as they often require users to submit reviews through “give-to-get” models.
5 One notable exception is the work of Grennan (2020), who examines the performance implications of banks communicating their culture consistently across stakeholders.
6 The statistics can be found at https://kb.lightcast.io/en/articles/6957498-lightcast-data-basic-overview.
7 We use the code provided by Li et al. (2021), available at https://github.com/MS20190155/Measuring-Corporate-Culture-Using-Machine-Learning. In untabulated analyses, we find that our results are robust to using only seed words to measure corporate culture.
8 Because of limited computing resources, we randomly select 50% of job postings each year, that is, a total of 12 million job postings, as the training sample.
9 Our expanded dictionaries differ from those of Li et al. (2021), which are trained on earnings conference calls, suggesting that firms communicate culture differently in earnings conference calls and job postings.
10 To ensure that the data accurately represent the workforce, Revelio applies sampling weights to correct for potential biases that arise from differing likelihoods of posting professional data online among professions and locations. In addition, Revelio does not use job posting text to construct inflow and outflow measures, thus reducing any mechanical correlation between inflow and measures of job posting culture.
11 We examine county-level variation in these analyses because the county is the finest geographical unit in the job posting sample.
12 Job role variables are absorbed by firm-occupation fixed effects in these columns.
13 In an untabulated test, we explore whether a firm’s hierarchical structure impacts the degree of subcultural variation in cultural communication. We find that more decentralized or complex firms exhibit greater heterogeneity in the cultural values in their job postings.
14 We aggregate job postings in each firm-MSA-quarter to focus on hiring outcomes at the facility level. Unless otherwise specified, all subsequent tables employ the firm-MSA-quarter specification. See Appendix E for details of other aggregation levels we use and the reasons.
15 In an untabulated analysis, we use an entropy-balancing procedure to control for other differences between firm-MSA-quarters that provide more and less cultural information. We assign weights to each control observation to balance the distributions of key control variables between the treatment group (firms with Job Culture in the top 30% of the distribution) and the control group (all other firms). The control variables include employee culture ratings from Glassdoor, job and firm characteristics, and quarter and MSA fixed effects. Our main inferences remain unchanged.
16 In untabulated tests, our results are robust to alternative standard-error clustering schemes: (1) one-way clustering by firm; (2) one-way clustering by firm–MSA cell; (3) two-way clustering by firm–MSA cell and quarter; and (4) two-way clustering by firm and MSA.
17 We use the sample median to assess the economic magnitude, because the distribution of Inflow is highly skewed.
18 In untabulated tests, we find the coefficient on Job Culture to be insignificant when using Inflow in quarter t−1 as the dependent variable, alleviating concerns that firms might have already experienced increased inflows prior to the information being disclosed in job postings. We also find that the coefficients on Job Culture are insignificant when examining inflows during the quarters t + 3 and t + 4, suggesting that the effect of disclosed culture on inflows fades after two quarters.
19 For example, CNN notes that in 2019, only 8% of postings included wage information and that regulations in New York and Colorado have recently begun mandating salary disclosure to address this problem (Vasel 2022).
20 We define similar job postings as those within the same firm, occupation type, seniority, MSA, and quarter; if unavailable, we relax to the same year or state (in this sequence).
21 We obtain vacancy duration from Lightcast, the same data source as the job posting data. Note that only 36.7% of postings contain duration information, and among those, more than 20% report a duration of zero, and the remaining are capped at 60 days (Lightcast 2025).
22 Untabulated tests examining quarter-by-quarter outflows show that disclosed culture is associated with significantly lower employee outflows from the second through the fourth quarter.
23 Untabulated tests show that facilities with job postings featuring high disclosed culture scores are associated with higher current employee satisfaction in the forward one- to four-quarter horizons. Although we cannot identify reviews from new hires, this test is consistent with the notion that disclosed culture contributes to stronger cultural fit between employees and firms.
24 Because of the short sample window, we use a finer firm-MSA-month specification. Untabulated tests confirm that the results remain robust at the firm-MSA-quarter level.
25 The main effect on Respect is insignificant, indicating that during the short period preceding BLM, job seekers did not respond to respect-related cultural information in job postings. Nevertheless, untabulated results show a positive association between respect-related cultural information and inflows over the full sample. Because the BLM movement may have prompted firms to include boilerplate language related to diversity, equity, and inclusion, we separate Respect culture scores into boilerplate (Respect-Boilerplate) and nonboilerplate (Respect-No Boilerplate) language. We define boilerplate language as sentences that recur across postings from more than 10 facilities in either the pre- or post-BLM period. We find that only nonboilerplate Respect language is associated with higher employee inflows after BLM.
26 We first identify firms’ “About Us” page using a standardized Google query (e.g., Nvidia About Us). We then retrieve historical versions of these pages between 2010 and 2020 using Internet Archives’ Wayback Machine. This process yields 6,333 firm-year observations for 1,171 firms. We construct culture scores from the extracted text of these pages using the procedure described in Section 3.1. Untabulated tests show that, first, this webpage culture measure has little within-firm variation (≈80% explained by firm fixed effects), and, second, it does not explain Job Culture when included as an additional determinant in the model of Table 2.
27 The number of job postings is a noisy measure of labor demand for two reasons. First, firms often post the same vacancy multiple times, overstating demand. In our sample of observations with at least one employee inflow, the median inflow-to-job-posting ratio is only 0.04, consistent with repeated posts for a single position. Second, a single posting may cover multiple hires, understating demand (Carnevale et al. 2014, Chen and Li 2023). In our sample with at least one inflow, 5% yields at least two employees for a single job posting. However, the mismatch between the number of job postings and labor demand is not a concern for our disclosed culture measure, which captures the language communicated in job postings rather than labor demand.
References
- (2015) Are employee selection and incentive contracts complements or substitutes? J. Accounting Res. 53(4):633–668.Crossref, Google Scholar
- (2000) Economics and identity. Quart. J. Econom. 115(3):715–753.Crossref, Google Scholar
- (2005) Identity and the economics of organizations. J. Econom. Perspect. 19(1):9–32.Crossref, Google Scholar
- (2020) Losing prosociality in the quest for talent? Sorting, selection, and productivity in the delivery of public services. Amer. Econom. Rev. 110(5):1355–1394.Crossref, Google Scholar
- (2022) Occupational licensing and accountant quality: Evidence from the 150-hour rule. J. Accounting Res. 60(1):3–43.Crossref, Google Scholar
- (2020) Identifying and measuring developments in artificial intelligence: Making the impossible possible. OECD Science, Technology and Industry Working Papers, No. 2020/05, OECD Publishing, Paris.Google Scholar
- (2021) Human capital disclosure: What do companies say about their “most important asset”? Working paper, Rock Center for Corporate Governance at Stanford University, Stanford, CA.Google Scholar
- (2011) Identity, morals, and taboos: Beliefs as assets. Quart. J. Econom. 126(2):805–855.Crossref, Google Scholar
- (2015) Suspect CEOs, unethical culture, and corporate misbehavior. J. Financial Econom. 117(1):98–121.Crossref, Google Scholar
- (2003)
The role of subcultures in agile organizations . Peterson RS, Mannix EA, eds. Leading and Managing People in the Dynamic Organization (Psychology Press, Hove, UK), 87–112.Google Scholar - (2026) Company websites: A new measure of disclosure. J. Accounting Res. 64(1):81–125.Crossref, Google Scholar
- (2022) Human capital disclosures. Preprint, submitted September 24, https://doi.org/10.2139/ssrn.4138543.Google Scholar
- (2023) A job with a fair salary? What pay transparency laws are revealing. New York Times (June 20), https://www.nytimes.com/2023/06/20/business/job-search-salary-ranges.html.Google Scholar
- (2020) Black Lives Matter may be the largest movement in U.S. history. New York Times (July 3), https://www.nytimes.com/interactive/2020/07/03/us/george-floyd-protests-crowd-size.html.Google Scholar
- (2001)
Establishing the dimensions, sources and value of job seekers’ employer knowledge during recruitment . Ferris GR, ed. Research in Personnel and Human Resources Management, vol. 20 (Emerald Group Publishing Ltd., Leeds, UK), 115–163.Crossref, Google Scholar - (2023) Formalizing the informal: Adopting a formal culture-fit measurement system in the employee-selection process. Accounting Rev. 98(3):47–70.Crossref, Google Scholar
- (2012) Employee selection as a control system. J. Accounting Res. 50(4):931–966.Crossref, Google Scholar
- (2022) Tone at the bottom: Measuring corporate misconduct risk from the text of employee reviews. Management Sci. 68(9):7034–7053.Link, Google Scholar
- (2014) Understanding online job ads data. Technical report, Georgetown University Center on Education and the Workforce, Washington, DC.Google Scholar
- (1993) The role of culture compatibility in successful organizational marriage. Acad. Management Perspect. 7(2):57–70.Crossref, Google Scholar
- (2023) The gendering of job postings in the online recruitment process. Management Sci. 69(11):6912–6939.Link, Google Scholar
- (2010) The impact of organizational culture on attraction and recruitment of job applicants. J. Bus. Psych. 25(4):649–662.Crossref, Google Scholar
- (1991) Matching people and organizations: Selection and socialization in public accounting firms. Admin. Sci. Quart. 36(3):459–484.Crossref, Google Scholar
- (2019) How does online employee ratings affect external firm financing? Evidence from Glassdoor. Preprint, submitted December 16, https://doi.org/10.2139/ssrn.3507695.Google Scholar
- (2023) Is hiring fast a good sign? The informativeness of job vacancy duration for future firm profitability. Rev. Accounting Stud. 28(3):1316–1353.Crossref, Google Scholar
- (2023) Do jobseekers value diversity information? Evidence from a field experiment and human capital disclosures. J. Accounting Res. 61(3):695–735.Crossref, Google Scholar
- (2004) Exploring applicant pool quantity and quality: The effects of early recruitment practice strategies, corporate advertising, and firm reputation. Personnel Psych. 57(3):685–717.Crossref, Google Scholar
- (1993) Corporate culture and shared knowledge. Indust. Corporate Change 2(1):351–386.Crossref, Google Scholar
- (2009) Persistence in firm policies, firm origin, and corporate culture: Evidence from corporate spin-offs. EFA 2007 Ljubljana Meetings Paper Second Singapore Internat. Conf. Finance 2007-1, Singapore.Google Scholar
- (2015) Executives’ “off-the-job” behavior, corporate culture, and financial reporting risk. J. Financial Econom. 117(1):5–28.Crossref, Google Scholar
- (2023) Financial reporting and employee job search. J. Accounting Res. 61(2):571–617.Crossref, Google Scholar
- (2020) Who should select new employees, headquarters or the unit manager? Consequences of centralizing hiring at a retail chain. Accounting Rev. 95(4):173–198.Crossref, Google Scholar
- (2022) Corporate human capital disclosures: Early evidence from the SEC’s disclosure mandate. Preprint, submitted July 15, https://doi.org/10.2139/ssrn.4153845.Google Scholar
- (2020) CEO behavioral integrity, auditor responses, and firm outcomes. Accounting Rev. 95(2):61–88.Crossref, Google Scholar
- (2021) The disciplinary effect of social media: Evidence from firms’ responses to Glassdoor reviews. J. Accounting Res. 59(5):1783–1825.Crossref, Google Scholar
- (2020) Culture rivals pay, some job seekers say. HR Dive (July 31), https://www.hrdive.com/news/culture-rivals-pay-some-job-seekers-say/.Google Scholar
- (2022) Accounting for employment impact at scale. Harvard Business School Accounting & Management Unit Working Paper No. 22-018, Harvard Business School, Boston.Google Scholar
- (2012) This time is the same: Using bank performance in 1998 to explain bank performance during the recent financial crisis. J. Finance 67(6):2139–2185.Crossref, Google Scholar
- (2020) Caught in the act: How corporate scandals hurt employees. Preprint, submitted June 30, https://doi.org/10.2139/ssrn.3638358.Google Scholar
- (2021) Who captures the value from organizational culture? Evidence from Glassdoor reviews and the universe of online job postings from Burning Glass Technologies. Preprint, submitted October 11, https://doi.org/10.2139/ssrn.3940423.Google Scholar
Glassdoor (2018) Glassdoor study reveals what job seekers are looking for. Glassdoor Blog (July 25), https://www.glassdoor.com/blog/salary-benefits-survey/.Google Scholar- (2022) Corporate culture: Evidence from the field. J. Financial Econom. 146(2):552–593.Crossref, Google Scholar
- (2019) Crowdsourced employer reviews and stock returns. J. Financial Econom. 134(1):236–251.Crossref, Google Scholar
- (2019) A corporate culture channel: How increased shareholder governance reduces firm value. Preprint, submitted March 29, https://doi.org/10.2139/ssrn.2345384.Google Scholar
- (2020) Communicating culture consistently: Evidence from banks. Preprint, submitted January 16, https://doi.org/10.2139/ssrn.3350645.Google Scholar
- (2008) Social capital as good culture. J. Eur. Econom. Assoc. 6(2):295–320.Crossref, Google Scholar
- (2015a) Corporate culture, societal culture, and institutions. Amer. Econom. Rev. 105(5):336–339.Crossref, Google Scholar
- (2015b) The value of corporate culture. J. Financial Econom. 117(1):60–76.Crossref, Google Scholar
- (2018) A new era of voluntary disclosure? Empirical evidence on how employee postings on social media relate to future corporate disclosures. Accounting Organ. Soc. 68–69(1):88–108.Crossref, Google Scholar
- (2018) Wage dispersion and search behavior: The importance of nonwage job values. J. Political Econom. 126(4):1594–1637.Crossref, Google Scholar
- (2025) Auditor skill demands and audit quality: Evidence from job postings. Management Sci. 71(7):5805–5829.Link, Google Scholar
- (2022) Behavioral economics of accounting: A review of archival research on individual decision makers. Contemporary Accounting Res. 39(2):1150–1214.Crossref, Google Scholar
- (2024) The price of an accountant shortage: Evidence from job vacancy duration and internal control weaknesses. Preprint, submitted January 15, https://doi.org/10.2139/ssrn.4695588.Google Scholar
- (2014) Creative synthesis: Exploring the process of extraordinary group creativity. Acad. Management Rev. 39(3):324–343.Crossref, Google Scholar
- (2019) Toward an understanding of corporate social responsibility: Theory and field experimental evidence. NBER Working Paper No. 26222, National Bureau of Economic Research, Cambridge, MA.Google Scholar
- (1998) Identifying organizational subcultures: An empirical approach. J. Management Stud. 35(1):1–12.Crossref, Google Scholar
- (2020) What do employees know? Evidence from a social media platform. Accounting Rev. 95(2):199–226.Crossref, Google Scholar
- (2019) Corporate culture as an implicit contract. Preprint, submitted July 24, https://doi.org/10.2139/ssrn.3426060.Google Scholar
- (2020) Write a job description that attracts the right candidate. Harvard Bus. Rev. (March 30), https://hbr.org/2020/03/write-a-job-description-that-attracts-the-right-candidate.Google Scholar
- (1983) Transaction costs, property rights, and organizational culture: An exchange perspective. Admin. Sci. Quart. 28(3):454–467.Crossref, Google Scholar
- (2018) What can we learn from online wage postings? Evidence from Glassdoor. Econom. Quart. 104(1):173–189.Google Scholar
- (2023) How many applications does it take to get a job? Zippia.com (February 6), https://www.zippia.com/advice/how-many-applications-does-it-take-to-get-a-job/.Google Scholar
- (1990)
Corporate culture and economic theory . Alt JE, Shepsle KA, eds. Perspectives on Positive Political Economy (Cambridge University Press, Cambridge, UK), 90–143.Crossref, Google Scholar - (1996) Person-organization fit: An integrative review of its conceptualizations, measurement, and implications. Personnel Psych. 49(1):1–49.Crossref, Google Scholar
- (2021) Measuring corporate culture using machine learning. Rev. Financial Stud. 34(7):3265–3315.Crossref, Google Scholar
- (2025) Dissecting corporate culture using generative AI—Insights from analyst reports. Preprint, submitted September 23, https://doi.org/10.2139/ssrn.4558295.Google Scholar
- (2003) The relation of instrumental and symbolic attributes to a company’s attractiveness as an employer. Personnel Psych. 56(1):75–102.Crossref, Google Scholar
Lightcast (2025) Job posting analytics (JPA) methodology. Lightcast, https://kb.lightcast.io/en/articles/6957446-job-posting-analytics-jpa-methodology.Google Scholar- (2016) Corruption culture and corporate misconduct. J. Financial Econom. 122(2):307–327.Crossref, Google Scholar
- (2022) How much do others make for the same job? Here’s where employers are required by law to share salary ranges when hiring. CNBC (January 12), https://www.cnbc.com/2022/01/12/states-and-cities-where-employers-must-share-salary-ranges-when-hiring.html.Google Scholar
- (2019) Estimating the effect of a fit-focused employee selection program. J. Management Accounting Res. 31(2):159–175.Crossref, Google Scholar
- (2023) The value of working conditions in the United States and implications for the structure of wages. Amer. Econom. Rev. 113(7):2007–2047.Crossref, Google Scholar
- (2021) Incentives can reduce bias in online employer reviews. J. Experiment. Psych. Appl. 27(2):393–407.Crossref, Google Scholar
- (2017) Valuing alternative work arrangements. Amer. Econom. Rev. 107(12):3722–3759.Crossref, Google Scholar
- (2022) COVID-19 human capital management response, SEC disclosure and firm value. Preprint, submitted February 8, https://doi.org/10.2139/ssrn.4010151.Google Scholar
- (2020) Cultural diversity on Wall Street: Evidence from consensus earnings forecasts. J. Accounting Econom. 70(1):101330.Crossref, Google Scholar
- (2013) Distributed representations of words and phrases and their compositionality. Burges CJC, Bottou L, Welling M, Ghahramani Z, Weinberger KQ, eds. Adv. Neural Inform. Processing Systems 26 (Curran Associates, Inc., Red Hook, NY), 3111–3119.Google Scholar
- (2020) Before you apply, spend more time and analyze the job posting. Career Sherpa (May 21), https://careersherpa.net/analyze-job-posting/.Google Scholar
- (1996) Culture as social control: Corporations, cults, and commitment. Res. Organ. Behav. 18(1):157–200.Google Scholar
- (2019) Corporate culture and analyst catering. J. Accounting Econom. 67(1):120–143.Crossref, Google Scholar
- (2017) Corporate risk culture. J. Financial Quant. Anal. 52(6):2327–2367.Crossref, Google Scholar
- (1951) Some thoughts on the distribution of earnings. Oxford Econom. Papers 3(2):135–146.Crossref, Google Scholar
- (1992) Culture and subcultures: An analysis of organizational knowledge. Admin. Sci. Quart. 37(1):140–161.Crossref, Google Scholar
- (1990) Organizational culture. Amer. Psych. 45(2):109–119.Crossref, Google Scholar
- (1992) Organizational culture and employee retention. Acad. Management J. 35(5):1036–1056.Crossref, Google Scholar
- (2025) Disclosing labor demand: Evidence from online job postings. Accounting Rev. 100(5):345–374.Crossref, Google Scholar
- (2023) Advertised US salary ranges are widening in some areas. Hiring Lab (May 18), https://www.hiringlab.org/2023/05/18/advertised-salary-ranges/.Google Scholar
- (1961) The economics of information. J. Political Econom. 69(3):213–225.Crossref, Google Scholar
- (2020) When it comes to culture, does your company walk the talk? MIT Sloan Management Rev. (July 21), https://sloanreview.mit.edu/article/when-it-comes-to-culture-does-your-company-walk-the-talk/.Google Scholar
- (2014) Search and nonwage job characteristics. J. Human Resources 49(2):472–507.Google Scholar
- (2017) Employee selection practices and performance pay. Preprint, submitted September 18, https://doi.org/10.2139/ssrn.2481074.Google Scholar
- (2005) Organizational beliefs and managerial vision. J. Law Econom. Organ. 21(1):256–283.Crossref, Google Scholar
- (2022) Here’s what happens when salary is actually included in job listings. CNN (February 9), https://www.cnn.com/2022/02/09/success/salary-ranges-pay-transparency/index.html.Google Scholar
- (2012) Traction: Get a Grip on Your Business (BenBella Books, Inc., Dallas).Google Scholar
- (1993) Toward a theory of organizational creativity. Acad. Management Rev. 18(2):293–321.Crossref, Google Scholar

