Is One Plus One Always Two? Insuring Longevity Risk While Having Multiple Savings Accounts
Abstract
We investigate the consequences of holding multiple accounts for payout decisions at retirement. Using proprietary data of retirees’ annuitization decisions, we find that small accounts are more likely to be cashed out. We use occupation information as a proxy for wealth to disentangle income from the multiple-accounts effect. We show that individuals with high expected wages are more likely to annuitize overall but less likely to annuitize their small accounts (comparing to individuals with low wages). A laboratory experiment and an online experimental survey (with a large representative sample) suggest that the composition of multiple accounts affects the annuitization rates via the decisions regarding small versus large accounts.
This paper was accepted by Camelia Kuhnen, finance.
Funding: This work was supported by the Albertson-Waltuch Chair in Business Administration, the Kruger Center at the Hebrew University, the Think Forward Initiative, and the German-Israeli Foundation for Scientific Research and Development and by funding from the Center for Agriculture, Environment and Natural Resource.
Supplemental Material: The data files are available at https://doi.org/10.1287/mnsc.2022.02489.
1. Introduction
Individuals upon retirement need to decide how to withdraw their savings—how much of it to invest in an annuity (insuring them against longevity risk) and how much to cash out as a lump sum. Their goals are to avoid exhausting their assets too soon and to be able to face potential future liquidity shocks while taking into account potential frictions in the market and bequest motives. This complicated decision made by individuals at an older age can have significant consequences for their well-being during their retirement period (Mitchell et al. 1999, Brown and Warshawsky 2001). Given both its complexity and importance, there is a growing academic and policy interest in this dilemma (Brown et al. 2008, 2021; Benartzi et al. 2011).
Many individuals in different countries save for retirement via multiple different products and providers and hence may hold more than one single savings account. For example, in the United States, Holden et al. (2021) find half a million multiple accounts held by single participants out of a sample of 14.6 million 401(k) plan participants. In Australia, as of 2020, approximately 4 million people were reported to maintain two or more pension accounts.1 There are several potential explanations for the existence of multiple accounts, including (1) a desire to diversify among investments managers, (2) tax considerations, (3) work instability that is affecting savings managed by employers,2 and (4) engagement in nonstandard work arrangements (such as the gig economy), among others.
Given that it is reasonable to assume that the above-mentioned factors are expected to remain and influence individuals savings’ portfolios, there is a clear need to better understand the effect of holding multiple accounts not only on savings and asset allocation decisions, but also on payout choices at retirement. Yet, there is relatively little empirical evidence on this issue. This study aims to fill this gap.
Taking into consideration past findings, we first replicate the documented result of a positive association between the savings amounts and the likelihood of it being annuitized (Bütler and Teppa 2007, Benartzi et al. 2011, Hagen 2015). Next, we address the possible reasoning for these empirical findings. We focus on the following not mutually exclusive mechanisms explaining this result. First, differences in individuals’ wealth (proxied by income; Jäntti et al. 2015, Martínez 2022) are known to affect the demand for insurance (Eisenhauer and Halek 1999, Gollier 2003, Koijen et al. 2016, Fang and Kung 2021, Gropper and Kuhnen 2021). Such differences are also reflected in the size of individuals’ accounts (hereafter referred to as the income effect). The second mechanism is related to diversification (via multiple products and accounts). That is, the distribution of funds across accounts per se is responsible for the tendency to cash out small accounts (henceforth referred to as the diversification effect). This diversification effect could be driven by an “illusion of wealth” (Goldstein et al. 2016) and by “mental accounting” (Thaler 1985, 1999; Shefrin and Thaler 1988; Loewenstein and Thaler 1989). Finally, the size of an individual’s account and likelihood of it being annuitized could also be explained by the individual’s time preferences effect (O’Donoghue and Rabin 1999b, Angeletos et al. 2001, Bütler and Teppa 2007, Benartzi et al. 2011, Cronqvist and Siegel 2015, Schreiber and Weber 2016, Hurwitz and Sade 2020).
Our empirical investigation relies on a unique and very detailed proprietary data set from a leading insurance company in Israel, which includes information regarding the annuitization decisions of retirees and a rich set of parameters describing these individuals.3 Our sample consists of 15,293 retirees’ choices during the years 2009–2013. We begin by documenting a correlation between the size of the accumulated funds and the decision to annuitize. In particular, retirees with small accounts in our data set were much more likely to elect the (full) lump-sum option, even when excluding negligible amounts.4 Because these data were obtained from one insurance provider, we lack the ability to determine which individuals sampled have additional accounts with other insurance companies or pension providers. Based on the assumption that most individuals in Israel save a constant percentage of their wage for pension (to match the employer contribution), our empirical strategy uses information about profession. Given that the data set contains occupation information for each individual,5 we screen the sample according to very high versus very low expected income occupations, hypothesizing that high expected income observations should be associated with higher total long-term savings (which may be divided across providers or products). Accordingly, the presence of a small account among individuals with anticipated high income in our study implies that this account probably constitutes just a fraction of their diversified portfolio. Conversely, very low expected income observations are anticipated to be associated with lower overall savings. The results of our analysis suggest that, although high expected income individuals are indeed more likely to annuitize, they are less likely to annuitize their small amounts. We control for other related personal characteristics, and this result remains. Furthermore, we use propensity score matching on socioeconomic attributes (the only difference being the amount accumulated) to pair selected individuals. Again, the smaller accounts have a higher propensity to be distributed as lump sums.
To further investigate the consequences of holding multiple accounts on the entire portfolio and to provide additional robustness to our previous results obtained from the administrative data, we conducted three experiments: (1) an incentivized experiment in the laboratory; (2) an online experimental survey; and (3) an experimental survey of financial experts.6 The experimental framework not only allows us to overcome some of the data limitations (specifically the lack of information regarding savers’ entire portfolios), but also enables us to elicit preferences for annuitization in various controlled allocations of the accumulated funds. Furthermore, it enables us to examine the choice in an environment free of logistical frictions that could potentially influence some of the results obtained from the analysis of the administrative data.
We first built on the design of Hurwitz et al. (2020) and conducted a laboratory experiment aimed at capturing the essence of the annuitization decision by incorporating uncertainties regarding both longevity risk and future consumption, as well as bequest motives considerations.7 Participants (n = 135) in the experiment (students) were randomly assigned to either one- or two-account conditions and were asked to divide a sum saved for retirement between a life annuity and a lump sum. We find that there are significant differences between the two conditions. With respect to the total savings, individuals decide to annuitize a larger portion when presented with funds that are distributed across two accounts, and consistent with the results obtained from the administrative data, the small accounts are less likely to be annuitized.
In addition, we designed and conducted an online experimental survey, allowing us to approach a larger and more diversified sample (including nontraditional participants from older age groups) and release some of the restrictions regarding consumption expectations and life expectancy that are embedded in the design of the laboratory experiment. In this online experimental survey, we only randomized the size distribution of the accounts. The participants were asked again to divide a total sum of money that was saved for retirement between a monthly annuity and a lump sum. A total of 1,971 participants were randomly assigned to one of five conditions, with various distributions of the same amount across two accounts (or one account in the control treatment). We find that the likelihood of annuitizing the larger of the two accounts is similar (around 70%) in all treatments, yet the participants are less likely to annuitize the small account. Moreover, the smaller the “small” account is, the more likely it is to be cashed out.
Finally, to obtain additional insight of our results, we also conducted a similar experimental survey (with only two treatments) among financial professionals well trained in thinking about such problems (executives at an insurance company and finance professors).8 In this experiment, we do not find a significant difference between the two conditions, which suggests that some of the obtained results are related to literacy and experience. In sum, our results support the hypotheses that differences in the size composition of pension accounts have an effect on annuity choices, not only due to an income effect but also due to the diversification effect per se.
Our investigations have additional important implications for insurance corporations’ asset and liability management (ALM) strategies. The academic literature focuses on different considerations affecting the ALM of long-term-savings managers. These include actuarial considerations such as retirement age, job discharges, and mortality rates that in turn can influence the expected duration of the future cash flow series (Bauer et al. 2006). Furthermore, assumptions about the likelihood of individuals choosing the annuity option are also part of the ALM calculations (Blome et al. 2008). We add to this literature by showing that the composition of managed accounts (in terms of size) should be considered.
The paper is structured as follows: we first describe previous related literature in Section 2, followed by a review of the setting in which our investigation takes place in Section 3. In Section 4, we present the data. Thereafter in Section 5, we describe our empirical methodology and report the results of our analyses followed by various robustness tests. A description of the design and results of the laboratory experiment, the additional online experimental survey using a representative sample of the population, and the robustness test with a sample of financial professionals appears in Section 6. Section 7 concludes with a brief discussion.
2. Literature Review and Working Hypotheses
In this section, we first review the related literature concerning the “annuity puzzle.” Next, we describe past studies investigating insurance choices, wealth, and time preferences. Last, we highlight relevant literature about diversification. Accordingly, in each section, we construct our related hypotheses.
2.1. Annuity Puzzle
Acknowledging the importance of payout decisions at retirement, a vast academic literature focuses on analyzing different aspect of these choices. In a seminal paper, Yaari (1965) predicts that upon retirement, a rational, risk-averse individual with no bequest preferences and fairly priced annuities will gain from purchasing annuities. This is mainly owing to the advantage of insuring against longevity risk. The evidence that retirees seem not to follow this advice is the so-called annuity puzzle and is the subject of a substantial empirical literature and academic investigations of data from several countries (Ganegoda and Bateman 2008, Pashchenko 2013, Beshears et al. 2014, Reichling and Smetters 2015). Various studies attempt to explain this gap between the theory and the empirical findings. The arguments vary from frictions and product features to asymmetric information (Finkelstein and Poterba 2004, Cutler et al. 2008, Rothschild 2009, McCarthy and Mitchell 2010, Hagen 2015). There is also a growing body of literature that focuses on customer characteristics and attitudes (socioeconomic or behavioral), including the complexity of the decision (Brown et al. 2016, 2017), default biases (Bütler and Teppa 2007, Agnew et al. 2008), difficulty in making irreversible decisions (Brown and Warshawsky 2001), biases related to framing (Benartzi et al. 2011, Beshears et al. 2014, Goldstein et al. 2016), difficulty parting with accumulated money (Benartzi et al. 2011), availability errors (Hu and Scott 2007), uncertainty and misperception about life expectancy (Smith et al. 2001, Hurwitz and Sade 2020, Hurwitz et al. 2022), and mental accounting (Hu and Scott 2007, Brown et al. 2008, Benartzi et al. 2011).
2.2. Wealth Effect, Size Effect, and Time Preferences
In addition to the vast literature that investigates the annuity puzzle, there is a recent growing literature focusing on understanding the interrelationship of wealth and insurance choices with respect to different types of insurance products. Various theoretical studies predict a negative correlation between wealth and insurance (Gollier 2003, Koijen et al. 2016). This argument stems from the fact that insurance products typically come with a load that in turn increases the attractiveness of self-insurance for those able to afford it (in our context, in the form of savings). According to this theory, wealth should be negatively correlated with the propensity to annuitize (longevity insurance). Yet, established empirical evidence challenges this assumption. Eisenhauer and Halek (1999) and Fang and Kung (2021) demonstrate a positive association between wealth and insurance with respect to life insurance, and Gropper and Kuhnen (2021) document this positive correlation using a large administrative data set covering multiple insurance types.
Although the overall wealth of individuals is hard to estimate empirically, account sizes are often known. Few previous studies emphasize a size effect of savings accounts with respect to withdrawal decisions. That is, they find that small accumulations are more likely to be cashed out (Bütler and Teppa 2007, Benartzi et al. 2011, Hagen 2015). Hence, our first hypothesis stems from these findings as follows.
There is a positive correlation between account size and the likelihood that it will be annuitized.
Whereas Benartzi et al. (2011) posit that people simply consider small accumulations to be insufficient to annuitize, Bütler and Teppa (2007) relate their findings to income and time preferences and suggest that this size effect stems from the availability of means-tested income and from differences in discount rates. In line with Jäntti et al. (2015) and Martínez (2022), who find a positive dependence between wealth and income, we use income as a proxy for wealth and derive our next hypothesis.
Income (as a proxy for wealth) is positively associated with the propensity to annuitize (demand for insurance).
An additional important factor that can potentially affect the size of savings accounts and the annuitization decision is individuals’ time preferences. The time preferences argument suggests that impatient individuals will save less and hence will retire with smaller savings accounts (O’Donoghue and Rabin 1999b, Angeletos et al. 2001, Cronqvist and Siegel 2015). Time-inconsistent preferences could also have a direct effect on annuitization choices (Bütler and Teppa 2007, Benartzi et al. 2011, Schreiber and Weber 2016, Hurwitz and Sade 2020). There are multiple proxies accepted in the literature for time preferences such as the ability to resist junk food (Lawless et al. 2013), one’s financial planning horizon (Khwaja et al. 2006, Adams and Nettle 2009, Brown and Van der Pol 2015), and drinking and smoking (Fuchs 1980, DellaVigna and Paserman 2005, Hurwitz and Sade 2020). This leads to our next hypotheses.
Time-preferences proxies are associated with the size of the account.
Time-preferences proxies are negatively associated with the propensity to annuitize (demand for insurance).
Considering the modern dynamic workplace and the increased sophistication of financial products available to savers and the previous documentation in the literature, we hypothesize that there are additional not mutually exclusive possible channels, beyond wealth, that consequently will cause individuals to retire with a small (large) account managed by a particular pension savings provider or multiple providers (e.g., diversification, taxes, laws, or other frictions). As a result, an individual may have multiple savings accounts managed by multiple providers and hence a particular provider will manage only a fraction of that person’s wealth. Nevertheless, based on the current understanding of theoretical models, wealth, and savings are typically treated as aggregated values (Yaari 1965, Kotlikoff and Spivak 1981, Davidoff et al. 2005, Lockwood 2012). That is, the optimization process of an agent is solely based on the aggregated value of wealth (W0), regardless of whether individuals hold multiple accounts (for example, and ). For instance, according to the framework presented by Kotlikoff and Spivak (1981), in the individual’s consumption choice problem, the objective is to maximize expected lifetime utility denoted by EU from consumption while adhering to a budget constraint. The problem can be expressed as follows:
We argue that the optimization problem remains unchanged. That is, for a rational individual, ignoring frictions, the objective would still be to maximize expected utility from consumption, subject to the budget constraint, regardless of how the initial wealth is distributed across multiple accounts.
2.3. Diversification Effect
Given the above, we now hypothesize that for a not fully rational agent, the existence of multiple accounts may affect annuitization decisions. This further effect could be a result of an “illusion of wealth” (Goldstein et al. 2016) by which annuities seem more attractive the larger the amount at stake. This argument is based on the idea that the format of information presented to individuals plays a role in their decision possibly due to reference-dependent utility (Hardie et al. 1993), according to which people experience a decrease in value if moving below a certain reference point. In the annuitization context, a natural reference point when valuing life annuities are the current consumption levels that are only comparable to monthly annuities and are not a relevant reference for a lump sum, resulting a reduced attractiveness of small monthly annuities (Goldstein et al. 2016).
The association between diversification and annuitization choices could also stem from mental accounting (Thaler 1985), which suggests that individuals use a set of cognitive actions when they perform financial activities. This explanation rests on the idea that people tend to treat financial outcomes in different ways related to distinct decision heuristics and biases (Thaler 1985, 1999). Much attention in the literature has been given to three components of mental accounting (Thaler 1999): (1) how outcomes are perceived and evaluated (particularly for risky outcomes), (2) how activities are assigned to specific mental accounts, and (3) how frequently accounts are re-evaluated. Past studies suggest that both sources and uses of funds are labeled in the mental accounting system. Specifically, Shefrin and Thaler (1988) suggest that accounts are rated by households according to how tempting it is to spend them; hence, they predict that transferring funds to less tempting mental accounts could help households save more. Moreover, Thaler (1990) suggests that, in contrast to larger gains, smaller gains are coded as current income and hence spent rather than saved.
We contribute to this literature by testing whether holding multiple savings accounts where at least one account is small (i.e., the distribution of funds across savings accounts is unequal) affects the overall annuitization rates, hypothesizing based on the mental accounting literature that individuals will treat unequal accounts differently. Furthermore, in line with the time preferences argument described above, Loewenstein and Thaler (1989) determine that subjective discount rates for small amounts are high compared with discount rates for larger amounts. Based on this literature, we expand the discussion by enabling multiple accounts and accumulations and derive our next hypotheses.
For individuals holding multiple savings accounts, annuitization rates differ for different sizes of accounts.
For individuals holding multiple savings accounts, there is a positive correlation between account size and likelihood of annuitizing the account.
3. Setting: Structure of the Israeli Pension System
The Israeli pension system comprises a public and a private layer. The private layer consists of five types of long-term-savings products: (a) “old” pension funds,9 (b) “new” pension funds,10 (c) “new” general pension funds, (d) pension insurance policies,11 and (e) provident funds.12 The focus of this project is on choices in the private layer that are related to pension insurance policies.13 These products, some of which provide the saver with tax benefits and many of which are part of common compensation agreements, are managed by insurance companies that provide both operational management and investment of the funds. Typically, in Israel, the institution managing the funds during the saving phase will also provide an annuity upon retirement.
Owing to historical differences in tax incentives, employees have tended to save using either a pension fund or a pension insurance policy (these policies were usually offered to higher wage employees), whereas self-employed individuals routinely saved using provident funds or pension insurance policies. Moreover, the choice of a savings products differed across industries and was influenced by whether one belonged to a union.
Israel is an interesting setting for this study because individuals can and tend to diversify their long-term savings through several plans and products. This can be done simultaneously or over time, actively or passively. For example, one could experience a change in the available long-term-savings products following a job change if the new employer is associated with different providers. Hence, a typical retiree who changes jobs every few years will most likely have more than one pension (or insurance policy) account.
4. Data
The study uses proprietary data about Israeli retirees from a major insurance corporation.14 The data contain information about the chosen withdrawals for 15,293 individuals who retired between 2009 and 2013, and rich additional information about each individual.15 These detailed data provide us with an opportunity to learn how the size and distribution of accounts are related to payout choices.
Table 1 summarizes the information regarding the retirees in our sample and their annuitization choices. The amount of accumulated funds varies widely: The mean accumulated amount is NIS 173,000,16 and the median is NIS 65,000.17 Figure 1 shows that more than half of the retirees in our sample saved an amount that is lower than NIS 100,000.
|

Table 1. Descriptive Statistics
| N | Mean/proportion | Standard deviation | |
|---|---|---|---|
| Accumulated funds (NIS) | 15,293 | 173,742.29 | 327,496.10 |
| Retirement age (yr) | 15,293 | 65.93 | 3.94 |
| Male | 15,293 | 0.48 | 0.50 |
| Divorced | 15,293 | 0.09 | 0.29 |
| Widower | 15,293 | 0.05 | 0.21 |
| Married | 15,293 | 0.57 | 0.49 |
| Retirees choosing annuity | 15,293 | 0.27 | 0.44 |
Notes. Accumulated funds refers to the total funds accumulated by each retiree. Retirees choosing annuity are retirees who chose any portion of disbursement as an annuity. NIS, New Israeli shekels.
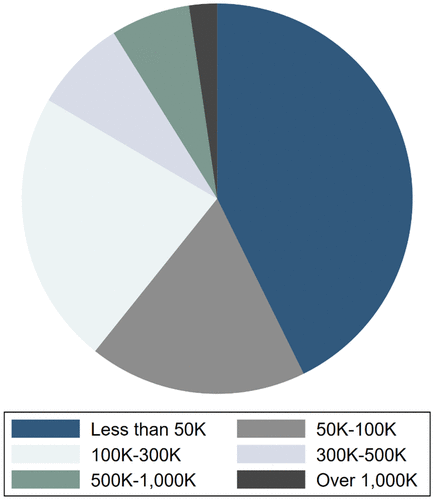
Notes. The number of clients in our sample declines with the increase in accumulated funds (over all the accounts). Amounts are in new Israeli shekels (NIS). The exchange rate at the time of the investigation was about NIS 3.5 = USD 1.
The mean retirement age is 65.9 years, and 48% of the retirees are male; the majority of retirees are married (57.1%). At retirement, each client can choose a withdrawal of a lump sum, an annuity, or both,18 subject to the minimal mandatory annuity law (applying only to funds accumulated after 2008).19 The mean conversion factor, which determines the price of the annuities for those choosing to annuitize, is 13.46 in yearly terms.20
5. Empirical Methodology and Results
5.1. Empirical Methodology
We first test Hypothesis 1, which posits a positive correlation between account size and annuitizaiton choices, previously demonstrated by Bütler and Teppa (2007) and Benartzi et al. (2011), by exploiting our unique data set. To do so, we analyze the monetary accumulated fund amount (in NIS), as well as dummy variables for several size thresholds21 while controlling for other relevant variables as discussed in Section 5.2.1.
In our second step (Section 5.2.2), we wish to test Hypothesis 2 that posits a positive correlation between income and annuitization. Testing this hypothesis is challenging for several reasons. First, although the data obtained from the insurance company are detailed, the insurance company does not keep records of individuals’ wage information. Second, we observe pension accounts from only one insurance corporation. Hence, we cannot rule out the possibility that a particular small savings account is merely a part of an individual’s larger portfolio. To overcome these limitations, we use the individuals’ occupation information provided by the insurance company. Some occupations are clearly associated with relatively high salaries (e.g., management position in a high-tech company), some are not easily characterized with either high or low salary, and others are clearly characterized by low salaries (e.g., childcare provider). Hence, we focus on only those occupations that can clearly be characterized as either high or low wage. To this end, we created a subsample of the data consisting of individuals at the two extremes. Given the above-mentioned characteristics of the employment and savings markets in Israel, for the relatively high-wage occupations,22 we would expect to find overall comparatively large accumulated savings amounts at retirement.23 For this subsample, observing a small account would imply that it is indeed only a part of their portfolio. Conversely, for the subsample of individuals with relatively low-wage occupations, we would expect to find relatively low overall accumulated funds; accordingly, having a small account would likely relate to an income (as a proxy for wealth) effect rather than diversification. This argument relies on the fact that the common practice in Israel during the investigation period was for employees to save a percentage of their salaries, matched by their employers. Accordingly, an individual working in a high-wage occupation is expected to save more. Furthermore, saving for a pension entitles individuals to a substantial tax benefit. Together, this makes it a suitable environment for our investigation. As it is common in Israel to save a constant percentage of the wage, we do not expect to find evidence in our data for Hypotheses 3 and 4 (discount rates),24 but given the important role of time preferences in the academic literature we explicitly test it and provide additional analysis in Section 5.2.3.
Finally, we wish to test our conjectures regarding the diversification effect (Hypotheses 5 and 6). Because we cannot rule out the possibility that the employees in our sample have other savings accounts with other pension funds or insurance companies, we construct and investigate a subsample of individuals with more than one savings account in our sample (results appear in Section 5.2.3). To alleviate concerns about our identification strategy and to obtain additional insights, we continue our investigation with a series of controlled experiments to further test Hypotheses 5 and 6, described in detail in Section 6.
5.2. Results
5.2.1. Size Effect.
To test Hypothesis 1, which posits a positive correlation between account size and annuitization choices, we estimate the following logit equation:
Table 2 reports the regression estimates obtained from Equation (4). Regarding the effect of the accumulation size on the annuitization decision, the estimate in column (1) reveals that the average marginal effect of an additional NIS 10,000 to the accumulated amount on the propensity to annuitize is positive and significant, whereas the effect of holding a small amount, as reported in columns (2)–(5), is negative and significant. Specifically, our estimates reveal that an individual with an accumulated amount lower than NIS 50,000 is 31.2% less likely to annuitize compared with individuals with an amount above this level (individuals with accounts lower than NIS 100,000, 300,000, and 500,000 are 24.9%, 23.3%, and 22.5% less likely to annuitize, respectively). This implies that an individual who accumulated a relatively low amount at this insurance company (although such a retiree may have additional savings with other pension providers) would tend to prefer the lump sum option. More detailed tables presenting the control variables as well appear in Appendix C.31 The results support Hypothesis 1 by providing evidence for a positive significant correlation between accumulated amount and the tendency to prefer an annuity.
|
Table 2. Annuity Decision Regression
| Logit average marginal effects | |||||
|---|---|---|---|---|---|
| (1) | (2) | (3) | (4) | (5) | |
| Total amount | 0.0055*** | ||||
| (0.000) | |||||
| Less than NIS 50,000 | −0.312*** | ||||
| (0.009) | |||||
| Less than NIS 100,000 | −0.249*** | ||||
| (0.005) | |||||
| Less than NIS 300,000 | −0.233*** | ||||
| (0.006) | |||||
| Less than NIS 500,000 | −0.225*** | ||||
| (0.011) | |||||
| Controls | Yes | Yes | Yes | Yes | Yes |
| Year fixed effects | Yes | Yes | Yes | Yes | Yes |
| Observations | 15,293 | 15,293 | 15,293 | 15,293 | 15,293 |
| Pseudo-R2 | 0.4035 | 0.4180 | 0.4365 | 0.3856 | 0.3520 |
Notes. Average marginal effects. Standard errors in parentheses. Dependent variable, Yann, is an indicator variable for choosing any part of the disbursement as an annuity (rather than the full lump-sum choice). Main explanatory variables are different indicators for size of the account (total accumulation divided by 10,000 in column (1) and dummy variables for accumulations lower than a certain threshold in columns (2)–(5). Other controls not presented: gender, retirement age, retirement year, marital status, purchase age, number of policies, and the percentage of accumulation saved after 2008. Specifications 1–5 are for all retirees in the data (N = 15,293). NIS, New Israeli shekels.
***p < 0.01.
5.2.2. Income (Wealth) Effect.
Next, we aim to test Hypothesis 2, that is, that the size effect that we find is mediated by an income (as a proxy for wealth) channel. To this end, we investigate the aforementioned subsample of individuals in high- and low-wage occupations. Specifically, we estimate the following logit equation:
The coefficient of the high-income variable presented in Table 3 is positive and statistically significant. The interaction coefficient between high income and low accumulated amount of funds is significant and negative. This implies that individuals with high expected pension accumulations are more likely to annuitize in general yet less likely to annuitize accounts with small amounts while controlling for all the variables described in Section 5.2.1. More detailed tables presenting the control variables as well appear in Appendix C. These results support Hypothesis 3 (income) and provide initial evidence that is consistent with Hypotheses 5 and 6 (diversification). That is, for individuals who are likely to have more than one account, annuitization rates may differ across the different accounts and be positively correlated with the size of the account. Below we provide some robustness tests and exploit an experimental design to support these findings.32
|
Table 3. Annuity Decision Regression
| Low vs. high wage occupations (logit average marginal effects) | |
|---|---|
| High-wage occupation (=1) | 0.076** |
| (0.030) | |
| Less than NIS 50,000 | −0.053 |
| (0.042) | |
| High wage × Less than NIS 50,000 | −0.097** |
| (0.048) | |
| Controls | Yes |
| Fixed effects | Yes |
| Observations | 2,423 |
| Pseudo-R2 | 0.3359 |
Notes. Average marginal effects. Standard errors in parentheses. The dependent variable, Yann, is an indicator variable for choosing any part of the disbursement as an annuity (rather than the full lump-sum choice). Individuals with high-wage occupations are more likely to annuitize, and more likely to cash out accumulated amounts lower than NIS 50,000. Other controls not presented: gender, retirement age, retirement year, marital status, purchase age, number of policies, and the percentage of accumulation saved after 2008. NIS, New Israeli shekels.
**p < 0.05.
5.2.3. Robustness
5.2.3.1. Matching Analysis.
The focus of our empirical analysis is on estimating Equations (4) and (5). To further mitigate the potential concern of annuity choices being influenced by differences in individual characteristics or a selection bias, for robustness, we also use propensity-score matching to pair selected individuals by gender, retirement age, retirement year, marital status, purchase year, number of policies, and proportion of funds accumulated after 2008 (thus subject to the mandatory minimum annuity law33). The only difference is the amount saved at this insurance company (higher or lower than NIS 100,000). We end up with a subsample of 2,749 matched pairs (of individuals with savings of more than NIS 50,000).34
We estimate the propensity score followed by an estimation of the accumulation size effect on the tendency to choose any portion of the disbursement as an annuity. Annuity purchase is significantly higher for individuals with large accumulated funds in both the matched and unmatched samples.35 Specifically, individuals in the matched sample are more likely to purchase an annuity if they have a larger sum. Given the long-term-savings mechanism in Israel, individuals with similar characteristics should have quite similar overall total accumulations in dedicated long-term-savings products associated with tax benefits, such as the product that we investigate (although for some of them we observe only a fraction of their accumulated savings). This matching analysis supports the conjecture that our previous results are not driven by selection of personal characteristics.
5.2.3.2. Time Preferences.
The previous analysis also sheds light on Hypotheses 3 and 4, postulating that both our annuitization results and size accounts are affected by individuals’ time preferences. In particular, individuals who have higher discount rates are expected to save less and hence to retire with smaller accounts and are also expected to annuitize less. We argue that in the Israeli setting, for the savings product that we investigate, the relation between present preferences and long-term savings is limited, as most individuals save a constant percentage of their wage. Yet, for robustness, we build on empirical literature that focuses on different aspects of time preferences and specifically on the relation between time preferences and addictive behaviors such as smoking (Becker and Murphy 1988, Chaloupka 1991, Munasinghe and Sicherman 2006, Cronqvist and Siegel 2015, Hurwitz and Sade 2020, Scharff and Viscusi 2011) to investigate smoking behavior (as a proxy for time preferences) and account size. We find that smokers in our sample are indeed more likely to have smaller accounts. Yet, they are not less likely to annuitize36 and even after controlling for smoking behavior, small accounts are more likely to be annuitized. Results are presented in Appendix D.
5.2.3.3. Negligible Amounts.
To overcome the concern that very small amounts might be perceived as negligible (Benartzi et al. 2011), we estimate an additional model similar to Equation (4), excluding retirees who accumulated less than NIS 50,000 in total at this insurance company. In this subsample, we find similar results: The sign of the dummy variables for small amounts37 is significant and negative, implying that for this sample (accounts with nonnegligible amounts) as well, individuals treat smaller accumulated amounts differently from how they treat large accumulations.
5.2.3.4. Multiple Accounts Managed by the Investigated Insurance Company.
Finally, we study a subsample of 7,292 individuals having more than one account in our sample (and a total accumulation above the trivial threshold NIS 50,000). Results are presented in Figure 2, showing that annuitization rates of the largest account are higher compared with those of the smallest account. To explore whether this behavior could be due to personal characteristics or to portfolio diversification, we turn next to our experimental framework.
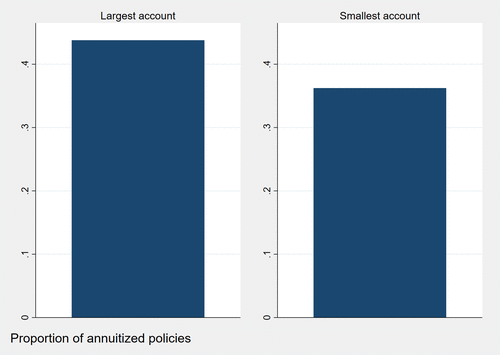
Notes. Subsample of 7,292 individuals having more than one policy in the same insurance corporation. Proportion of policies that were partially or fully annuitized of the largest accounts’ subsample are higher compared with policies that were partially or fully annuitized of the smallest accounts’ subsample.
6. Experimental Analysis
Given the previously mentioned recent dynamics in the job market and the increased sophistication in the financial markets, we assume that many individuals save and invest for retirement via more than one account managed by one provider. The major caveat concerning our data is that we observe behavior related to only one long-term-savings provider. However, the analysis of the administrative data indicates that individuals with small accounts, who have employment statuses implying that their total savings should be higher, often choose to withdraw these small accounts as a lump sum. To test Hypotheses 5 and 6, which posit for individuals with multiple accounts a positive correlation between the size of the account and the likelihood of it being annuitized, our aim hereafter is to document the related effect using an experimental framework.
The experimental framework not only allows us to overcome some of the data limitations (specifically the lack of information regarding savers’ entire portfolios) but also enables us to elicit preferences for annuitization in various controlled allocations of the accumulated funds. Furthermore, it enables us to examine the annuitization choice in an environment free of logistical frictions that could exist in the real world. Specifically, we designed a laboratory experiment that allows us (1) to better control the information conditions38 and the exogenous stochastic processes, specifically regarding the effects of anticipated consumption (i.e., future financial need), expected longevity, and other possible unknown parameters such as a spouse’s savings; (2) to repeat the task for the same participant, which allows us to include possible learning effects; (3) to offer monetary rewards related to performance to create a more authentic decision-making environment; (4) to focus on the pure effect of the annuitization decision; and (5) to focus on the considerations we perceive as important for our specific research question while keeping the task comprehensible to our subject pool (as we further elaborate in Section 6.1.1. We further implemented an additional online experimental survey. Its advantages over the laboratory experiment include the ability (1) to approach nontraditional participants (such as individuals around retirement age) and (2) to approach a larger sample to test for different distributions of funds across the accounts. Furthermore, in our laboratory setting we used a specific consumption distribution, but in our online experimental survey we did not assume any distribution, allowing for variation between participants. Its disadvantages in comparison with the laboratory experiment are as follows: (1) the reward is not related to the choices, and (2) because it was conducted online and not in the laboratory, we did not observe the participants while they were executing the tasks.
6.1. Methodology and Design
6.1.1. Design of the Laboratory Experiment.
Because of the complexity of the decision, designing a laboratory experiment to study annuitization decisions is not a trivial task, and hence, there is no design that has been accepted in the literature as a benchmark. When thinking about an experimental setup that captures the essence of the annuitization choice, important elements to consider include the structure of the uncertainty regarding longevity (Mitchell et al. 1999), future consumption and unexpected expenses (Reichling and Smetters 2015), and considerations related to bequest motives (Friedman and Warshawsky 1990, Bernheim 1991, Inkmann et al. 2011, Lockwood 2012). Given that life cycle savings decisions may be prone to biases (Shefrin and Thaler 1988, Statman 2017), we decided to focus on the first stage of the financial decision (the decision at retirement to annuitize or not) and thus to capture and investigate the pure effect of holding multiple accounts on annuitization choices. The experimental design that we adopted incorporates uncertainty about longevity and future consumption and takes into account bequest motives. Yet, it avoids some realistic aspects to reduce the complexity of the task for the participants in the experiment, as described below.
We leveraged the design of an annuitization experiment conducted by Hurwitz et al. (2020).39 The experiment included two rounds of a computerized task that involved the distribution of funds between a life annuity (paying for the rest of the retiree’s life) and a lump sum. Participants were randomly assigned to one of two conditions. In condition 1 (one-account condition), the control condition, respondents were asked to decide what amount of the account they would want as an annuity (versus a lump-sum)40 2 million. In condition 2 (two-account condition), participants confronted a similar task in which their accumulated funds (of the same total amount) was split between two accounts of “Zuz” 100,000 and “Zuz” 1.9 million. Our design was guided by the concept outlined in Section 2.2, which suggests that, in the absence of frictions, a rational individual’s maximization of lifetime utility from consumption should not be influenced by the specific composition of wealth in his or her multiple accounts that determines their total budget constraints.41
Because we aimed to simulate uncertainty about longevity and consumption in the experiment while keeping this uncertainty relatively easy to comprehend to the student sample, our participants in both conditions were informed that a computer would draw their life expectancy from a set ranging from 0 to 400 months with an average of 200 months.42 Indeed, these are not accurate survival probabilities, but the intent was to capture the idea of uncertainty regarding longevity while keeping the information and decision as simple as possible. Furthermore, to incorporate uncertainty about future expenses, participants in both conditions were told that their monthly consumption would be “Zuz” 3,000, 4,000, or 5,000 (evenly distributed). To avoid additional complexity in the decision-making process of our participants, the consumption level in our experiment was fixed for every period and the subjects could not adapt it via the life cycle. Participants were also informed that the outcome of both draws would only be revealed after they had made their payout choice; therefore, they did not know the exact amount they needed before choosing an annuity. This experimental design captures the idea that in reality individuals have only expectations about their longevity and future consumption when making the payment choice at retirement.
Throughout the experiment, we calculated the monthly balance in participants’ account according to their choices and the realization of the variables. In the case of a surplus (i.e., monthly income was higher than monthly consumption), it was accumulated each month and in the case of a deficit it was taken from the lump sum, if possible. Participants received a show-up fee of NIS 30 (equivalent to the hourly minimum wage in Israel) and NIS 20 in addition if they had no deficit in their account at the end of the experiment. This was designed to simulate the real-life state in which individuals who perceive annuities as a consumption tool are more likely to purchase them (Brown et al. 2008). Moreover, any monthly surplus or a lump sum not used for consumption was added to participants’ payments (as described to participants in detail at the beginning of the experiment). The aim of this part of the compensation scheme was to simulate bequest motives known to influence annuitization choices. Given that being a retiree with no income or savings is a very undesirable outcome, participants were fined for consuming all their funds, and if the annuity (and the remainder of the lump-sum withdrawal) was insufficient to pay for consumption, they received only the show-up fee.43 Each participant took part in the experiment twice (same condition) to test for potential learning effects.
We designed the experiment in such a way that a risk-neutral individual would be indifferent between the annuity and the lump sum for each of the consumption values (given that our aim is to focus on the effect of the distribution across accounts). To do so, we chose the annuity conversion factor to be 200 in monthly terms44 (which is equal to the mean of the life expectancy distribution). To find the optimal choice, one should assume a specific structure of risk preferences, which we do not assume. We assume that because our participants were randomly assigned, there is no significant difference in the risk aversion among the different conditions and groups.45
Admittedly, the experiment is simpler than the real-life decision, so that participants would be able to clearly understand the instructions. The experiment does not take into account some other considerations, such as large financial shocks early in retirement, interest rates, or taxation, among others. Nevertheless, as the aim of the experiment is not to explain the reasons for the low demand in many annuity markets but rather to study the consequences of holding multiple accounts, and since the above considerations were identical in both conditions, we think that the abstraction should not affect the external validity of our main conclusions. Before implementing the experiment, we conducted a focus groups to make sure that the task was clear to our potential student participants.
During the experiment, all participants were first given verbal instructions, followed by two examples of the task to ensure understanding (available in Appendix B). The participants were asked to provide demographic details before proceeding with the task.
6.1.2. Design of the Online Experimental Survey.
The main task each participant in our online experimental survey faced was again to split (virtual) accumulated funds between an annuity that would pay every period (until the end of life) and a lump sum. Respondents were randomly assigned to one of five conditions with a different distribution of the same accumulated amount across two accounts. Individuals in the control group (condition 1) were told that they had a single account with a total of NIS 2,000,000. The second group (condition 2) was told that their pension savings were managed in two accounts, a small account of NIS 30,000 and a large account of NIS 1,970,000. The third group of participants (condition 3) faced the same task, only this time the small account consisted of NIS 100,000 and the large account of NIS 1,900,000 (similar distribution as the two accounts condition in the laboratory experiment). The fourth group (condition 4) was told they had a small account of NIS 500,000 and a large account of NIS 1,500,000, and participants in the fifth group (condition 5) were told they had two equal accounts of NIS 1,000,000 each. Similarly to the laboratory experiment, and from the same considerations, we used a conversion factor of 200 months, which is very close to the actual conversion factor in various countries such as Israel and the United States. The online experimental survey was sampled (representatively) by the survey company Geocartography46 from an online panel of about 35,000 voluntarily registered potential participants with a wide representative age distribution.
6.1.3. Expert Survey.
Last, we wanted to investigate the role of knowledge and literacy. To this end, we further conducted a survey among experts. Specifically, we asked finance professors and senior managers of pension funds in Israel47 to split (virtual) accumulated funds between a life annuity and a lump sum. We tested condition 1, one account (2,000,000), and condition 3 (two accounts, 100,000 and 1,900,000), which is consistent with the treatments that we tested in the laboratory.
6.2. Results
6.2.1. Laboratory Experiment
6.2.1.1. Participants and Summary Statistics.
Participants in the experiment were students at the Hebrew University of Jerusalem and the College of Management Academic Studies, Israel.48 Participants (n = 135) were randomly assigned to one of two treatment (n = 67 in the control group with one account; n = 68 in the treatment group with two accounts). Mean age of participants was 26 years, and 42% were male.
6.2.1.2. Annuitizaiton Choices.
We first compare the likelihood of participants choosing an annuity in the first round of our laboratory experiment (the results of the second round are very similar). Table 4 presents the mean total amount designated by participants to purchase annuities in the first round. In the two-account condition (where the distribution of funds was 100,000 in the small account and 1,900,000 in the large one), the amount presented is the sum of funds allocated to annuitization from both the small and large accounts. Participants in this treatment group chose to annuitize about “Zuz” 400,000 more than participants in the control group.
|
Table 4. Laboratory Experiment Results Sum of Chosen Annuity
| N | Mean | Standard deviation | |
|---|---|---|---|
| Control: 1 account | 67 | 1,269,828 | 577,805 |
| Treatment: 2 accounts | 68 | 1,670,931 | 436,989 |
| Difference | −401,103 | ||
| t | −4.55 |
Notes. Summary of chosen annuity in the first round of the laboratory experiment. In total, participants in the treatment group chose to annuitize a higher portion of their accumulated amount.
The nature of this choice can be grasped in Figure 3, which presents the proportions of total accumulations withdrawn as an annuity by condition, for both the large and small accounts. Whereas the proportion of the account participants decided to annuitize in the one-account condition (control group) was about 63%, the proportion of the small account annuitized in the treatment group was 62% and of the large account, 84%. These results support Hypothesis 5, postulating that for individuals with multiple accounts, annuitization rates will differ across the different accounts, and Hypothesis 6, suggesting that the larger the account is, the more likely it is to be annuitized. We conducted two rounds of the experiment to test for potential learning effect. The results of the second round are very similar (and not significantly different) to the results obtained in the first round.
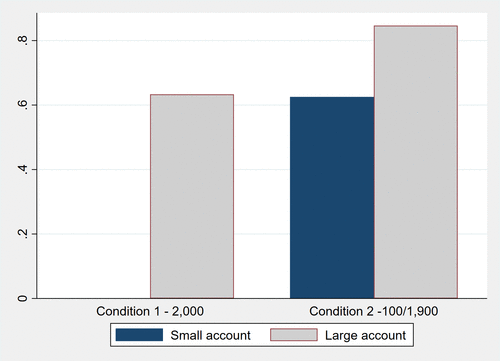
Note. Proportions of total accumulation withdrawn as an annuity in the first round of the experiment, separately for small and large accounts, by condition.
6.2.2. Online Experimental Survey
6.2.2.1. Participants and Summary Statistics.
We carried out an online experimental survey of 1,971 Israeli residents49 aged 18–79 years (n = 390 in condition 1; n = 391 in condition 2; n = 394 in condition 3; n = 398 in condition 4; n = 398 in condition 5; mean age = 39.1 years; 48.7% male) in October 2018 and February 2019. Regarding income, 13.6% reported a very low income, and 39% reported a high income.
6.2.2.2. Annuitization Choices.
Our main findings are presented in Figure 4, suggesting that if accumulated amounts are divided between a small and large account, it is more likely for individuals to cash out the small account and annuitize the large account. Specifically, whether the large account consists of NIS 2,000,000, NIS 1,970,000, NIS 1,900,000, NIS 1,500,000, or NIS 1,000,000, the average annuitization rate is about 70%. However, the propensity to annuitize any part of the small accounts was lower. For the NIS 100,000 account, an average of 42.4% of the funds were annuitized. Finally, for the NIS 500,000 account, we find an average lump-sum cash-out of 56.4%, and in the equal-accounts condition, this increased to 62.1%. These findings supports the previous results of our laboratory experiment and Hypotheses 5 and 6, suggesting that individuals are more likely to cash out small accounts.
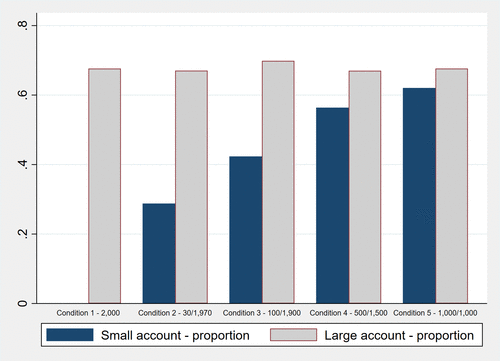
Note. Proportions of total accumulation withdrawn as an annuity in the online experimental survey, separately for small and large accounts, by condition.
For additional insight, we tested the results of a logit model, in which the dependent variable is withdrawing only a lump sum (“full lump-sum amount”), and a logit model in which the dependent variable indicates choosing the full annuitization option. These additional tests suggest a significant difference in the tails of the distribution. Specifically, for the full lump-sum specification, we find that the propensity to fully withdraw both accounts is significantly higher in cases where there are two accounts with funds split unevenly compared with the control group (one account), and our results suggest that the propensity to fully annuitize is lower with the existence of a relatively small account (either 30,000 or 100,000, i.e., an unequal diversification).50 In Appendix F, we further present a kernel density plot for the control group (condition 1) compared with conditions 2–5. A Kolmogorov-Smirnov test of the hypothesis that the empirical distributions for the control condition with one account and each of the two-account conditions comes from the same population distribution rejects the null hypothesis (all p values are lower than 0.05).
6.2.3. Experts Survey.
Finally, we looked at the distribution of total amounts that participants from the financial experts sample chose to annuitize. Given that the sample consists of only 61 experts (n = 27 in condition 1 and n = 34 in condition 2), we do not want to overstate the results; nevertheless, the distribution of the results is not significantly different for the two conditions. This suggests that highly informed and trained individuals think about the total sum of money involved, and they are less affected by its distribution across accounts.
7. Conclusions
This paper uses administrative data and multiple experiments to test whether holding multiple savings accounts affects retirement payout decisions. Specifically, we examine the annuitization decisions of retirees in Israel who have had a pension insurance product at a leading Israeli insurance company. Even though we use Israeli data, the issue of having multiple saving accounts is important in other countries as well. Our investigation relies on a unique and very detailed proprietary data set from an insurance company that contains information about annuitization decisions upon retirement and a rich set of sociodemographic parameters, including information on occupation. We document a significant and positive effect of the size of the accumulated funds on the decision to annuitize: the smaller (larger) the accumulated sum of money in the pension account, the lower (higher) the propensity to annuitize upon retirement. In a further set of online and laboratory experiments, we again show that the very existence of a small account within a portfolio may in fact alter annuitization rates related to the total amount. In other words, diversification across accounts may lead to different decisions and in turn, different financial outcomes for both individuals and financial institutions.
Our results have important policy implications for ALM at financial institutions. These institutions are expected to forecast both the propensity to annuitize and the longevity risk embedded in their portfolios. Systematic individual biases may influence choices and as a result may also have consequences related to the future reserves needed for the stability of annuity providers.
Although this may not be the sole explanation of annuitization choice, our findings suggest that an illusion of wealth and mental accounting play a role by causing retirees to perceive smaller and larger pension accounts differently, leading them to make different decisions about disbursements. We recognize that mental accounting is very relevant to the valuation of the costs and benefits associated with multiple retirement savings accounts across several providers and may be considered by financial institutions when developing financial technology applications that can overcome the documented tendencies (e.g., an app that aggregates the account information and presents the overall accumulations before the annuitization decision, and vice versa, depending on needs and desires).
One could argue that some individuals are fully aware of lacking self-control (O’Donoghue and Rabin 1999a) and hence the fact that they hold multiple savings accounts is an intentional mechanism, aimed at encouraging financial discipline (Zhang and Sussman 2018). Specifically, saving via multiple accounts may allow the individual in the future to withdraw a small amount as a lump sum, whereas the other larger account is designated to annuitization. This insight could be used by financial institutions that could suggest opening more than one savings account, each designated to a different goal. Further research is required, however, to fully understand the consequences of such a suggestion.
Our results can also help in the design of regulatory interventions. In future research, we hope to study the consequences and implications of first presenting retirees with their total accumulation and discussing their various retirement needs, before they make the annuitization decision.
The authors thank Yaakov Amihud, Shlomo Benartzi, Brent Davis, Avraham Ebenstein, Michal Hodor, Chad Kendall, Moshe (Shiki) Levy, Annamaria Lusardi, Olivia S. Mitchell, Oded Sarig, Judith C. Schneider, Tal Shavit, Beata Shwartz, Federica Teppa, Yishay Yafeh, and participants at the 2019 experimental finance meeting in Copenhagen, the 2020 American Economic Association/Allied Social Science Associations meeting, the 5th annual Chapman Conference on the Experimental and Behavioral Aspects of Financial Markets, the Netspar International Pension Workshop 2020, the 2020 Economic Science Association Global Online Around-the-Clock Meeting, the Data for Policy Conference 2020, the Center for the Economic Analysis of Risk/Munich Risk and Insurance Center Behavioral Insurance Workshop 2022, and the Private and Social Insurance Implications of Demographic Change conference at Goethe University Frankfurt 2022 for comments, as well as seminar participants at the University of Pennsylvania’s Wharton School, University of Connecticut, University of Utah, the College of Management Academic Studies, the Hebrew University of Jerusalem, Bar-Ilan University, Ben-Gurion University of the Negev, Haifa University, IE Madrid, Tel-Aviv University, University of St. Gallen, and Yeshiva University.
Appendix A. Experiment and Survey instructions
Laboratory Experiment Instructions
Decision-Making Experiment—Informed Consent
Greetings!
You are about to participate in a financial decision-making experiment. The experiment consists of several stages, which will be described below. The payment for the experiment will be calculated as per the description provided (in addition you will be paid 30 NIS for participating). The payment is subsidized with thanks from research budgets from the Hebrew University and The College of Management Academic Studies. The following instructions and research questions are both part of the experiment. For any further questions or clarifications, please reach out to us at any point.
The experiment contains five parts:
Reading the instructions
General questions
A computerized experiment
Answering a questionnaire
Getting paid for the experiment
The questions in the survey will address your personal beliefs, and there are no right or wrong answers. Please choose the answer that is the most appropriate for you. We would appreciate if you would answer all the questions, however, you are allowed to skip questions that raise any discomfort without any penalty on your side. The experiment is anonymous and the data that are being collected will be used for research purposes only, while maintaining complete confidentiality. Filling out the questionnaire will be considered as consent from your side to participate in the experiment, but you can end your participation at any time, without any consequences. If you are interested, we will be happy to share with you the results of our research, once the research project is completed. For questions and additional information about the research and its findings, please contact Abigail Hurwitz at: Abigail.
Thank you for your cooperation!
START THE EXPERIMENT
Part A: Instructions
The choice:
For your participation in this experiment, you will be immediately allocated an amount of 50 NIS (30 NIS of which are considered as a payment for attending and participating and will be given to you anyway). Please note, however, the following instructions: the total amount of payment that you will eventually receive will be calculated in accordance with your performance in the experiment. The eventual total payment may be more or less than 50 NIS, but no less than 30 NIS.
Assume that you have now reached retirement age, and you must decide the way you would like to obtain your pensions savings.
Assume that you worked your entire life and saved 2,000,000 “Zuz” up until today (the final amount in “Zuz” will be converted to NIS at the end of the experiment by a given rate that will be explained later).
Please note that annuity payments are calculated as 1/200 of the total amount that you have allocated for annuitization (the meaning of the conversion rate of 200 is that if you chose to withdraw an annuity of 1,000 NIS, the amount that would be allocated for the annuity payments is and the rest will be available to withdraw as a lump-sum amount of NIS at the day of retirement).
Your life expectancy in the experiment (number of months in which an annuity will be paid) will be raffled during the experiment and will be explained later.
You are due to consume a certain amount, as explained later.
The system will use the monthly annuity payments and your capital obtained as a lump sum to fund the amount to be consumed (as explained above).
If the monthly payments won’t be enough to fund the consumption, and you’ll run out of capital (the amount you withdrew) following the funding of the chosen amount to be consumed, you will end up getting a reward of 30 NIS just for your participation.
If you will not run out of capital, or have a positive balance from the monthly annuity amounts, they will be converted to NIS at the end of the experiment according to a set rate that will be explained later.
The raffle:
At this stage, the number of life periods will be drawn for you (to be used in this experiment). It will be a round number between 0 and 400, distributed via normal distribution.
The capital you have chosen will be given to you in a single payment, and the additional annuity will be given to you throughout all the life periods in this experiment, even if the amount of “Zuz” you accumulated so far will run out.
Your spending amount will be raffled randomly according to one of the three possibilities: 3,000, 4,000, or 5,000 “Zuz”. If the annuity you chose does not cover the consumption amount that had been raffled, for each life period, the difference will be paid from the lump-sum amount you chose, and if that amount will not be sufficient, you will end the experiment with only 30 NIS as a reward.
The payment:
The payment after the experiment is based only on your own results during the experiment. After the end of the experiment, you will receive the amount of the following payments: A+B+C+D or just A.
A—reward for participation
B—participation bonus, if you did not end up spending all the “Zuz” you have saved (from the distribution of the lump sum and the monthly annuity).
C—the difference between the monthly annuity income and the monthly spending, divided by 50,000.
D—the remainder of the lump sum (capital) you have requested, after it was used (if it was needed to cover the monthly payments), divided by 50,000. Please note that if you have spent all the “Zuz” you saved (from both annuity and capital), the additional participation bonus would be subtracted, and you will remain with only 30 NIS (A).
CONTINUE
Questions to make sure that the instructions are clear
The following examples are for illustration purposes only and they do not act as a recommendation for any kind of strategy to be used by the participants.
You may use a calculator.
The experiment will not let you continue with the experiment until you answer the question correctly.
If you need assistance, please contact the experimenter.
Example
If you chose to allocate all your savings for annuity, what is the monthly annuity that you’d get?

Let’s say that the raffle determined that you have a monthly consumption of 3,000 “Zuz” and the game will last for 300 periods. What would be the monthly deficit/excess balance in your account?

How much will you get at the end of the game?
 NIS for participation
 NIS participation bonus
 NIS, which is the difference between the monthly annuity payments and spending for consumption, times the number of periods, and then divided by 50,000.
No capital (lump sum)
 NIS Total
Part B: General Questions
Birth year
Gender
Marital status
Number of children
Birth country of your father
Do you smoke (more than 3 cigarettes a day on a regular basis)?
Have you smoked regularly in the past (more than 5 cigarettes a day)?
Education (number of years in a formal setting)?
Did you take classes about economics, business management, or statistics while studying in high school?
Academic institution (in which you earned your most recent degree)?
Part C Decision Making—Version 1—One Account
Given the explanation provided above (meaning you’ve accumulated 2,000,000 “Zuz” in your account), which you now must divide between capital and annuity, what is the amount of lump sum (to be given only once immediately) that you will choose?
 NIS
NIS
For any questions or concerns, please contact the experimenter.
CONTINUE
Part D—Additional Questions
The average total monthly salary for an employee in Israel (as of January 2019) is 10,273 NIS. Is this your average salary or more (for a full-time job 100%)?
In general, what is the status of your health condition?
Do you have any health or physical issues? We are referring to any potential problem you’ve been dealing with for more than six months.
(If you answered” yes” to question 3) does this problem bother you while performing day-to-day activities?
Do you take part in any extreme sport activities (like bungee jumping or surfing), or any other risky activity?
In general, do you consult more than one financial consultant while making a financial decision?
Using numbers from 0 to 10, where 0 stand for “no chance” and 10 stands for “full certainty,” please answer the following questions
what are the chances that you estimate that you’ll survive to age 85?
what are the chances that you estimate that you’ll survive to age 95?
Using numbers from 0 to 10, please evaluate the level of discomfort and sorrow that you’d feel if you were to be left without sufficient funding for your retirement period, where 0 stand for little and 10 stand for great discomfort and sorrow.
Assume that you’re about to get an amount of 3,000 NIS deposited to your personal checking account immediately. Instead, we offer to give you an amount of money in a year from today. What is the minimum amount you’re willing to get in a year from now, instead of the 3,000 today?
Imagine that you are being offered a chance to buy a lottery ticket, for a raffle in which 10 participants take part (so the odds of winning are 1:10). The reward is 2,000 NIS. What is the maximum amount you would be willing to pay for the lottery ticket?
To what extent do you feel that you have a good understanding of financial matters?
CONTINUE
Thank you for your participation. The total amount you’ve earned from the experiment is as follows: Two accounts (Will only elaborate on the differences - in italic):
• SIMILAR TO THE PREVIOUS INSTRUCTIONS BUT EVERYTHING IS WRITTEN REGARDING THE TWO-ACCOUNT CONDITION:
• Assume that you’ve worked your entire life and saved money in two separate accounts as follows:
– Account A—being managed by insurance company A—in which you saved 100,000 “Zuz”
– Account B—being managed by insurance company B—in which you saved 1,900,000 “Zuz”
Online Survey Instructions
Following is an example to the treatment with a small account of NIS 100,000 and the large account of NIS 1,900,000. All other treatments similar.
You have a case study before you, please read it carefully and answer the question only once you have finished reading.
Assume that you are approaching retirement and up to this day, you’ve saved money in two different pension accounts.
• Account A—held in insurance company A—in which you saved NIS 100,000.
• Account B—held in insurance company B—in which you saved NIS 1,900,000.
You can choose whether to withdraw the amount in a one-time payment (cash) from each account or ask for a monthly annuity that will be paid for the rest of your life, or combine the options. The conversion factor for the annuity is 200. The meaning of this factor is that if you choose a monthly pension annuity of NIS 1,000 at company B, then NIS 200,000 will be assigned to the monthly annuity (200 times 1,000) and the rest (NIS 1,700,000) is available for a cash withdrawal. As mentioned before, essentially, it’s possible to decide to withdraw the entire amount (NIS 1,900,000) in cash, or the entire amount as an annuity (monthly annuity of NIS 9,500), or any other combination between cash and annuity. The same rules apply for the amount in company A. It’s possible to withdraw the entire amount (NIS 100,000) in cash, or the entire amount as an annuity (monthly annuity of NIS 500) or any other combination between cash and annuity.
Under these conditions, how much cash would you like of the entire amount (NIS 100,000) held in account A? How much cash would you like of the entire amount entire amount (NIS 1,900,000) held in account B?
(Nominal answer).
• Account A (NIS 0–100,000):
• Account B (NIS 0–1,900,000):
To what measure do you feel that you are knowledgeable in financial matters? (Not at all/A little bit/Neutral/Somewhat knowledgeable/Very knowledgeable)
Demographics:
• Gender
• Age
• Level of religiousness
• Family status
• Level of education
• Level of income
Appendix B. High- and Low-Income Occupations
B.1. High-Income Occupations
Accountant Attorney Bank Teller Bookkeeper Business Development Manager Chemical Engineer Chief Executive Officer Chief Financial Officer/Director of Finance Civil/Construction Engineer Civil/Construction Practical Engineer Computer Engineer Computer Programmer Computer Systems Analyst/Information Technology (IT) Analyst Dental Technician Dentist Department Manager Economist Electrical Engineer Electronics Engineer Electronics Practical Engineer Engineer General Manager General Surgeon Hardware Engineer Human Resources Manager/Director Insurance Broker IT Manger/Chief Information Officer Journalist Lecturer Manager Marketing Associate/Analyst Marketing Manager/Chief Marketing Officer Mechanical Engineer Mechanical Practical Engineer Operations Manager/Chief Operating Officer Owner/Business Owner Pharmacist Physician/General Practitioner Product Manager/Vice President Production Production Manager Programmer Programmer/Developer Project Manager Sales Manager/Vice President Sales/Chief Revenue Officer Software Engineer Software Tester/Quality Assurance Analyst Vice President
Low-income occupations.
Childcare/Preschool Provider Cleaner/House Cleaner Gardener Kindergarten Teacher Kitchen Worker Nanny Nursing Caregiver
Appendix C. Detailed Tables
|
Table C.1. Annuity Decision Regression
| Logit average marginal effects | |||||
|---|---|---|---|---|---|
| (1) | (2) | (3) | (4) | (5) | |
| Total amount | 0.0055*** | ||||
| (0.000) | |||||
| Less than NIS 50,000 | −0.312*** | ||||
| (0.009) | |||||
| Less than NIS 100,000 | −0.249*** | ||||
| (0.005) | |||||
| Less than NIS 300,000 | −0.233*** | ||||
| (0.006) | |||||
| Less than NIS 500,000 | −0.225*** | ||||
| (0.011) | |||||
| Gender | 0.012* | 0.028*** | 0.021*** | 0.023*** | 0.031*** |
| (0.006) | (0.006) | (0.006) | (0.006) | (0.006) | |
| Retirement age | 0.019*** | 0.021*** | 0.017*** | 0.021*** | 0.026*** |
| (0.001) | (0.001) | (0.001) | (0.001) | (0.001) | |
| Divorced | −0.006 | −0.006 | −0.013 | −0.004 | −0.014 |
| (0.017) | (0.018) | (0.017) | (0.018) | (0.018) | |
| Widowed | −0.005 | −0.011 | −0.010 | −0.001 | −0.008 |
| (0.019) | (0.019) | (0.019) | (0.019) | (0.020) | |
| Married | −0.013 | −0.014 | −0.018 | −0.012 | −0.020 |
| (0.016) | (0.016) | (0.016) | (0.016) | (0.017) | |
| Unknown marital status | −0.322*** | −0.329*** | −0.310*** | −0.330*** | −0.370*** |
| (0.018) | (0.018) | (0.017) | (0.019) | (0.019) | |
| Purchase age | −0.018*** | −0.020*** | −0.017*** | −0.020*** | −0.023*** |
| (0.001) | (0.001) | (0.001) | (0.001) | (0.001) | |
| No. of policies | 0.013*** | 0.022*** | 0.013*** | 0.024*** | 0.036*** |
| (0.002) | (0.001) | (0.001) | (0.002) | (0.002) | |
| Percentage post-2008 | 0.195*** | 0.201*** | 0.154*** | 0.211*** | 0.241*** |
| (0.015) | (0.017) | (0.015) | (0.015) | (0.016) | |
| Year fixed effects | Yes | Yes | Yes | Yes | Yes |
| Observations | 15,293 | 15,293 | 15,293 | 15,293 | 15,293 |
| Pseudo-R2 | 0.4035 | 0.4180 | 0.4365 | 0.3856 | 0.3520 |
Notes. Average marginal effects. Standard errors in parentheses. Dependent variable, Yann, is an indicator variable for choosing any part of the disbursement as an annuity (rather than the full lump-sum choice). Main explanatory variables are different indicators for size of the account (total accumulation divided by 10,000 in column (1) and dummy variables for accumulations lower than a certain threshold in columns (2)–(5). Other controls not presented: gender, retirement age, retirement year, marital status, purchase age, number of policies, and the percentage of accumulation saved after 2008. Specifications 1–5 are for all retirees in the data (N = 15,293). NIS, New Israeli shekels.
***p < 0.01.
|
Table C.2. Annuity Decision Regression
| Low vs. high wage occupations (logit average marginal effects) | |
|---|---|
| High-wage occupation (=1) | 0.076** |
| (0.030) | |
| Less than NIS 50,000 | −0.053 |
| (0.042) | |
| High wage × Less than NIS 50,000 | −0.097** |
| (0.048) | |
| Gender | 0.007 |
| (0.014) | |
| Retirement age | 0.008*** |
| (0.002) | |
| Divorced | 0.027 |
| (0.061) | |
| Widowed | 0.084 |
| (0.060) | |
| Married | 0.074 |
| (0.058) | |
| Unknown marital status | −0.066 |
| (0.061) | |
| Purchase age | −0.008*** |
| (0.001) | |
| No. of policies | 0.008*** |
| (0.002) | |
| Percentage post-2008 | 0.112*** |
| (0.032) | |
| Year fixed effects | Yes |
| Observations | 2,423 |
| Pseudo-R2 | 0.3359 |
Notes. Low- vs. high-wage occupations. Average marginal effects. Standard errors in parentheses. The dependent variable, Yann, is an indicator variable for choosing any part of the disbursement as an annuity (rather than the full lump-sum choice). Individuals with high-wage occupations are more likely to annuitize, and more likely to cash out accumulated amounts lower than NIS 50,000. Other controls not presented: gender, retirement age, retirement year, marital status, purchase age, number of policies, and the percentage of accumulation saved after 2008. NIS, New Israeli shekels.
**p < 0.05.
Appendix D. Time Preferences
|
Table D.1. Annuity Decision Regression
| Logit average marginal effects | |
|---|---|
| Less than NIS 50,000 | −0.312*** |
| (0.009) | |
| Smoking | 0.016* |
| (0.008) | |
| Male gender | 0.029*** |
| (0.006) | |
| Retirement age | 0.021*** |
| (0.001) | |
| Divorced | −0.007 |
| (0.018) | |
| Widowed | −0.011 |
| (0.019) | |
| Married | −0.014 |
| (0.016) | |
| Unknown family status | −0.329*** |
| (0.018) | |
| Purchase age | −0.020*** |
| (0.001) | |
| Number of policies | 0.022*** |
| (0.001) | |
| Post 2008 | 0.201*** |
| (0.017) | |
| Year fixed effects | Yes |
| Observations | 15,293 |
| Pseudo-R2 | 0.41 |
Notes. Average marginal effects. Standard errors in parentheses. Dependent variable, Yann, is an indicator variable for choosing any part of the disbursement as an annuity (rather than the full lump-sum choice). Main explanatory variables are an indicator for size of the account (less than NIS 50,000) and smoking. Smokers are not less likely to annuitize, and controlling for smoking, small accounts are less likely to be paid out as an annuity. Other controls include gender, retirement age, retirement year, marital status, purchase age, number of policies, and the percentage of accumulation saved after 2008. N = 15,293. NIS, New Israeli shekels.
**p < 0.05.
Appendix E. Experimental Design—Optimal Choices
To derive the full optimization exercise, one should assume a specific structure of risk preferences regarding the risk of outliving your assets (living “too” long) or wasting your assets (living “too” little). We designed the experiment in such a way that a risk-neutral individual would be indifferent between the annuity and the lump sum. To illustrate this, let us assume there are only three states of the world (as the annuity factor is 200, the mean of this distribution must be 200 for the annuity to be fairly priced):
In this case, the expected utility would be equal for any annuity chosen by the participant. For instance, if we assume that consumption will be “Zuz” 3,000 and the risk-neutral participant chose the full lump-sum choice (an annuity of zero), the expected utility would be
In this design, for a risk-neutral individual, the utility from choosing an annuity of 5,000 would be the same:
Table E.1 illustrates the utility for a risk-neutral participant for any possible consumption in the experiment, for various annuity levels and under the simple case of possible periods described above.
|
Table E.1. Illustration of Utility
| Monthly consumption | Annuity 0 | Annuity 5,000 | Annuity 10,000 |
|---|---|---|---|
| 3,000 | 1,400,000 | 1,400,000 | 1,400,000 |
| 4,000 | 1,200,000 | 1,200,000 | 1,200,000 |
| 5,000 | 1,000,000 | 1,000,000 | 1,000,000 |
We assume that because the participants were randomly assigned, there is no significant difference in the risk aversion of the different treatments and groups.
Appendix F. Kernel Plot
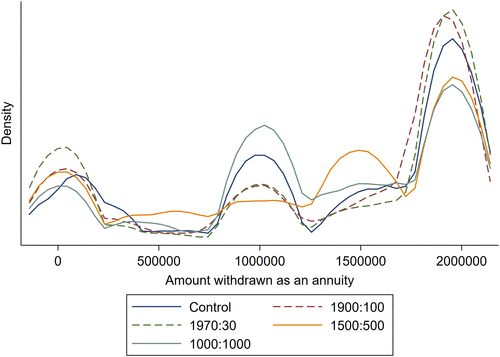
Notes. Distributions of amounts withdrawn as an annuity in the online experimental survey, by condition. Control represents the group exposed to one account; is the group presented with an account of NIS 1.9 Million and an additional account of NIS 100 thousand; is the group presented with an account of NIS 1.970 Million and an additional account of NIS 30 thousand; is the group presented with an account of NIS 1.5 Million and an additional account of NIS 500 thousand; is the group presented with two accounts of NIS 1 million each.
1 For further information about multiple super accounts in Australia, see https://www.ato.gov.au/about-ato/research-and-statistics/in-detail/super-statistics/super-accounts-data/multiple-super-accounts-data.
2 Holden et al. (2021) report that about 20% of employees in the Employee Benefit Research Institute data set had less than two years of tenure at their current employer, and Baum (2022) finds that younger workers have at least seven jobs over the first decade or two of their career.
3 Each client in our sample could choose to withdraw a lump sum, an annuity, or both, subject to Israeli government regulations. The annuitization decision is irreversible.
4 We consulted with long-term-savings tax experts to make sure that tax considerations would not drive these results.
5 Individuals have the incentive to report changes in their occupational status, because otherwise they might not be covered by other insurance policies from this company or might have to pay a premium on other products.
6 Given the potential pros and cons of each experimental design, to mitigate some of the concerns and improve the robustness of the results, there is a growing use of multiple experimental methods aimed to investigate a particular research question in a single study. For additional discussion on the pros and cons of using Internet versus laboratory experiments and the benefits of using several experimental methods for robustness and further insights, see, for example Ben-David and Sade (2020), Dohmen et al. (2011), Glaser et al. (2019), and Hurwitz et al. (2020).
7 For the translation of the experimental instructions, see Appendix A.
8 Our project joins the line of financial economics research that uses financial professionals either for robustness tests or for the main subject pool in surveys (Anderson and Sunder 1995, Sade et al. 2006, Holzmeister et al. 2020, Weitzel et al. 2020).
9 Defined benefit pension funds in Israel that were closed to new clients after December 31, 1994.
10 Defined contribution pension funds that were first established on January 1, 1995; these funds must preserve actuarial balance.
11 Also known in Israel as managerial insurance policies, the trade name of pension insurance products designed for employees. These policies include both a savings component and an insurance component (for different kinds of risks such as death and disability).
12 For further discussion about the Israeli pension system, see also Hurwitz et al. (2020). Israel also provides a public health system and a national health insurance system.
13 It is important to note that the state pension in Israel (social security) is historically very low and consists of a universal state pension (for individuals working at least a certain number of years); the private layer is the significant part of the pension and is state supported but privately funded (Gal 2002).
14 The insurance company that provided us with the data are one of the five largest insurance groups in the country. The population that is insured by this company is very diversified in terms of occupation.
15 We initially received information on 18,860 retirees but for some observations we did not have sufficient sociodemographic information (missing data). For each individual we have information about age, gender, marital status, smoking status, medical and professional supplements to a policy (due to risk), last occupation prior to retirement, and information about the policy such as date of purchase of the policy, date of disbursement, annuity factor (annuity price), and investment management method.
16 Approximately USD 50,000. There are several indications that this amount is lower than the average long-term savings of individuals in Israel. For instance, according to public data published by Old Mivtachim (the largest Israeli “old pension fund” whose members were not likely to have other long-term savings accounts for historical reasons), the average accumulation for clients between the ages of 60 and 64 years is NIS 728,000.
17 The four largest accumulations were NIS 5.4 million, NIS 6.5 million, NIS 9.5 million, and NIS 12.9 million.
18 To better understand the retirement process we interviewed two vice presidents of insurance corporations in Israel. We learned that individuals upon retirement were presented with information both about the accumulated amount in their accounts and with a NIS expected annuity, per account.
19 There is no default option for pension products analyzed in this paper (pension insurance policies). For further discussion about the Israeli annuitization legislation, see Hurwitz and Sade (2020).
20 161.494 in monthly terms.
21 We show that the results are robust for thresholds of NIS 50,000, 100,000, 300,000, and 500,000.
22 Such as managers, computer programmers, engineers, software engineers, general managers, and chief executive officers. For a full list of occupations, please see Appendix B.
23 To verify the validity of the classification we created, we used information from the labor branch of the Israeli Ministry of Economy and Industry. Our findings suggest that the mean wage for the occupations in the high-salary subsample is about three times the mean wage of the low-salary subsample; furthermore, we conducted an additional experiment with 48 students, in which each student received 10 random pairs of occupations and was asked to choose the one with the higher salary. There was 91% agreement between these participants and our initial classifications.
24 Moreover, in similar settings, Hurwitz and Sade (2020) find no evidence that smokers, who are expected to have high discount rates, are less likely to annuitize.
25 As a robustness check we also look at the propensity to annuitize and the choice of full annuities and find a similar effect.
26 By controlling for these personal traits, we also overcome the concern that the size of the account is driven by these characteristics. We conduct additional robustness tests in Section 4.2.3.
27 For the pension product we analyze, the management fees were not contingent on the accumulated amount.
28 Funds accumulated after 2008 had to be withdrawn as an annuity to satisfy the minimum mandatory annuity law of 2008. The mandatory annuitization legislation should not have a substantial impact on our results. First, the regulation was enacted in 2008 regarding funds saved after this year. Our analysis is based on data from 2009–2013, which means that most of the funds in our data set are not restricted by the law (we control for the percentage of sums that were saved after 2008 in this company for each individual). Furthermore, we measure whether a participant annuitized any amount of their accounts in our insurance company. If under this legislation small accounts were not annuitized, individuals may have another savings account elsewhere (implying that the small account is likely to be a part of a portfolio, as we have suggested).
29 Purchase age is the average age of the retiree over all of the retiree’s accounts. This variable is correlated with the client’s annuity conversion factor (i.e., the price of the annuity) and hence can serve as a proxy for it. We do not have information on the annuity conversion factor for clients who chose the full lump-sum option. Because, in Israel, there are specific regulations about the factors that determine the conversion factors and because conversion factors can change as a function of the time the policy was issued, we conducted an additional analysis to make sure this is not affecting our results. Specifically, we compared the average propensity to annuitize small versus large (accumulation above NIS 50,000) accounts that were originated in the same year and found that large accounts were more likely to be annuitized, regardless of the origination year that is correlated with conversion factor.
30 For robustness, we also check the impact of including information on the gross domestic product, the risk-free interest rate, and yield on the market portfolio (TA-100 Index); the results regarding our main variables of interest are similar.
31 For robustness we also conducted the same analysis presented in Table 2 and Table C.1 with a dependent variable measuring the proportion of sums withdrawn as an annuity out of the total savings of each individual (rather than the binary variable presented above); the coefficients of the various amount variables remain negative and significant.
32 Income is correlated with financial literacy; hence, we would expect that high-wage individuals would be more likely to annuitize. We find that this is true, unless the accumulated amount is small. This fact strengthens our hypothesis that diversification affects payout choices. Furthermore, one could argue that income is correlated with life expectancy, and indeed we find that large accounts are more likely to be annuitized. However, the results suggest that small accounts of individuals with a high-income occupation are less likely to be annuitized, suggesting again that diversification plays a role in the decision. We address these concerns using our experimental framework.
33 Only for money saved after 2008.
34 We used the PSMATCH2 procedure in Stata (Leuven and Sianesi 2018) with only one match and no replacements.
35 Similar results were obtained using nearest neighbor matching.
36 For a discussion about smoking, time preferences, and annuitization choices, see Hurwitz and Sade (2020).
37 Defined here as accumulations that are smaller than NIS 100,000 (between NIS 50,000 and NIS 100,000).
38 For instance, we do not have information about the behavior of spouses and individuals in the same household in our data. A controlled laboratory experiment enables us to control for these exogenous properties.
39 Translation of the instructions from Hebrew to English is provided in Appendix A.
40 A virtual experimental currency, with a conversion factor of “Zuz” 50,000 = NIS 1.
41 For example, for such individual considering a budget constraint of NIS 2 million:
42 This is very close to the actual conversion factor in various countries such as Israel and the United States.
43 The specific payoff function was set as follows:
44 Equivalent to 16.6 in yearly terms and representing the price of the annuity.
45 See Appendix E.
46 See https://www.geokg.com/en/.
47 Senior managers are chief executive officers or vice presidents of pension funds and insurance corporations, either in the present or in the past.
48 Participants were recruited through advertisements and emails from the academic staff at both Universities. We began collecting the data in January 2020, but alas due to the COVID-19 outbreak we were only able to complete the experiment in 2022.
49 Our sample is similar to Israel Central Bureau of Statistics (CBS), Population Census (2017). For instance, 48.7% of our sample is male (48.9% in the population census), 60.2% of men are married (56% in the population census), and 54% of women are married (same as the population census).
50 Our robustness tests also show that individuals with high self-reported financial literacy are more likely to withdraw lump-sum amounts (possibly due to confidence in their ability to perform other investments).
References
- (2009) Time perspective, personality and smoking, body mass, and physical activity: An empirical study. British J. Health Psych. 14(1):83–105.Crossref, Google Scholar
- (2008) Who chooses annuities? An experimental investigation of the role of gender, framing, and defaults. Amer. Econom. Rev. 98(2):418–422.Crossref, Google Scholar
- (1995) Professional traders as intuitive Bayesians. Organ. Behav. Human Decision Processes 64(2):185–202.Crossref, Google Scholar
- (2001) The hyperbolic consumption model: Calibration, simulation, and empirical evaluation. J. Econom. Perspective 15(3):47–68.Crossref, Google Scholar
- (2006)
Asset liability management . The Oxford Handbook of Pensions and Retirement Income (Oxford University Press, Oxford, UK), 417–440.Google Scholar - (2022) Seven jobs in a lifetime? An analysis of employee tenure. Econom. Inquiry 60(2):543–567.Crossref, Google Scholar
- (1988) A theory of rational addiction. J. Political Econom. 96(4):675–700.Crossref, Google Scholar
- (2011) Annuitization puzzles. J. Econom. Perspective 25(4):143–164.Crossref, Google Scholar
- (2020) Robo-advisor adoption, willingness to pay, and trust-before and at the outbreak of the COVID-19 pandemic. Working paper, Hebrew University of Jerusalem, Israel.Google Scholar
- (1991) How strong are bequest motives? Evidence based on estimates of the demand for life insurance and annuities. J. Political Econom. 99(5):899–927.Crossref, Google Scholar
- (2014) What makes annuitization more appealing? J. Public Econom. 116:2–16.Crossref, Google Scholar
- (2008) Pension fund regulation and risk management: Results from an ALM optimisation exercise. OECD Working Papers on Insurance and Private Pensions, No. 8, OECD Publishing, Paris.Google Scholar
- (2015) Intergenerational transfer of time and risk preferences. J. Econom. Psych. 49:187–204.Crossref, Google Scholar
- (2001) Longevity-insured retirement distributions from pension plans: Market and regulatory issues. NBER Working Paper No. 8064, National Bureau of Economic Research, Cambridge, MA.Google Scholar
- (2016) Framing and claiming: How information-framing affects expected social security claiming behavior. J. Risk Insurance 83(1):139–162.Crossref, Google Scholar
- (2017) Cognitive constraints on valuing annuities. J. Eur. Econom. Assoc. 15(2):429–462.Crossref, Google Scholar
- (2008) Why don’t people insure late-life consumption? A framing explanation of the under-annuitization puzzle. Amer. Econom. Rev. 98(2):304–309.Crossref, Google Scholar
- (2021) Behavioral impediments to valuing annuities: Complexity and choice bracketing. Rev. Econom. Statist. 103(3):533–546.Crossref, Google Scholar
- (2007) The choice between an annuity and a lump sum: Results from Swiss pension funds. J. Public Econom. 91(10):1944–1966.Crossref, Google Scholar
- (2013) What determines annuity demand at retirement? Geneva Papers Risk Insurance Issues Practices 38(4):777–802.Crossref, Google Scholar
- (2012) How do retirees value life annuities? Evidence from public employees. Rev. Financial Stud. 25(8):2601–2634.Crossref, Google Scholar
- (1991) Rational addictive behavior and cigarette smoking. J. Political Econom. 99(4):722–742.Crossref, Google Scholar
- (2015) The origins of savings behavior. J. Political Econom. 123(1):123–169.Crossref, Google Scholar
- (2008) Preference heterogeneity and insurance markets: Explaining a puzzle of insurance. Amer. Econom. Rev. 98(2):157–162.Crossref, Google Scholar
- (2005) Annuities and individual welfare. Amer. Econom. Rev. 95(5):1573–1590.Crossref, Google Scholar
- (2005) Job search and impatience. J. Labor Econom. 23(3):527–588.Crossref, Google Scholar
- (2011) Individual risk attitudes: Measurement, determinants, and behavioral consequences. J. Eur. Econom. Assoc. 9(3):522–550.Crossref, Google Scholar
- (1999) Prudence, risk aversion, and the demand for life insurance. Appl. Econom. Lett. 6(4):239–242.Crossref, Google Scholar
- (2021) Why do life insurance policyholders lapse? The roles of income, health, and bequest motive shocks. J. Risk Insurance 88(4):937–970.Crossref, Google Scholar
- (2004) Adverse selection in insurance markets: Policyholder evidence from the UK annuity market. J. Political Econom. 112(1):183–208.Crossref, Google Scholar
- (1990) The cost of annuities: Implications for saving behavior and bequests. Quart. J. Econom. 105(1):135–154.Crossref, Google Scholar
- (1980) Time preference and health: An exploratory study. NBER Working Paper No. 0539, National Bureau of Economic Research, Cambridge, MA.Google Scholar
- (2002) How well does a partnership in pensions really work? The Israeli public/private pension mix. Ageing Soc. 22(2):161–183.Crossref, Google Scholar
- (2008) Australia’s disappearing market for life annuities. Working paper, University of New South Wales, Sydney, Australia.Google Scholar
- (2019) Thinking about prices vs. thinking about returns in financial markets. J. Finance 74(6):2997–3039.Crossref, Google Scholar
- (2016) The illusion of wealth and its reversal. J. Marketing Res. 53(5):804–813.Crossref, Google Scholar
- (2003) To insure or not to insure?: An insurance puzzle. Geneva Papers Risk Insurance Theory 28(1):5–24.Crossref, Google Scholar
- (2021) Wealth and insurance choices: Evidence from US households. NBER Working Paper No. 29069, National Bureau of Economic Research, Cambridge, MA.Google Scholar
- (2015) The determinants of annuitization: Evidence from Sweden. Internat. Tax Public Finance 22(4):549–578.Crossref, Google Scholar
- (1993) Modeling loss aversion and reference dependence effects on brand choice. Marketing Sci. 12(4):378–394.Link, Google Scholar
- Holden S, VanDerhei J, Bass S (2021) 401(k) plan asset allocation, account balances, and loan activity in 2018. ICI Res. Perspect. 27(2).Google Scholar
- (2020) What drives risk perception? A global survey with financial professionals and laypeople. Management Sci. 66(9):3977–4002.Link, Google Scholar
- (2007) Behavioral obstacles in the annuity market. Financial Anal. J. 63(6):71–82.Crossref, Google Scholar
- (2020) An investigation of time preferences, life expectancy, and annuity vs. lump sum choices: Can smoking harm long-term saving decisions? J. Econom. Behav. Organ. 180:812–825.Crossref, Google Scholar
- (2022) Testing methods to enhance longevity awareness. J. Econom. Behav. Organ. 204:466–475.Crossref, Google Scholar
- (2020) Unintended consequences of minimum annuity laws: An experimental study. J. Econom. Behav. Organ. 169:208–222.Crossref, Google Scholar
- (2011) How deep is the annuity market participation puzzle? Rev. Financial Stud. 24(1):279–319.Crossref, Google Scholar
- (2015) Modeling the Joint Distribution of Income and Wealth (Emerald Group Publishing Limited, Leeds, UK).Crossref, Google Scholar
- (2006) Evidence on preferences and subjective beliefs of risk takers: The case of smokers. Internat. J. Industry Organ. 24(4):667–682.Crossref, Google Scholar
- (2016) Health and mortality delta: Assessing the welfare cost of household insurance choice. J. Finance 71(2):957–1010.Crossref, Google Scholar
- (1981) The family as an incomplete annuities market. J. Political Econom. 89(2):372–391.Crossref, Google Scholar
- (2013) Time preferences and health behaviour: A review. Agricultural Food Econom. 1(1):1–19.Google Scholar
- Leuven E, Sianesi B (2018) PSMATCH2: Stata module to perform full Mahalanobis and propensity score matching, common support graphing, and covariate imbalance testing.Google Scholar
- (2012) Bequest motives and the annuity puzzle. Rev. Econom. Dynamics 15(2):226–243.Crossref, Google Scholar
- (1989) Anomalies: Intertemporal choice. J. Econom. Perspective 3(4):181–193.Crossref, Google Scholar
- (2022) Evidence from unique Swiss tax data on the composition and joint distribution of income and wealth. Measuring Distribution Mobility Income Wealth 80:105.Google Scholar
- (2010)
International adverse selection in life insurance and annuities . Ageing in Advanced Industrial States (Springer, Berlin), 119–135.Crossref, Google Scholar - (1999) New evidence on the money’s worth of individual annuities. Amer. Econom. Rev. 89(5):1299–1318.Crossref, Google Scholar
- (2006) Why do dancers smoke? Smoking, time preference, and wage dynamics. East. Econom. J. 32(4):595–616.Google Scholar
- (1999a) Addiction and self control. Elster J, ed. Addiction: Entries and Exits (Russell Sage Foundation, New York), 169–206.Google Scholar
- (1999b) Doing it now or later. Amer. Econom. Rev. 89(1):103–124.Crossref, Google Scholar
- (2013) Accounting for non-annuitization. J. Public Econom. 98:53–67.Crossref, Google Scholar
- (2015) Optimal annuitization with stochastic mortality and correlated medical costs. Amer. Econom. Rev. 105(11):3273–3320.Crossref, Google Scholar
- (2009) Adverse selection in annuity markets: Evidence from the British life annuity act of 1808. J. Public Econom. 93(5–6):776–784.Crossref, Google Scholar
- (2006) Competition and cooperation in divisible good auctions: An experimental examination. Rev. Financial Stud. 19(1):195–235.Crossref, Google Scholar
- (2011) Heterogeneous rates of time preference and the decision to smoke. Econom. Inquiry 49(4):959–992.Crossref, Google Scholar
- (2016) Time inconsistent preferences and the annuitization decision. J. Econom. Behav. Organ. 129:37–55.Crossref, Google Scholar
- (1988) The behavioral life-cycle hypothesis. Econom. Inquiry 26(4):609–643.Crossref, Google Scholar
- (2001) Do smokers respond to health shocks? Rev. Econom. Statist. 83(4):675–687.Crossref, Google Scholar
- (2017) Finance for Normal People: How Investors and Markets Behave (Oxford University Press, Oxford, UK).Google Scholar
- (1985) Mental accounting and consumer choice. Marketing Sci. 4(3):199–214.Link, Google Scholar
- (1990) Anomalies: Saving, fungibility, and mental accounts. J. Econom. Perspective 4(1):193–205.Crossref, Google Scholar
- (1999) Mental accounting matters. J. Behav. Decision Making 12(3):183–206.Crossref, Google Scholar
- (2020) Bubbles and financial professionals. Rev. Financial Stud. 33(6):2659–2696.Crossref, Google Scholar
- (1965) Uncertain lifetime, life insurance, and the theory of the consumer. Rev. Econom. Stud. 32(2):137–150.Crossref, Google Scholar
- (2018) Perspectives on mental accounting: An exploration of budgeting and investing. Financial Planning Rev. 1(1–2):e1011.Crossref, Google Scholar