


The Engineering of Consumer Experiences Under Affect Assimilation and Quality Contrast
Abstract
Consumer experiences are inherently dynamic. When engaging in a sequence of activities, consumers are influenced by past experiences in two ways: negatively by their objective quality, through quality contrast; and positively by their subjective appreciation of them, through affect assimilation. How should experience curators sequence activities to maximize consumer satisfaction in the presence of such intertemporal effects? We formulate an experience curator’s problem as a dynamic optimization program. We show that, because of affect assimilation, the best activity may be scheduled at the beginning or in the middle of an experience, in contrast to the common peak-end rule—this provides a rationale for the saying that “first impressions matter.” Under uncertainty, it may be valuable to save the best activity as a “wild card” to recover from bad outcomes. We calibrate our model to four distinct experiential contexts (namely, watching movies, reading books, visiting touristic attractions, and eating out) and consistently find the presence of both quality contrast and affect assimilation. Through a counterfactual study in the context of touristic tours, we show that experience curators may significantly benefit from offering different fixed sequences to different types of consumers, but they tend to gain little from dynamically adjusting them.
This paper was accepted by David Simchi-Levi, operations management.
Funding: This work was supported by the Agencia Estatal de Investigación [Grant PID2020-116135GB-I00 MCIN/AEI/10.13039/50110001].
Supplemental Material: The online appendix and data files are available at https://doi.org/10.1287/mnsc.2023.02150.
1. Introduction
In many business-to-consumer (B2C) service experiences, sequence matters (Dasu and Chase 2013). Given the salience of intertemporal effects, how should experience curators sequence different activities in an experience to maximize consumer satisfaction? Theories of memory decay or adaptation (quality contrast) suggest that it is optimal for the overall experience to “finish strong” (Kahneman et al. 1993, Das Gupta et al. 2015), ending with the highest-quality activity. However, the theory of affect assimilation suggests that consumers’ affect (a generic term to denote mood or emotion) may “assimilate” into their future evaluations of activities (Schwarz and Clore 1983, 2003; Forgas 1995). We adopt an engineering approach to optimize the sequences of experiences for maximizing consumer satisfaction, empirically grounding our model in thousands of user experience ratings spanning four distinct experiential domains.
To contextualize this conundrum, consider the example illustrated in Figure 1. A tour operator curates a four-day tour package in Barcelona for Tourists 1 and 2. Both tours include visits to Montjuïc and Antoni Gaudí’s Sagrada Familia on the first two days, sequenced identically. Both tourists like these attractions equally, each rating Montjuïc with 4/5 and Sagrada Familia with 5/5. On the third day, the tour operator schedules different attractions: Tourist 1 is taken to Park Güell, whereas Tourist 2 visits the Gothic Quarter. Our data show that these attractions historically received, respectively, 47% and 67% of top-star (i.e., 5/5) ratings. The former enjoys Park Güell immensely, giving it a rating of 5/5, whereas the latter finds the Gothic Quarter less exciting, resulting in a rating of 3/5. On their final day, both visit Camp Nou. Given the divergence in their Day 3 experiences—Tourist 1’s elation versus Tourist 2’s disappointment—how differently would they enjoy their Camp Nou visit? If disappointment carries over and dampens Tourist 2’s enjoyment of Camp Nou, but elation elevates Tourist 1’s, the tour operator faces competing forces: objective quality contrast pulling toward finishing strong and subjective affect assimilation pushing toward starting strong.
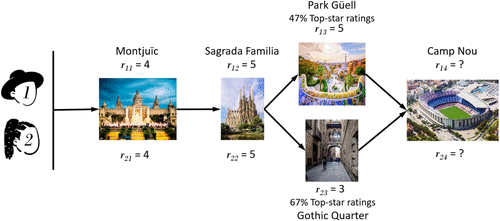
Note. Here, denotes individual i’s rating, out of a maximum of five, of their jth activity, .
1.1. Research Question
How should experience curators sequence their offerings in the presence of affect assimilation and quality contrast? We define quality contrast as objective, based on the deterministic quality of an individual’s past activities. We hypothesize that quality contrast has a negative spillover effect: a hypothesis confirmed through our model calibration. Affect assimilation, on the other hand, is subjective and based on an individual’s stochastic satisfaction from past activities. We hypothesize that affect assimilation has a positive spillover effect, which is also empirically validated. Because affect transitions are inherently stochastic, the optimal policy is dynamic (i.e., closed loop). However, experience curators may be constrained to offer only static sequences (i.e., open loop). If so, what is the optimal static sequence? What is the value of tailoring it to different consumers? Avoiding dynamic adjustments to activity sequencing comes at what cost of consumer utility?
1.2. Methodology
To address these service experience design challenges, we build a finite-horizon dynamic optimization problem, calibrate it with real data, and investigate the value of personalizing sequences in a counterfactual study. In Section 3, we model an individual consumer’s instantaneous utility dependent on (i) the current activity’s quality, (ii) a consumer’s fixed effect, (iii) a positive spillover due to affect assimilation, anchored on the consumer’s satisfaction from past activities, and (iv) a negative spillover due to quality contrast anchored on the quality of past activities. Both assimilation and quality contrast reference points adapt over time. In Section 4, we characterize the sequences that maximize the discounted sum of instantaneous utilities in a static, open-loop fashion or dynamic, closed-loop fashion.
The practical applicability of our optimization model depends on whether affect assimilation, although robustly demonstrated in laboratory settings (Schwarz and Clore 1983, 2003; Forgas 1995), exerts meaningful influence in real-world service experiences. Accordingly, in Section 5, we calibrate our model in four real experiential contexts: watching movies, reading books, visiting touristic attractions, and eating out. In each setting, we sample a large set of users, retrieve their entire online review history, and assess the magnitude of affect assimilation and quality contrast, using a two-stage Heckman selection model and including attribute and temporal similarity moderators.
Using these empirical estimates, we develop a counterfactual study in Section 6 focused on a seven-activity touristic trip. Considering a population of consumers, we assess the value of offering different static sequences to different groups of consumers (relative to offering the same sequence to everyone) and the value of dynamically adjusting the sequences to their changing affect levels.
Finally, an Online Appendix contains additional materials including analytical proofs and empirical analysis details.
1.3. Results
We first show that the optimal dynamic (closed-loop) policy coincides with the optimal static (open-loop) policy when the probability of being satisfied from an activity depends linearly on the utility derived from it (Theorem 1). In that case, the optimal sequence has either an N-shape or an inverted N-shape (Proposition 1). An interior peak is optimal only with affect assimilation. Indeed, without it, the optimal sequence is a U-shape (Corollary 1), degenerating into a crescendo (the “peak-end” rule) or decrescendo. Without quality contrast, the peak activity should be placed early enough to impact future utility over a sufficiently large time window, consistent with the saying that “first impressions matter,” but not too early in case consumers experience “tough luck” that significantly drops their affect (Corollary 2). Without time discounting, the peak activity may also lie in the interior of the sequence if affect adapts faster than the baseline quality reference level (Corollary 3), to benefit from affect assimilation without being hurt by quality contrast.
When the probability of being satisfied from an activity depends nonlinearly on the utility derived from it, the optimal closed-loop policy usually differs from the open-loop optimum. Absent quality contrast, the optimal open-loop sequence tends to have an inverted U-shape (Proposition 3), as with linear probabilities (Corollary 2). Because the marginal value of an activity’s quality level is the strongest whenever the consumer’s affective state is the most sensitive to it (Proposition 2), an experience curator may want to keep a few high-quality activities in reserve, in case the consumer’s affect level drops unexpectedly, and then use them as “wild cards.”
Empirically, we find that both affect assimilation and quality contrast are statistically significant across all four contexts, and they tend to be less salient across more dissimilar activities or as time goes by. This empirical exercise across four contexts validates the development of our analytical framework and illustrates how customers’ sensitivity to past experiences can be measured in practice.
In our seven-activity counterfactual study, we find that, out of the possible 7! scheduling policies, only 53 sequences are dominating. The open-loop policy that maximizes the average satisfaction across the entire population is a crescendo, but it is also the worst for certain types of visitors. Specifically, we identify two key customer segments: those who react strongly to experiences—either negatively or positively—benefit most from decrescendo sequences (best experiences first), whereas those with more moderate reactions prefer crescendo sequences. Importantly, customers can be sorted into these segments in advance by examining their online responses to previous experiences. This suggests that flexibility—specifically, the possibility of offering different sequences to different consumer segments—can deliver significant value. In contrast, we find that dynamically adjusting a sequence to individuals’ evolving affect offers only limited benefit.
Overall, our work offers a framework to engineer service experiences in the presence of affect assimilation and quality contrast by combining a theoretical model with an estimation procedure and offering insights into the value of personalization of experience sequences.
2. Related Literature
Our work lies at the intersection of the literature on the intertemporal effects in service experience design and the literature on affect assimilation. From a methodological standpoint, we draw on the literature of online reviews in our model calibration. We next review these three streams.
2.1. Intertemporal Effects in Service Experience Design
A large body of experimental studies in social psychology has revealed that consumers’ preferences for consumption sequences may defy a simple decreasing pattern (as is prescribed by the discounted utility paradigm), both in prospective (Loewenstein and Prelec 1993) and retrospective evaluations (Ross and Simonson 1991, Chen and Rao 2002), distinguishing between experienced and recalled satisfaction (Kahneman et al. 1997). Building on this literature, Verhoef et al. (2004), Dasu and Chase (2013), Karmarkar and Karmarkar (2014), Dixon and Verma (2013), and Dixon et al. (2017) have underscored the potential for engineering service experiences to maximize customer satisfaction.
This literature provides insights on service experience design, by leveraging various biases in (i) the way utilities are aggregated, for example, the primacy-recency effect (Garnefeld and Steinhoff 2013), the peak-end rule (Kahneman et al. 1993), the preference for specific trends (Varey and Kahneman 1992), memory decay (Montgomery and Unnava 2009), negative time discounting (Loewenstein and Prelec 1991), and activity-specific time discounting Li et al. (2022); and (ii) the way utilities are formed, for example, expectancy disconfirmation (Oliver 1980), adaptation and contrast (Helson 1948, Tversky and Griffin 1991, Baucells and Sarin 2010), which relate to habituation (Constantinides 1990, Wathieu 1997), loss aversion or gain seeking (Aflaki and Popescu 2014, Chen et al. 2024), satiation (Baucells and Sarin 2007), difficulty and reward (Li et al. 2023), fatigue (Baucells and Zhao 2019), and preferences for variation or surprise (Gilboa 1989, Ely et al. 2015). U-shaped sequences are optimal with adaptation and memory decay (Das Gupta et al. 2015) or satiation (Baucells and Sarin 2010); interior peaks are optimal with nonlinear utilities (Chen et al. 2024) or when peaks are more memorable (Li et al. 2022); and N-shapes are optimal with stocks of difficulty and reward (Li et al. 2023). We contribute to this rich literature, first, by modeling affect assimilation, as a counterpart to quality contrast, in how utilities are formed; and second, by documenting in four different experiential contexts the salience of both affect assimilation and quality contrast in shaping consumer satisfaction.
We report moderating effects of temporal proximity and activity similarity on quality contrast. The former is consistent with Croson and Donohue (2006), Chan et al. (2021), and Cassar and Ko (2023). The latter is consistent with Nosofsky (1986), Posner and Petersen (1990), and Bleichrodt et al. (2009) who find or postulate greater salience of references that belong to the same mental category as a focal item or share many common attributes with it, potentially negatively affecting ratings of consecutive activities on TripAdvisor, as shown by Teichert et al. (2021).
2.2. Affect Assimilation
The psychology literature has established how affect infuses judgment, particularly in evaluative contexts where individuals assess experiences and interpret unstructured information, significantly influencing their perceptual and evaluative outcomes (Forgas 1995). Schwarz and Clore (1983), Sinclair and Mark (1995), and Reber et al. (1998), among others, have provided a robust empirical foundation for affect infusion, demonstrating its salience in controlled laboratory settings using standardized mood scales (Watson et al. 1988, Russell et al. 1989). In management, affect infusion—specifically, emotions—has been shown to impact the response to advertising (Labroo and Ramanathan 2007, Guido et al. 2018, Rocklage and Fazio 2020).
Affect infusion may be positive (“assimilation”) or negative (“contrast”) (Schwarz and Clore 1983, 2003; Forgas 1995). Affect assimilation leads individuals with positive emotions to underestimate negative outcomes and overestimate positive ones (Johnson and Tversky 1983) and to exhibit more loss aversion (Isen et al. 1988). Affect contrast may arise because of self-regulation; that is, people may wish to engage in pleasurable activities (Gross 2014) or recall positive memories (Parrott and Sabini 1990) to try to repair negative emotions. Although our modeling framework assumes affect assimilation, and not contrast, we validate this assumption empirically across four contexts.
Our contribution to this experimental psychology literature is twofold. First, we embed the well-documented effects of affect assimilation on subjective evaluations of experiences into a prescriptive model of service experience design to maximize consumer satisfaction. Second, we document the salience of affect assimilation across thousands of individuals in four distinct experiential contexts—departing from the small-scale, focused laboratory experiments in the literature.
Our study also explores moderating factors of affect assimilation, such as activity similarity and time. Indeed, attributes such as perceptual and conceptual fluency suggest that activities with thematic similarities enhance affect assimilation more than dissimilar ones (Reber et al. 1998, Schwarz and Clore 2003). Time also matters, given the distinction between intense, short-lived emotions with clear antecedents, and diffused, enduring moods without a specific cause (Forgas 1995). In particular, the closeness in time of experiences appears to amplify the impact of affect (Labroo and Ramanathan 2007). We validate both moderating roles in our empirical study based on observational data.
2.3. Analysis of Online Reviews
From a methodological standpoint, our work builds on the following two literatures: predictive models in recommendation systems and the marketing implications of consumer reviews on future sales.
2.3.1. Predictive Models in Recommendation Systems.
This literature is often classified as being either content-based (Wang et al. 2018) or adopting the collaborative filtering paradigm (Asghar 2016, Khan et al. 2021). Drawing on the latter stream, we adopt the canonical model by Lemire and Maclachlan (2005), which predicts user ratings taking into account the average deviation of ratings across users, by incorporating a measure of consumer agreeableness and the similarities between activities. Our investigation diverges from the predictive intent of these models. Specifically, we seek to elucidate the underlying drivers of user ratings by analyzing historical user data, considering reference-dependent preferences (Lattin and Bucklin 1989) and multiattribute decision making (Tereyağoğlu et al. 2018). Consequently, our focus shifts from predictive accuracy toward the statistical significance of the variables that influence rating behavior.
2.3.2. Impact of Reviews on Future Sales.
The marketing literature provides evidence for a positive correlation between past reviews and future sales (Chevalier and Mayzlin 2006, Dellarocas et al. 2007, You et al. 2015). Analyzing review distributions, including their polarity (Schoenmueller et al. 2020), volume (Liu 2006), and reviewer characteristics (Forman et al. 2008, Wu et al. 2021), offers additional insights into consumer behavior. For instance, consumers prefer to post reviews on more niche products (Dellarocas et al. 2010), and their reviews tend to be more critical as they become more experienced (Goes et al. 2014). This discourse is complicated by biases in purchasing and reviewing patterns (Hu et al. 2017), the impact of incentives to mitigate such biases (Marinescu et al. 2021), and the influence of early reviews on subsequent ones (Moe and Schweidel 2012, Lee et al. 2015). The existence of fake reviews adds further challenges to the analysis (Mayzlin et al. 2014).
Unlike these studies, we focus on individual users and their review history, diverging from the aggregate analysis prevalent in the literature. To account for the aforementioned challenges in review analysis, we employ a comprehensive control strategy, including a Heckman correction for selection bias, and controls of review quantity and activity age, among others. More fundamentally, our objective is not to predict future sales by other customers but to assess the statistical significance of affect assimilation and quality contrast in consumer utilities.
3. A Model of Consumption Utility with Intertemporal Spillovers
An individual consumer i, characterized by a certain degree of agreeableness (representing a tendency to be easily pleased or not), experiences several activities in a sequence. The jth activity experienced by consumer i, at time , has an inherent objective quality and attributes . The variables and take the same value across all individuals. In the absence of intertemporal spillover, the expected utility consumer i derives from their jth activity is a linear function of their agreeableness and the activity’s quality , given some controls (including ):
Let be consumer i’s satisfaction from their jth activity (which could be measured as their rating). Satisfaction is derived by comparing the utility from the activity () to an outside option, generating utility , identical across all individuals. Similar to McFadden (1974) and Train (2009), we consider the following binary model of satisfaction. If is higher that , ; otherwise, . Denote the probability that the consumer’s satisfaction is equal to one as
With a probit specification (which we use in Section 5), is the cumulative distribution function (c.d.f.) of the normal distribution. With a logit specification, Let denote the complementary distribution. This binary framework can in principle be generalized to multilevel discrete or continuous satisfaction states, but potentially impeding the tractability of the analysis.
Consumer utility may also be influenced by intertemporal spillover effects, such as affect assimilation and quality contrast. Although quality contrast has been extensively modeled in the decision analysis literature (see Section 2), affect assimilation has, to the best of our knowledge, never been modeled. We do so in parallel fashion to quality contrast, to emphasize their dual nature: whereas quality contrast captures a deterministic negative spillover, affect assimilation captures a stochastic positive spillover. Let denote consumer i’s affect level upon consuming the jth activity in their sequence and denotes their base quality reference level evaluated at the same time. Consumer i’s expected utility from the jth activity in the sequence is thus postulated to be equal to
Although most quality contrast models in the literature assume that (making the utility a function of ), we allow for a more general form here. The formulation can easily be extended to account for nonlinear relationships, for example, because of loss aversion or gain seeking (Aflaki and Popescu 2014, Chen et al. 2024). We next describe in greater details the effect and dynamics of affect assimilation and quality contrast and their moderating factors.
3.1. Affect Assimilation
The term in (3) captures the random (subjective) shock of past experiences on current satisfaction, through the consumer’s affect level. Because affect has been reported to engender a positive spillover (i.e., to assimilate) in subsequent evaluations, we make the following modeling assumption, which we will validate in Section 5.
The higher the affect level , the higher , that is, .
3.2. Quality Contrast
The term in (3) captures the deterministic (objective) effect of past choices on current satisfaction, through the quality baseline. Consistent with adaptation theory (Helson 1964), which suggests negative spillovers (e.g., experiencing a high-quality activity sets a high baseline, making it harder to be satisfied in the future), we make the following modeling assumption, which we will validate in Section 5.
The higher the quality baseline , the lower , that is, .
3.3. Adaptation
Similar to Wathieu (1997), we assume that the quality baseline adapts linearly to past qualities. Symmetrically, we consider an adaptative process of affect to the satisfaction from past activities. Accordingly, for some rates , we assume
Given (4), the construct of affect encompasses any mechanism that led the consumer to positively rate past activities unobserved by an econometrician such as weather, congestion, and personal state of mind. Although we do not observe whether individual consumers were effectively happy or not, we do observe that they rated positively or negatively their past activities.
3.4. Moderating Effects of Time and Content Overlap
The impact of affect assimilation and quality contrast is moderated by both the attribute similarity and temporal proximity between activities. Accordingly, we can expand (3) to account for these moderating factors, that is,
Consistent with the literature streams reviewed in Sections 2.1 and 2.2, affect assimilation and quality contrast tend to be stronger when the degree of attribute similarity or temporal proximity between consecutive activities increases, and vice versa. Consequently, we expect the following relation to hold.
As the attribute and time distance between the focal and the previous activities increases, affect assimilation and quality contrast diminish, that is, and .
4. Optimal Activity Sequencing
We formulate the dynamic (closed-loop) and static (open-loop) versions of the activity sequencing optimization problem in Section 4.1. In Section 4.2, we consider a special case with linear transition probabilities and fully characterize its optimal solution. In Section 4.3, we characterize the value function and the optimal open-loop policy with nonlinear transition probabilities, but no quality contrast.
4.1. Decision Problem
We consider an experience curator who seeks to select and schedule T activities of different qualities from a set , each lasting one period, to maximize an individual consumer’s discounted sum of expected utilities. Each activity can be assigned at most once and there are no precedence constraints. By creating duplicates of activities in , one could also optimize their durations.
Consistent with (3) and Hypotheses 1 and 2, we consider a linear utility derived from an activity with quality : , with . The state at the beginning of period t is , in which denotes the consumer’s affect and their quality baseline attained before experiencing the activity in period t, updated according to (4)–(5). Let be the consumer’s initial state.
Time is discounted by a factor . The consumer discounts the future if , as in Baucells and Sarin (2007), or the past if , as in Kahneman et al. (1997) and Das Gupta et al. (2015)—what Loewenstein and Prelec (1991) call “negative time discounting.”
We consider two formulations of the problem, depending on whether the experience curator is free to dynamically choose the set of activities in response to the consumer’s affect level (closed loop) or whether they are constrained to commit to a fixed sequence beforehand (open loop), for example, because some activities need to be booked in advance. In contrast to the baseline quality reference level (), which evolves deterministically, the affect level () evolves stochastically. Accordingly, the closed-loop and open-loop policies are different from each other in general.
4.1.1. Closed-Loop Optimization.
In the closed-loop optimization problem formulation, activities are dynamically selected given the current state . Let be the collection of activities that have not been assigned yet, with . The consumer’s discounted sum of expected utilities at time 0 can be expressed as , where
4.1.2. Open-Loop Optimization.
In the open-loop optimization problem formulation, the experience curator needs to commit to a fixed sequence beforehand. For any fixed sequence of activities defined recursively as for and , the consumer’s discounted sum of expected utilities from period t onward equals
Accordingly, the experience curator selects the sequence of activities to
Let be the optimal open-loop sequence of activities.
4.2. Linear Probabilities
Assume that the probability of being satisfied with an activity and positively rating it is linear in the instantaneous expected utility, that is, . In other words, assume that the noise in (1) is uniformly distributed. This probability is well defined when and , which is without loss of generality given that the activities’ qualities can be rescaled and shifted.
We first show that when , the value function is linear in . Moreover, in this linear reformulation, only the constant term depends on the choice set .
When , for with
Using this linear decomposition of the value function, we next show that the solutions to the closed-loop problem (7)–(8) and to the open-loop problem (11) coincide. Therefore, when , the optimal sequence can be determined upfront and is independent of the initial state . In other words, when , dynamically adjusting a sequence to a consumer’s changing affect level offers no benefit, nor does offering different static sequences to different consumers.
When , Problem (7)–(8) and Problem (11) share the same optimal solution. The solution solves with given by (13) for .
According to Theorem 1, the optimal sequence can be identified in a greedy fashion. Specifically, the highest-quality activity should be scheduled in the period that is associated with the highest weight , the second-highest-quality activity in the period associated with the second-highest weight , and so on.
The next proposition shows that, in its most general form, the optimal sequence of activity qualities has either an N-shape or an inverted N-shape. An N-shape is such that activity qualities first increase, then decrease, to later increase, and vice versa for an inverted N-shape. Because N- or inverted N-shapes degenerate into U- or inverted U-shapes, and the latter degenerate into a crescendo or a decrescendo, this characterization effectively excludes cases with more than one interior minimum (e.g., W-shape) or more than one interior maximum (e.g., inverted W-shape). In a different context, Li et al. (2023) show that (inverted) N-shapes can emerge when trading off stocks of rewards and difficulty.
When , the optimal sequence of activity qualities has an N-shape if , and an inverted N-shape otherwise.
Because the optimal open-loop policy does not depend on the initial state , the optimal sequence from t to T is the same as if the experience lasted only periods. In other words, the location of the peak or trough in the (inverted) N-shape is independent of the experience duration, provided that it is long enough. For example, an inverted U-shape, whose peak is attained five periods before the end, degenerates into a decrescendo if the experience lasts less than five periods.
To generate further insights into these (inverted) N-shaped structures, we next consider particular cases of Proposition 1, namely, when (Corollary 1), when (Corollary 2), and when (Corollary 3). Table 1 illustrates the optimal sequences that emerge under the conditions of the following corollaries, assuming that and for .
|

Table 1. Examples of Optimal Sequences
| Parameters | Result | Optimal sequence | |||||||||||||||
|---|---|---|---|---|---|---|---|---|---|---|---|---|---|---|---|---|---|
| 1.27 | −1.83 | 1.74 | 0.27 | 0.95 | Proposition 1 | −0.42 | −0.41 | −0.42 | −0.45 | −0.47 | 0.57 | 4 | 5 | 3 | 2 | 1 | 6 |
| 0.10 | −0.90 | 0.92 | 0.90 | 0.13 | 1.17 | 1.15 | 1.14 | 1.15 | 1.15 | 1.09 | 6 | 4 | 2 | 3 | 5 | 1 | |
| 0 | −0.67 | 1.93 | 0.59 | 0.61 | Corollary 1 | −0.03 | −0.04 | −0.06 | −0.05 | 0.06 | 0.52 | 4 | 3 | 1 | 2 | 5 | 6 |
| 0.67 | 0 | 1.60 | 0.79 | 0.17 | Corollary 2 | 0.42 | 0.52 | 0.62 | 0.70 | 0.72 | 0.62 | 1 | 2 | 3 | 5 | 6 | 4 |
| 1.90 | 0 | 1.30 | 0.10 | 0.70 | 0.79 | 0.75 | 0.73 | 0.73 | 0.74 | 0.77 | 6 | 4 | 2 | 1 | 3 | 5 | |
| 1.20 | −0.90 | 1 | 0.27 | 0.40 | Corollary 3 | 1.14 | 1.07 | 1.01 | 0.97 | 0.96 | 1.00 | 6 | 5 | 4 | 2 | 1 | 3 |
| 0.30 | −0.30 | 1 | 0.80 | 0.50 | 1.02 | 1.04 | 1.06 | 1.08 | 1.09 | 1.00 | 2 | 3 | 4 | 5 | 6 | 1 | |
Note. such that for .
Our first result confirms that, without affect assimilation, the optimal sequence is U-shaped.
When , if , the optimal sequence of activity qualities has a U-shape. Moreover, there exists a threshold on the discount factor and, for each , a threshold on the experience duration such that the U-shape degenerates into
When , a decrescendo, for any T;
When , a crescendo if ;
When , a crescendo, for any T; and
When , a crescendo if .
Corollary 1 generalizes Das Gupta et al. (2015) by considering (i) arbitrary levels of quality contrast (i.e., not only ) and (ii) both backward and forward time discounting (i.e., not only . A U-shape emerges over two disjoint intervals, either when or when , provided the experience is long enough (). In the former case, the U-shape emerges to create a steep incline at the end, which will be remembered the most, similar to Das Gupta et al. (2015). In the latter case, the U-shape is driven by the consumer’s impatience, which makes them want to consume high-quality activities early. In fact, this latter U-shape degenerates into a decrescendo when consumers heavily discount the future (when ). Between these two disjoint intervals, that is, when the consumer mildly discounts both the future and the past (), a crescendo is optimal.
We obtain from Corollary 1 that interior peaks arise only when affect assimilation is salient, under the assumptions that the discount factor is common across activities (unlike Li et al. (2022)) and utilities are linear (unlike Chen et al. (2024)). The next two lemmas show that interior peaks still arise even without quality contrast (, Corollary 2) or without time discounting (, Corollary 3).
When , if , the optimal sequence of activity qualities has an inverted U-shape if and a U-shape if .
When , there exist a threshold on the discount factor and, for each , a threshold on the experience duration such that the inverted U-shape degenerates into
When , a decrescendo, for any T;
When , a decrescendo if ; and
When , a crescendo, for any T.
When , there exist a threshold on the discount factor and, for each , a threshold on the experience duration such that the U-shape degenerates into
When , a decrescendo, for any T; and
When , a crescendo if .
To interpret Corollary 2, we focus on the case where affect has a lesser impact than the focal activity’s quality, that is, , which is reasonable in practice (Section 5). In this case, the optimal sequence is an inverted U-shape. It degenerates into a crescendo if consumers heavily discount the past, that is, if ; and into a decrescendo either if they discount the future, that is, or if the experience has a short duration, that is, . Experiencing a high-quality activity boosts affect, which has a positive spillover on future utility. Accordingly, the peak activity should be placed early enough to impact the subsequent utilities over a sufficiently large time window. The idea is to impress consumers early on so that they enjoy all subsequent activities, even if they are of poor quality. As the saying goes, “first impressions matter.” However, placing the peak activity too early may be detrimental if consumers discount the past. Indeed, they may always experience some random contingency that may upset them (“tough luck”), which would drop their affect and negatively impact their subsequent utilities. When consumers discount the past, this is to be avoided as much as possible because it would significantly lower their evaluation of the overall experience.
Finally, we explore the tradeoff between quality contrast and affect assimilation, without time discounting.
When , if , the optimal sequence of activity qualities has an inverted U-shape if and a U-shape if .
When , there exist a threshold on , namely, , and, for each , a threshold on the experience duration such that the inverted U-shape degenerates into
When , a crescendo, for any T;
When , a decrescendo if ; and
When , a decrescendo, for any T.
When , there exist a threshold on , namely, , and, for each , a threshold on the experience duration such that the U-shape degenerates into
When , a crescendo, for any T;
When , a crescendo if ; and
When , a decrescendo, for any T.
Corollary 3 shows that, without time discounting, we have an inverted U-shape or a U-shape, depending on whether or not. Affect assimilation and quality contrast give rise to the following tradeoff: Experiencing a high-quality activity has a higher likelihood to boost the consumer’s affect, which has a positive spillover effect; but it also raises the quality baseline, which has a negative spillover effect. If affect adapts faster than the quality baseline (i.e., ), the former effect dominates, and the peak activity should be placed early enough to positively impact a large number of subsequent utilities, but not so early that the quality baseline adjusts to the peak and negatively impacts the subsequent utilities. Given that , these U-shapes and inverted U-shapes degenerate into a decrescendo with a high affect assimilation and a low quality contrast, that is, when is large, and into a crescendo when is small.
4.3. Nonlinear Probabilities
When is nonlinear, the optimal closed-loop policy (7)–(8) may no longer be equal to the optimal open-loop policy (11). In particular, the optimal sequence may depend on the starting state . We first study the first- and second-order behavior of the open-loop value function (9) in Section 4.3.1, which will then help us develop insights into the nature of the closed-loop policy solving (7)–(8), verified numerically in Section 4.3.2. We then construct an interchange argument in Section 4.3.3 for the open-loop policy 11, assuming instantaneous affect adaptation and no quality contrast, which generalizes Corollary 2.
4.3.1. Properties of the Value Function (9).
Depending on whether the density function is increasing or decreasing, has decreasing or increasing differences in ; see Lemma EC.2 in the Online Appendix. Hence, for a normal distribution , whose density is first increasing and then decreasing, the marginal value of affect is the largest when the utility score is large (respectively, small), in the scenario where we are below (respectively, above) than the median. Consumers whose utility score lie in the extremes of the distribution are indeed unlikely to change their mind about whether they are satisfied or not with the current activity when their affect changes marginally.
Building on this property, the next proposition shows that the marginal value of any activity’s quality is higher when is higher (respectively, lower) if is increasing (respectively, decreasing). For tractability, we assume no quality contrast () and thus drop from the argument set of .
When , has decreasing differences in if is decreasing and increasing differences in if is increasing.
Combining this proposition with the preceding discussion, we infer that, with a normal distribution , marginal increases in quality will be very effective when the score is close to the point where changes sign, but rather ineffective when is either very high or very low.
4.3.2. Dynamic Scheduling.
Switching now to dynamic scheduling, we investigate when an experience curator should schedule high-quality activities, as a function of a consumer’s affect and remaining time until the end. In our numerical simulations, we assume that , in which is the c.d.f. of the standard normal distribution; , that is, consumers discount the past; and consisting of two types of activities: many of low quality and a few of high quality .
The optimal policy, determined numerically, is depicted in Figure 2 as a function of the current affect level (horizontal axis), and the time until the end of the horizon (vertical axis). When there is a single high-value activity left, it should be reserved for circumstances in which the current affect level is low or the remaining time is short. In other words, scheduling the high-quality activity will allow the consumer to reach a high satisfaction with high probability (specifically, with probability ) regardless of the current affect level. In contrast, scheduling the low-quality activity will lead to high satisfaction with a probability and is much more sensitive to the current affect level: It generates high satisfaction with only 9.7% probability at low affect levels and with 95.5% probability at high affect levels. For this reason, it is best to use the high-quality activity to “recover” from a previous unsatisfying experience, that is, when is low, and save it for the future if the affect is already high.
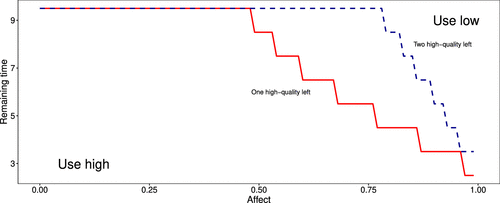
Notes. Here, , , , , , , , , and . “Use high” (respectively “use-low”) refers to scheduling a high-quality (respectively, low-quality) activity in the dynamic policy. When there is one (respectively, two) high-quality activity left, a high-quality activity should be scheduled if the combination of affect and remaining time fall below the solid (respectively, dashed) curve.
When more than one high-quality activity is available, the same intuition applies, but at even higher levels of affect and time left. Indeed, we see that the dashed line, which characterizes when to schedule a high-quality activity when two such activities are available, is above the solid line, which does so when only one such activity is available. Therefore, the dynamic scheduling of high-quality activities should aim at restoring affect to a high level, similar to the playing of “wild cards” to recover from bad outcomes, as is common in service recovery (Van Vaerenbergh et al. 2019).
4.3.3. Structure of Open-Loop Policy Without Contrast.
We finally characterize the optimal open-loop sequence using an interchange argument, assuming instantaneous adaptation (), which makes affect take binary values after the initial period, that is, for , and no quality contrast (). Without loss of generality (by rescaling of ), we normalize to one. To simplify the exposition, we let and define in the proof of the proposition.
When , , and , denoting for and , if sequence is optimal, then, for ,
in which , , , and for .
This proposition suggests that when , , and , starting the experience with an increasing sequence of qualities and finishing it with a decreasing sequence tends to be optimal, consistent with Corollary 2. To see this, note that, because is increasing, ; moreover, is decreasing with t. Hence, for any such that (respectively, ), the right-hand side of (14) is smaller if is small (respectively, large), making (14) easier to satisfy. Furthermore, Corollary EC.1 in the Online Appendix shows that, under the conditions of Proposition 3 and when , a decrescendo at the end of the experience is often optimal; the closer to the end of the horizon, the less stringent the (sufficient) conditions.
Condition (14) also makes clear that the role of the first activity is to attempt to reach a desired affect state, similar to a base-stock policy in inventory control, given that the relevant variable of interest is expressed as .
5. Model Validation
To validate the relevance of capturing affect assimilation and quality contrast in our model, we carry out reduced-form empirical analyses with large-scale retrospective data in four experiential contexts.
5.1. Empirical Contexts
We consider four experiential contexts that are economically and culturally relevant (Hardey 2011).
Watching movies. IMDb.com (“IMDb”) is an online platform where movie watchers can post reviews or read reviews by other users. We scraped review data for 13,546 consumers, who posted a total of 0.49 million reviews on a 1–10 scale in 1998–2022.
Reading books. Goodreads.com (“GoodReads”) is an online platform where readers review books, share what they are reading, explore what is new in the market, and, in general, participate in a worldwide community of avid readers. From data collected by Wan and McAuley (2018), we built reading histories of 0.28 million readers over 2006–2017, consisting of 4.06 million reviews on a 1–5 scale for 0.35 million books by 0.30 million authors.
Visiting touristic attractions. TripAdvisor.com (“TripAdvisor”) is an online platform in which travelers post reviews on various attractions or activities (e.g., taking a bicycle tour, visiting a museum). We scraped review histories of 57,105 travelers who rated 0.15 million activities on a 1–5 scale in 2004–2022 (both within and across trips). These data amount to 0.67 million reviews in total.
Eating out. In addition to touristic activities, TripAdvisor also allows travelers to rate their experiences at restaurants. We scraped the rating histories, again on a 1–5 scale, of 57,954 consumers across 0.48 million restaurants over 2004–2022, amounting to 1.3 million reviews.
A limitation of these data sets is that individuals may choose to rate an activity only if their experience is highly positive or negative (Hu et al. 2017). To address this concern, we only consider users who have posted at least 15 reviews, that is, our first observation for a given user is their 15th review. Additional analyses with thresholds of 20, 25, and 30 reviews yield similar results (omitted for brevity). Furthermore, a stricter robustness test is also carried out by only considering the top-quartile most active reviewers in our sample, for whom the incentives of having sustained presence of social media platforms are much higher than for infrequent contributors (Mallipeddi et al. 2022).
A second potential concern is the broad scope of TripAdvisor, which allows individuals to review touristic attractions, restaurants, and hotels. To focus on studying spillovers within a category, we separate the reviews for touristic attractions from those for restaurants, and we ignore the hotel reviews. Although we hypothesize limited spillovers across categories (Hypothesis 3), they might still arise, thus raising caution in the interpretation of the results.
5.2. Variables Specification
We next describe how we measure the variables in the utility model introduced in Section 3.
5.2.1. Ratings.
To attain binary ratings (2), we translate the original ratings, which tend to follow a J-shape distribution (Hu et al. 2017; also see histograms in Figure EC.1 in the Online Appendix) into binary outcomes. Specifically, we set to one when the rating is 8-9-10 on IMDb, 5 on GoodReads and TripAdvisor (similar to Godes and Silva (2012)) and to zero otherwise. This is done to obtain a balance between highly satisfactory and nonsatisfactory experience across the four contexts; the percentage of top ratings lies between 34.70% and 54.20%.
5.2.2. Quality.
Using these binary rating definitions, we estimate the inherent quality of consumer i’s jth activity as the percentage of top ratings given to that activity:
|
Table 2. Representative Statistics of the Key Variables in the Selected Samples Used for the Analysis
| Variable | Statistic | IMDb | GoodReads | TripAdvisor attractions | TripAdvisor restaurants |
|---|---|---|---|---|---|
| No. activities | 18,338 | 252,134 | 38,188 | 164,198 | |
| No. users (i) | 2,920 | 82,661 | 8,603 | 22,263 | |
| No. of reviews for an activity | Mean | 5.33 | 6.89 | 2.20 | 1.57 |
| Minimum | 1 | 1 | 1 | 1 | |
| Maximum | 382 | 3,907 | 318 | 75 | |
| Quality of an activity | Mean | 0.25 | 0.37 | 0.50 | 0.42 |
| Minimum | 0 | 0 | 0 | 0 | |
| Maximum | 1 | 1 | 1 | 1 | |
| Agreeableness of an individual | Mean | −0.03 | 0.08 | −0.05 | −0.04 |
| Minimum | −1.28 | −2.16 | −1.54 | −1.33 | |
| Maximum | 2.06 | 1.61 | 1.35 | 1.37 | |
| Age in days of an activity | Mean | 3,224 | 1,939 | 1,324 | 887 |
| Minimum | 1 | 1 | 1 | 1 | |
| Maximum | 52,530 | 366,873 | 6,406 | 6,031 | |
| Time lag in days between activities j and | Mean | 16.19 | 44.42 | 55.46 | 63.15 |
| Minimum | 0 | 7 | 0 | 0 | |
| Maximum | 5,103 | 2,658 | 2,984 | 2,960 | |
| No. of reviews per individual (starting from the 15th review) | Mean | 33.46 | 21.02 | 9.75 | 11.55 |
| Minimum | 1 | 1 | 1 | 1 | |
| Maximum | 1,178 | 173 | 145 | 215 |
5.2.3. Agreeableness.
We measure consumer i’s agreeableness as a consumer’s tendency to give high ratings, measured by considering the first activities they experienced, and controlling for those activities’ quality (by centering it and normalizing its variance). We do this in the following manner:
As mentioned in Section 5.1, we only consider individuals who posted at least 15 reviews in our analysis. This retains 16%–39% of users and 10%–21% of reviews from the full data across the four contexts. For each individual, we measure their agreeableness using their first activities and only consider their activities in our regression to minimize the impact of their early activities in their ratings of activities . Indeed, the correlation between and is only 0.30, which effectively makes the variables and independent for , with defined as in (3).
5.2.4. Moderators.
Consistent with Hypothesis 3, we consider two moderators : (i) the time gap between reviews, , measured in weeks; and (ii) the attribute dissimilarity measure, , defined in different ways for every data set; see Section EC.3 in the Online Appendix for details.
5.2.5. Controls.
We add the following controls to our model specification (6): the log-transformed rank j of consumer i’s review; the log-transformed total number of reviews associated with consumer i’s jth activity, ; and the log-transformed relative age of consumer i’s jth activity, , which is the activity’s age when consumer i reviews it divided by the activity’s age in 2023, when the data collection terminated.
We present representative statistics for the key variables in Table 2, and other descriptive statistics—with respective log-transformations wherever necessary to account for the skewness in the data—in Section EC.2 (Tables EC.2–EC.5) in the Online Appendix.
5.3. Empirical Challenges
Self-reported consumer reviews are rife with self-selection, data quality, structural issues (Chen et al. 2021), and collinearity, which we discuss next.
5.3.1. Self-Selection.
In our context, self-selection manifests in two interconnected decisions: (i) choosing to consume particular activities and (ii) deciding to review these activities. To address this dual selection process, we employ a Heckprobit model (Heckman 1979). The first stage controls for the likelihood of activity selection and review, whereas the second stage incorporates the inverse Mills ratio (IMR) to account for selection bias.
As in Arora et al. (2009) or Mueller and Reize (2013), we use as exclusion restriction a variable measuring the size of the option set at the time of selection, namely, the “market thickness” at the time of selection, which only affects the likelihood of an activity being chosen without affecting the likelihood that the chosen activity receives a top rating after its consumption, estimated in the second stage. For example, an individual, when considering eating at a particular restaurant, might consider all other restaurants in its vicinity (Carrera et al. 2026). We specify how we construct this market thickness variable in the four contexts under consideration in Section EC.4.1 in the Online Appendix. To address data censoring in the first stage, we approximate an individual’s choice set by generating a distribution of activity options, similar to Singhvi and Singhvi (2025). For detailed methodology, see Section EC.4.1 in the Online Appendix.
5.3.2. Data Quality Issues.
Individuals who have experienced multiple activities over a certain time window may be batching their reviews into a single session. Although GoodReads’ users often record the dates of their reading of a book, neither IMDb nor TripAdvisor keeps track of the activity consumption time. With batching, individuals may be posting their recalled satisfaction from an activity, which may differ from their true utility (Kahneman et al. 1997), although it is certainly correlated (Baucells and Bellezza 2017). To address this potential challenge, we drop, in one of the robustness tests, users who ever posted multiple reviews on the same date on IMDb and TripAdvisor (Table EC.17 in the Online Appendix). Although this conservative approach prevents us from tracking within-day spillover effects, it diminishes the likelihood of batching, incorrect ordering, and delays in retrospective evaluations.
5.3.3. Structural Issues.
We may have introduced a selection bias by only considering users who have posted at least 15 reviews to obtain stable estimates of consumer agreeableness (15). However, we found no significant demographics difference between our sample and the individuals we excluded. However, because our approach is inherently limited to consumers who engage in online reviewing, the generalizability of our findings to the broader consumer population depends on whether reviewers constitute a representative sample of all consumers.
A potential downside of focusing on “moderately heavy” users is that they may review differently than the general population of reviewers, not only in terms of their choice of activity to review, for example, perhaps due to “bandwagon” effects (Lee et al. 2015), but also in the valence of their review, for example, in case reviewers tend to get more critical as their tenure and status increase on a platform (Caro and Martínez-de-Albéniz 2020, Deshmane and Barriola 2025). To address the first issue, we control for the total number of reviews associated with the focal activity (), as described in Section 5.2, in case some activities are more susceptible to generating reviews as shown in Dellarocas et al. (2010). In addition, we carry out a more focused analysis on a subsample of “very heavy” users, namely consumers who are in the top quartile of reviewing activity (Table EC.18 in the Online Appendix). To address the second issue, we control for the activity’s rank j in a consumer’s experience, as described in Section 5.2.
5.3.4. Collinearity.
The correlation between and is moderate to low across all four contexts: 0.58 (IMDb), 0.48 (GoodReads), 0.33 (tourist attractions), and 0.34 (restaurants), as shown in Tables EC.2–EC.5 in the Online Appendix. In our analyses presented in Tables EC.11–EC.14 in the Online Appendix, we examine these variables both independently and jointly. For IMDb, the results align with our theoretical expectations: shows a positive effect, whereas shows a negative effect. However, in the other three contexts, although maintains its expected positive effect, shows an unexpected positive effect when considered in isolation. This pattern, observed despite relatively modest correlations, suggests a potential suppression effect in the relationship between these variables (MacKinnon et al. 2000).
5.4. Empirical Results
We now present the results for the empirical estimation of Models (3) and (6), together with (4)–(5) with a probit specification (2), across the four contexts, using a two-stage Heckprobit model to account for self-selection, as introduced in Section 5.3. Table 3 presents the key results of the second stage of our estimations, across all four contexts. We discuss the main effects of affect infusion and quality contrast (Hypotheses 1 and 2) in Section 5.4.1, the moderating effects of content and time dissimilarity (Hypothesis 3) in Section 5.4.2, and the role of selection through the inverse Mills ratio and the robustness of our findings in Section 5.4.3.
|
Table 3. Estimation Results of Models (3) and (6) for (2), with (4)–(5)
| IMDb | GoodReads | TripAdvisor-attractions | TripAdvisor-restaurants | |||||
|---|---|---|---|---|---|---|---|---|
| (1) | (2) | (3) | (4) | (5) | (6) | (7) | (8) | |
| 0.10 | 0.10 | 0.10 | 0.10 | 0.15 | 0.15 | 0.20 | 0.20 | |
| 0.10 | 0.10 | 0.10 | 0.10 | 0.15 | 0.15 | 0.15 | 0.15 | |
| (Intercept) | −2.06*** | −2.01*** | −2.02*** | −2.02*** | −1.65*** | −1.53*** | −1.37*** | −1.46*** |
| (0.10) | (0.17) | (0.03) | (0.05) | (0.06) | (0.14) | (0.04) | (0.07) | |
| 0.28*** | 0.28*** | 0.12*** | 0.12*** | 0.21*** | 0.21*** | 0.28*** | 0.28*** | |
| (0.01) | (0.01) | (0.00) | (0.00) | (0.01) | (0.01) | (0.01) | (0.01) | |
| 3.16*** | 3.17*** | 2.85*** | 2.85*** | 2.42*** | 2.42*** | 2.03*** | 2.01*** | |
| (0.03) | (0.03) | (0.01) | (0.01) | (0.03) | (0.03) | (0.02) | (0.02) | |
| j | −0.04*** | −0.04*** | −0.03*** | −0.02*** | −0.01 | −0.00 | −0.05*** | −0.04*** |
| (0.01) | (0.01) | (0.00) | (0.00) | (0.01) | (0.01) | (0.01) | (0.01) | |
| 0.03*** | 0.03*** | 0.05*** | 0.04*** | 0.01*** | 0.01*** | −0.01** | −0.00 | |
| (0.01) | (0.01) | (0.00) | (0.00) | (0.00) | (0.00) | (0.00) | (0.00) | |
| 0.01 | 0.00 | −0.20*** | −0.21*** | 0.16*** | 0.14*** | 0.28*** | 0.24*** | |
| (0.05) | (0.10) | (0.01) | (0.01) | (0.03) | (0.03) | (0.02) | (0.02) | |
| 2.36*** | 2.60*** | 2.55*** | 2.83*** | 1.82*** | 2.11*** | 1.80*** | 1.96*** | |
| (0.03) | (0.07) | (0.01) | (0.04) | (0.03) | (0.08) | (0.02) | (0.05) | |
| −2.00*** | −2.35*** | −1.85*** | −2.40*** | −1.26*** | −1.76*** | −0.92*** | −1.15*** | |
| (0.06) | (0.16) | (0.03) | (0.12) | (0.07) | (0.24) | (0.04) | (0.13) | |
| −0.04** | 0.03*** | −0.01 | 0.03*** | |||||
| (0.01) | (0.01) | (0.02) | (0.01) | |||||
| −0.01 | −0.12*** | −0.12 | −0.03 | |||||
| (0.09) | (0.03) | (0.14) | (0.07) | |||||
| −0.02 | −0.06*** | −0.07*** | −0.01 | |||||
| (0.02) | (0.01) | (0.01) | (0.01) | |||||
| −0.28*** | −0.26*** | −0.20** | −0.17*** | |||||
| (0.09) | (0.03) | (0.09) | (0.06) | |||||
| 0.11*** | 0.09*** | 0.11*** | 0.02 | |||||
| (0.04) | (0.03) | (0.03) | (0.02) | |||||
| 0.29 | 0.72*** | 0.39 | 0.25* | |||||
| (0.20) | (0.08) | (0.25) | (0.14) | |||||
| IMR | 0.01 | 0.02 | 0.06*** | 0.03*** | 0.03 | 0.09 | 7.51*** | 7.99*** |
| (0.03) | (0.07) | (0.01) | (0.01) | (0.90) | (0.90) | (1.74) | (1.75) | |
| AIC | 82,051.27 | 82,045.29 | 501,083.66 | 500,661.74 | 86,514.76 | 86,445.46 | 179,541.98 | 179,116.38 |
| BIC | 82,135.49 | 82,185.65 | 501,183.77 | 500,828.59 | 86,597.70 | 86,583.70 | 179,631.36 | 179,265.35 |
| Log likelihood | −41,016.64 | −41,007.64 | −250,532.83 | −250,315.87 | −43,248.38 | −43,207.73 | −89,761.99 | −89,543.19 |
| Deviance | 82,033.27 | 82,015.29 | 501,065.66 | 500,631.74 | 86,496.76 | 86,415.46 | 179,523.98 | 179,086.38 |
| No. of observations | 85,589 | 85,589 | 500,493 | 500,493 | 74,306 | 74,306 | 151,891 | 151,891 |
Notes. Observations are at the individual-activity level. Standard errors are shown in parentheses. The table was shortened for brevity.
.
A comparison of the log-likelihood of the models in Tables EC.11–EC.14 in the Online Appendix reveals that, after controlling for individual agreeableness () and the quality of an activity (), the largest improvement in the log-likelihood values of the prediction models arises after the introduction of the key independent variables, namely, affect infusion () and quality contrast (), indicating the significance of these effects in explaining the variation in the data. To identify the rate of adaptation of affect () and of the baseline quality () in (4)–(5), we carry out a grid search between zero and one with 0.05 increments as in Lattin and Bucklin (1989) and Tereyağoğlu et al. (2018) to maximize the log-likelihood. This yields and values within the range of 0.10–0.20 across all contexts, indicating slow adaptation rates and persistent spillover effects from past experiences.
5.4.1. Main Effects.
We first discuss the statistical significance and valence of the controls and then those of the main independent variables of interest.
5.4.1.1. Controls.
Consumer agreeableness () has a positive and statistically significant predictor of top-star ratings across all contexts, see Models (1), (3), (5), and (7) in Table 3. Specifically, an increase in consumer agreeableness by one standard deviation (SD) elevates the probability of assigning a top rating by two to five percentage points (p.p.), with the effect most pronounced for movies (5 p.p., p ) and least for books (2 p.p., p ). This effect in the case of books was quantified as follows: The standard normal c.d.f. at the mean values of all covariates (given in Table EC.3 in the Online Appendix) is 0.30; increasing by one SD while keeping other variables constant raises this value to 0.32, resulting in a -p.p. increase (Wooldridge 2010, section 15.6).
Similarly, the activity’s quality has a positive and statistically significant effect across all four contexts. Specifically, a one-SD increase in the activity’s quality raises the likelihood of a top rating by an amount lying between 16 p.p. (restaurants, p ) and 28 p.p. (movies, p ).
Reviewer tenure, operationalized as the activity’s rank (j) in a consumer’s review history, exhibits a negative effect across all contexts, corroborating findings by Goes et al. (2014). This effect is statistically significant (at p ) and within a comparable range of −0.03 to −0.05 for movies, books, and restaurants (Models (1), (3), and (7), respectively), indicating increased critical appraisal over time. Only for attractions (Model (5)) does this effect lose statistical significance.
The influence of an activity’s popularity () and relative age () presents a more heterogeneous picture. Although a higher number of reviews positively correlates with enjoyment for movies, books, and attractions, it exhibits a negative relationship for restaurants. Age effects also vary: Consumers prefer more recent books, but favor more established attractions and restaurants. These findings underscore the complex interplay of individual, item-specific, and contextual factors in shaping consumer evaluations across diverse experiential goods categories.
5.4.1.2. Main Independent Variables of Interest.
After controlling for individual, item-specific, and contextual factors, we turn our attention to the key independent variables of interest: affect infusion () and baseline quality comparison (). Our analysis reveals that both variables are statistically significant determinants of consumer satisfaction across all four experiential contexts, offering robust support for our theoretical hypotheses. However, the magnitudes of these intertemporal spillover effects are smaller than the effect of the focal activity’s quality.
Regarding affect assimilation (), Models (1), (3), (5), and (7) in Table 3 demonstrate a consistent positive spillover effect from past ratings on the assessment of subsequent activities. Specifically, a one-SD increase in is associated with substantial increases in the probability of assigning a high rating: 23, 24, 17, and 17 p.p. for movies, books, attractions, and restaurants (all at p ), respectively. These findings provide compelling evidence for affect assimilation effects across all four contexts, strongly supporting Hypothesis 1. These assimilation effects are further corroborated when the sample is restricted to the top-quartile reviewers (Table EC.18 in the Online Appendix), suggesting the robustness of affect assimilation across different levels of consumer engagement.
Turning to the baseline quality comparison (), we observe a consistent negative spillover effect across all contexts, with changes ranging from −3.50 p.p. for restaurants to −7.20 p.p. for movies for a one-SD increase in (also at p ). These findings provide strong support for Hypothesis 2, indicating the prevalence of quality-contrast effects. Comparing the relative magnitudes of the sensitivity analyses, we conclude that affect assimilation has a stronger effect on consumer satisfaction than quality contrast.
5.4.2. Moderating Effects.
We next examine the moderating effects of time lapse and content dissimilarity using Models (2), (4), (6), and (8) in Table 3. The interaction between time lapse () and affect () is negative and statistically significant for books and touristic attractions but is statistically insignificant for movies and restaurants. Hence, consistent with Hypothesis 3, affect assimilation tends to diminish as the temporal distance between activities increases.
The interaction between time lapse () and baseline quality comparison () is positive and statistically significant for movies, books, and attractions, indicating that the impact of quality contrast diminishes over time in these contexts. Consistent with Hypothesis 3, quality benchmarks tend to become less salient as time passes between activities.
The interaction between content dissimilarity () and affect () is negative and statistically significant across all contexts. This robustly supports Hypothesis 3, indicating that affect assimilation is reduced when there is less content overlap between the focal and penultimate activities.
The interaction between content dissimilarity () and the baseline quality comparison () yields positive and statistically significant estimates for books and restaurants, suggesting that in these contexts, quality contrast becomes less pronounced with increased content dissimilarity, aligning with Hypothesis 3. However, this effect is statistically insignificant for movies and attractions.
5.4.3. Robustness.
5.4.3.1. Details of the First Stage.
In the main model, we controlled for the self-selection bias of choosing a particular activity with the following two-stage Heck probit specification: In the first stage, we track the likelihood of selecting a particular activity, and in the second stage, we focus on the satisfaction derived from it. A detailed explanation of the first-stage specification and the control included is given in Section EC.4.1 in the Online Appendix, whereas Table EC.10 in the Online Appendix presents the results for the first stage.
5.4.3.2. Instrument Validity.
As shown in Table 3, the IMR in the second stage is significant and positively related with the dependent variable for reading books (p ) and eating out (p ). In other words, higher satisfaction comes from activities that are more likely to be chosen. To assess the validity of our instruments, we carry out weak instrument and endogeneity tests (Wooldridge 2010) in Section EC.4.3 in the Online Appendix. Our analysis across the four experiential contexts reveals consistently strong instrumental variables, yet demonstrates heterogeneous selection bias effects, with significant bias in book and restaurant ratings but not in movie and attraction ratings. To assess whether controlling for selection affects the estimation of coefficients , and , we replicate the analyses without first-stage selection correction. As shown in Table EC.16 in the Online Appendix, the significance and valence of the results remain consistent with our two-stage estimation.
In addition, we run a battery of additional tests and extensions to further test the robustness of our results. A brief summary of these tests, along with corresponding references, is given in Table 4.
|
Table 4. Summary of Robustness Tests and Extensions
| Test or extension | Method | Consistency with Table 3 or other results | Appendix reference |
|---|---|---|---|
| Without first-stage correction | Excluded inverse Mills ratio | ✓ | Table EC.16 |
| Review batching | Excluded multireview users (IMDb, TripAdvisor) | ✓ | Table EC.17 |
| Censoring | Analyzed top-quartile reviewers and activities | ✓ | Tables EC.18 and EC.19 |
| Genre controls | Added genre/tag control | ✓ | Table EC.20 |
| Geographical parameters (only TripAdvisor data) | Added distance as moderator | ✓ | Table EC.21 |
| Included city-level fixed effects | ✓ | Table EC.22 | |
| Instantaneous adaptation | Set | ✓ | Table EC.23 |
| Nonlinear effects | Quartile split of , | Effects mostly monotonic | Table EC.24 and Figure EC.2 |
| Quartile split of and | Effects mostly monotonic | Table EC.25 |
6. Value of Flexibility: Segmentation and Dynamic Adjustment
To demonstrate the applicability of our prescriptions and assess the value of customizing experiences, we conduct a counterfactual experiment around the design of a two-day trip to Barcelona. Inspired by blogs and travel websites, we consider seven attractions, five of which appear in the top 10 list of attractions on TripAdvisor: Sagrada Familia (), the Gothic Quarter (), the Boqueria market (), Camp Nou (), Montjuïc Park (), Park Güell (), and the Barceloneta beach (). For simplicity, we use the TripAdvisor-Attractions model without controls and first-stage correction (see Table EC.15 in the Online Appendix), Specification (3) with (4)–(5), yielding , , , and —values comparable to those with controls and first-stage selection in Table 3. We set and . Using the empirical distribution in the sample, we consider a heterogeneous population of consumers with starting affect levels , starting quality baselines , and levels of agreeableness . Given the short nature of the trip, we take . Consistent with the probit structure of our empirical model, chances of top ratings are assumed to be normally distributed.
We consider three different sequencing policies for the experience curator.
The dynamic strategy applies a unique and dynamically adjusted sequence to each individual consumer. For each consumer i, the implemented sequence is the closed-loop policy that maximizes their utility, dynamically adjusted to their state .
The segmented strategy applies the same fixed sequence to all consumers who share the same starting state . Although all consumers within a group are ex ante identical, they may reach different levels of affect as the experience unfolds. For each group, the selected sequence is the open-loop sequence that maximizes the average utility in the group.
The common strategy applies the same fixed sequence to all consumers. The selected sequence is the open-loop sequence that maximizes the average utility across all consumers.
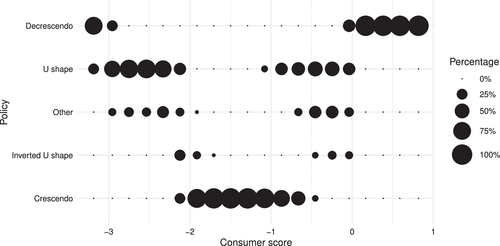
Figure 3 breaks down the optimal open-loop policies by consumer types . For clarity, we group consumer segments into bins that have a similar initial average utility score, measured as , which drives the probability of being satisfied with the first activity (2). Indeed, we find that, even if each consumer segment is uniquely identified by a tuple , similar kinds of open-loop policies tend to be preferred by consumers who share similar utility scores. In particular, consumer segments with very low or very high scores tend to prefer a decrescendo, whereas those with intermediate scores tend to prefer a crescendo. This preference for a decrescendo when the score is extreme and for a crescendo when the score is median is consistent with our characterization of the open-loop value function in Proposition 2. Consumer segments whose scores are neither extreme nor in the middle may prefer a more complex sequence, such as a U-shaped, an inverted U-shaped, or even one with possibly several interior peaks (e.g., W-shaped). In our simulations, we identify a total of 53 different optimal open-loop policies, out of possible sequences.
An experience curator can customize a sequence in two different ways: over time (which would be the difference between the dynamic and the segmented strategies) and across consumers (which would be the difference between the segmented and the common strategies). Naturally, consumers always prefer the dynamic policy over the segmented one and the latter over the common one. Letting , , and denote consumer i’s expected utility under a dynamic, segmented, or common strategy, respectively, we thus have .
To quantify the value of the dynamic and segmented policies, we avoid using simple utility ratios () because utilities can be negative. Instead, we measure improvement relative to —the worst utility consumer i could get from any of the 53 open-loop policies (each being optimal for some consumer type). After normalization, we thus express the values of segmentation and best common policy for consumer i as
In our seven-activity example, the common policy turns out to be a crescendo, starting with the activity with the lowest relative quality (Barceloneta beach) and ending with the highest one (Sagrada Familia). As shown in Figure 3, and consistent with Proposition 2, a crescendo is optimal for consumers with intermediate scores. For example, a consumer i with agreeableness , median initial affect , and median quality baseline prefers a crescendo. In fact, we find that crescendo is always optimal for this consumer, even if the experience curator could dynamically adjust the sequence to the consumer’s evolving state, that is, . On the other hand, another consumer i with the highest possible score (e.g., with the highest degree of agreeableness, the highest initial affect , and the lowest initial quality baseline ) always prefers a decrescendo, even if the policy could be dynamically adjusted to their evolving state. Moreover, we find that some consumers who prefer the decrescendo dislike the most the crescendo, that is, and .
Beyond these two anecdotal cases, we find that most of the value of flexibility comes from the ability to offer different open-loop sequences to different consumer segments and not from dynamically adjusting the sequence to individual state variations. Figure 4 shows the performance of the common strategy (namely, applying a fixed crescendo to all consumers) and the segmented strategy for different consumer utility scores, grouped in the same bins as in Figure 3. From the figure, it is clear that consumers with either a very high or a very low score (who prefer a decrescendo; Figure 3) dislike the most the crescendo sequence among the pool of 53 candidate sequences, given that . In contrast, consumers with an intermediate score, who, like the majority of the market, prefer a crescendo among all open-loop policies (Figure 3), appear to stick to their preference even after the state evolves given that . For consumers whose scores lie in between, namely, in and , dynamically adjusting the sequence appears to deliver a certain value, achieving about 10% more utility compared with the optimal segmented policy (i.e., ), but it remains a second-order improvement in utility compared with segmentation. We can further compare the average of in the population, denoted , with that of and , denoted and , respectively: , whereas , suggesting again that most of the gain comes from segmentation.
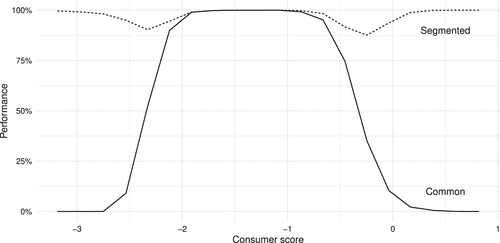
Notes. The vertical distance between the segmented policy (dashed line) and the common policy (solid line) represents the value of tailoring open-loop sequences to different consumer segments. The vertical distance between the segmented policy (dashed line) and the horizontal line at 100% represents the value of dynamically adjusting the best tailored open-loop policy.
Our finding can be understood through Proposition 3, which shows that optimal sequence structure heavily relies on the initial conditions. Our empirical adaptation rates are substantially slower (), implying consumers whose initial state favors a particular sequence structure continue to favor it: Affect fluctuations rarely cross thresholds in Condition (14) that would warrant switching. The open-loop policy based on initial state thus remains near-optimal throughout, rendering dynamic recalibration largely unnecessary.
This proof of concept rests on several assumptions. First, it assumes that the population samples extracted from the TripAdvisor data set is representative of the tourist population visiting Barcelona (reviewing or not on TripAdvisor). Second, it assumes that the effects of affect assimilation and quality contrast have been properly estimated, given the limitations of the data (e.g., batching of reviews, censoring). Third, it relies on the assumption that these effects are causal—which cannot be fully established without having recourse to a randomized control trial. Nevertheless, we believe that the managerial insights that come out of this analysis—namely, that there are great benefits to tailoring different open-loop sequences to different consumer segments and little benefits to dynamically adjusting them—prevail despite these limitations.
7. Conclusion
This paper offers a framework for engineering experiences to maximize consumer satisfaction under both affect assimilation and quality contrast. When the probability that a consumer is satisfied with an activity is linear in the utility derived from it, closed- and open-loop optimal policies coincide. Moreover, they have an N-shape or inverted N-shape. In particular, the presence of affect assimilation gives rise to interior peaks in the sequence; as the saying “first impressions matter” goes, scheduling a high-quality activity early has a chance of boosting affect, which will positively influence the evaluations of subsequent activities. When the probability is nonlinear, closed-loop dynamic scheduling dominates static policies, and we find that it may be optimal to reserve some high-quality activities until the end of the horizon gets close or affect drops. We interpret this as saving “wild cards” to restore affect to high levels when necessary—as often happens in service recovery.
We complement our theoretical findings with an empirical study of four experiential contexts, for wide external validity. We establish that both affect assimilation and quality contrast are salient, with comparable magnitudes across all four contexts. The empirical analysis is subject to some limitations, associated with the nature of the data sets, such as not capturing the population that never reviews anything, review censoring, and review batching, among others. Accordingly, full causality cannot be established without having recourse to a randomized control trial. Also, we use binary construct to capture the polarized nature of reviews, but a finer-grained analysis would look at categorical constructs and/or leverage text comments.
Finally, a calibrated proof of concept for experience engineering shows that offering different sequences to the diverse segments of the consumer pool can create significant value, whereas dynamically adjusting the sequence to their evolving affects generates only second-order improvements.
Our data-driven approach can help service organizations escape commoditization by engineering outstanding consumer experiences. Although we have focused here on four domains of application, the principles outlined in this paper apply to other experiential services. Scheduling classes for executive education programs, programming artists and songs at music concerts, or planning the flow of dishes in multicourse fine dining are just a few of such potential application areas. Furthermore, the integration of AI-based tools (e.g., ChatGPT) in online platforms (e.g., Expedia) makes it easier to offer segmented or dynamic recommendations. For example, Deezer, a music streaming platform, has already implemented a basic, feedback-based mood-dependent song recommendation system (Moscato et al. 2020, Bontempelli et al. 2022). Our research makes a strong call for assessing both the initial affect level (mood) of consumers and their initial quality baseline, for example, through surveys (Novemsky and Ratner 2003) or by analyzing their past review histories, and offering different sequences to different consumers. Beyond improving individual experiences, a segmented strategy helps service providers balance activity demand, reducing congestion at popular attractions while distributing visitor flow more evenly over time.
This work paves the way for other future research directions. A promising next step can be to verify the validity of our prescriptions in these experiential settings through experimentation. In particular, a laboratory setting would be suitable to distinguish short-term affects (emotions) from long-term ones (mood) and may help verify whether the behavioral traits of the reviewers on the platforms we considered are similar to those of the general population. Another possible extension could be to adopt a multidimensional definition of quality and/or content dissimilarity to refine our prescriptions. Finally, it may also be relevant to explore how to implement these experience design principles in self-routed services, where consumers make their own scheduling decisions.
The authors thank the seminar participants at Dartmouth College, Johns Hopkins University, Rotterdam School of Management, and TU Eindhoven. The authors are also very grateful for constructive feedback by the DE, the AE, and three reviewers throughout the review process.
References
- (2014) Managing retention in service relationships. Management Sci. 60(2):415–433.Link, Google Scholar
- (2009) A breath of fresh air? Firm type, scale, scope, and selection effects in drug development. Management Sci. 55(10):1638–1653.Link, Google Scholar
- (2016) Yelp dataset challenge: Review rating prediction. Preprint, submitted May 17, https://arxiv.org/abs/1605.05362.Google Scholar
- (2017) Temporal profiles of instant utility during anticipation, event, and recall. Management Sci. 63(3):729–748.Link, Google Scholar
- (2007) Satiation in discounted utility. Oper. Res. 55(1):170–181.Link, Google Scholar
- (2010) Predicting utility under satiation and habit formation. Management Sci. 56(2):286–301.Link, Google Scholar
- (2019) It is time to get some rest. Management Sci. 65(4):1717–1734.Link, Google Scholar
- (2009) Additive utility in prospect theory. Management Sci. 55(5):863–873.Link, Google Scholar
- (2022) Flow moods: Recommending music by moods on Deezer. Proc. 16th ACM Conf. Recommendation Systems (RecSys ’22) (Association for Computing Machinery, New York), 452–455.Google Scholar
- (2020) Managing online content to build a follower base: Model and applications. INFORMS J. Optim. 2(1):57–77.Link, Google Scholar
- (2026) The bright side of lower quality: Evidence from restaurant exploration. Management Sci. 72(5):3847–3864.Google Scholar
- (2023) Peer effects in subjective performance evaluation. Contemporary Accounting Res. 40(3):1704–1732.Crossref, Google Scholar
- (2021) Anchored differentiation: The role of temporal distance in the comparison and evaluation of new product designs. Organ. Sci. 32(6):1523–1541.Link, Google Scholar
- (2002) Close encounters of two kinds: False alarms and dashed hopes. Marketing Sci. 21(2):178–196.Link, Google Scholar
- (2021) Reviews and self-selection bias with operational implications. Management Sci. 67(12):7472–7492.Link, Google Scholar
- (2024) Ups and downs in experience design. Production Oper. Management 33(9):1895–1911.Crossref, Google Scholar
- (2006) The effect of word of mouth on sales: Online book reviews. J. Marketing Res. 43(3):345–354.Crossref, Google Scholar
- (1990) Habit formation: A resolution of the equity premium puzzle. J. Political Econom. 98(3):519–543.Crossref, Google Scholar
- (2006) Behavioral causes of the bullwhip effect and the observed value of inventory information. Management Sci. 52(3):323–336.Link, Google Scholar
- (2015) The design of experiential services with acclimation and memory decay: Optimal sequence and duration. Management Sci. 62(5):1278–1296.Link, Google Scholar
- (2013) The Customer Service Solution: Managing Emotions, Trust, and Control to Win Your Customer’s Business (McGraw-Hill, New York).Google Scholar
- (2010) Are consumers more likely to contribute online reviews for hit or niche products? J. Management Inform. Systems 27(2):127–158.Crossref, Google Scholar
- (2007) Exploring the value of online product reviews in forecasting sales: The case of motion pictures. J. Interactive Marketing 21(4):23–45.Crossref, Google Scholar
- (2025) Frame by fame: Content creation on short video-format platforms. |Manufacturing Service Oper. Management 27(2):339–678.Link, Google Scholar
- (2013) Sequence effects in service bundles: Implications for service design and scheduling. J. Oper. Management 31(3):138–152.Crossref, Google Scholar
- (2017) Surprise, anticipation, and sequence effects in the design of experiential services. Production Oper. Management 26(5):945–960.Crossref, Google Scholar
- (2015) Suspense and surprise. J. Political Econom. 123(1):215–260.Crossref, Google Scholar
- (1995) Mood and judgment: The affect infusion model (AIM). Psych. Bull. 117(1):39.Crossref, Google Scholar
- (2008) Examining the relationship between reviews and sales: The role of reviewer identity disclosure in electronic markets. Inform. Systems Res. 19(3):291–313.Link, Google Scholar
- (2013) Primacy versus recency effects in extended service encounters. J. Service Management 24(1):64–81.Crossref, Google Scholar
- (1989) Expectation and variation in multi-period decisions. Econometrica 57(5):1153–1169.Crossref, Google Scholar
- (2012) Sequential and temporal dynamics of online opinion. Marketing Sci. 31(3):448–473.Link, Google Scholar
- (2014) “Popularity effect” in user-generated content: Evidence from online product reviews. Inform. Systems Res. 25(2):222–238.Link, Google Scholar
- (2014)
Emotion regulation: Conceptual and empirical foundations . Gross J, ed. Handbook of Emotion Regulation, vol. 2, issue 1 (Guilford Publications, Buckinghamshire, UK), 3–20.Google Scholar - (2018) Place the good after the bad: Effects of emotional shifts on consumer memory. Marketing Lett. 29(1):49–60.Crossref, Google Scholar
- (2011) Generation C: Content, creation, connections and choice. Internat. J. Marketing Res. 53(6):749–770.Google Scholar
- (1979) Sample selection bias as a specification error. Econometrica 47(1):153–161.Crossref, Google Scholar
- (1948) Adaptation-level as a basis for a quantitative theory of frames of reference. Psych. Rev. 55(6):297–313.Crossref, Google Scholar
- (1964) Adaptation-Level Theory: An Experimental and Systematic Approach to Behavior (Harper & Row, New York).Google Scholar
- (2017) On self-selection biases in online product reviews. MIS Quart. 41(2):449–475.Crossref, Google Scholar
- (1988) Influence of positive affect on the subjective utility of gains and losses: It is just not worth the risk. J. Personality Soc. Psych. 55(5):710–717.Crossref, Google Scholar
- (1983) Affect, generalization, and the perception of risk. J. Personality Soc. Psych. 45(1):20–31.Crossref, Google Scholar
- (1997) Back to Bentham? Explorations of experienced utility. Quart. J. Econom. 112(2):375–406.Crossref, Google Scholar
- (1993) When more pain is preferred to less: Adding a better end. Psych. Sci. 4(6):401–405.Crossref, Google Scholar
- (2014)
Customer experience and service design . Managing Consumer Services: Factory or Theater? (Springer, Cham, Switzerland), 109–130.Crossref, Google Scholar - (2021) Deep learning techniques for rating prediction: A survey of the state-of-the-art. Artificial Intelligence Rev. 54(1):95–135.Crossref, Google Scholar
- (2007) The influence of experience and sequence of conflicting emotions on ad attitudes. J. Consumer Res. 33(4):523–528.Crossref, Google Scholar
- (1989) Reference effects of price and promotion on brand choice behavior. J. Marketing Res. 26(3):299–310.Crossref, Google Scholar
- (2015) Do I follow my friends or the crowd? Information cascades in online movie ratings. Management Sci. 61(9):2241–2258.Link, Google Scholar
- (2005) Slope one predictors for online rating-based collaborative filtering. Proc. 2005 SIAM Internat. Conf. Data Mining (SIAM, Philadelphia), 471–475.Google Scholar
- (2022) A theory of interior peaks: Activity sequencing and selection for service design. Manufacturing Service Oper. Management 24(2):993–1001.Link, Google Scholar
- (2023) Optimal sequencing in single-player games. Management Sci. 69(10):6057–6075.Link, Google Scholar
- (2006) Word of mouth for movies: Its dynamics and impact on box office revenue. J. Marketing 70(3):74–89.Crossref, Google Scholar
- (1991) Negative time preference. Amer. Econom. Rev. 81(2):347–352.Google Scholar
- (1993) Preferences for sequences of outcomes. Psych. Rev. 100(1):91–108.Crossref, Google Scholar
- (2000) Equivalence of the mediation, confounding and suppression effect. Prevention Sci. 1(4):173–181.Crossref, Google Scholar
- (2022) A framework for analyzing influencer marketing in social networks: Selection and scheduling of influencers. Management Sci. 68(1):75–104.Link, Google Scholar
- (2021) Incentives can reduce bias in online employer reviews. J. Experiment. Psych. Appl. 27(2):393–407.Crossref, Google Scholar
- (2014) Promotional reviews: An empirical investigation of online review manipulation. Amer. Econom. Rev. 104(8):2421–2455.Crossref, Google Scholar
- (1974)
Conditional logit analysis of qualitative choice behavior . Zarembka P, ed. Frontiers in Econometrics (Academic Press, New York), 105–142.Google Scholar - (2012) Online product opinions: Incidence, evaluation, and evolution. Marketing Sci. 31(3):372–386.Link, Google Scholar
- (2009) Temporal sequence effects: A memory framework. J. Consumer Res. 36(1):83–92.Crossref, Google Scholar
- (2020) An emotional recommender system for music. IEEE Intelligent Systems 36(5):57–68.Crossref, Google Scholar
- (2013) Loan availability and investment: Can innovative companies better cope with loan denials? Appl. Econom. 45(36):5001–5011.Crossref, Google Scholar
- (1986) Attention, similarity, and the identification–categorization relationship. J. Experiment. Psych. General 115(1):39–57.Crossref, Google Scholar
- (2003) The time course and impact of consumers’ erroneous beliefs about hedonic contrast effects. J. Consumer Res. 29(4):507–516.Crossref, Google Scholar
- (1980) A cognitive model of the antecedents and consequences of satisfaction decisions. J. Marketing Res. 17(4):460–469.Crossref, Google Scholar
- (1990) Mood and memory under natural conditions: Evidence for mood incongruent recall. J. Personality Soc. Psych. 59(2):321–336.Crossref, Google Scholar
- (1990) The attention system of the human brain. Ann. Rev. Neurosci. 13(1):25–42.Crossref, Google Scholar
- (1998) Effects of perceptual fluency on affective judgments. Psych. Sci. 9(1):45–48.Crossref, Google Scholar
- (2020) The enhancing versus backfiring effects of positive emotion in consumer reviews. J. Marketing Res. 57(2):332–352.Crossref, Google Scholar
- (1991) Evaluations of pairs of experiences: A preference for happy endings. J. Behav. Decision Making 4(4):273–282.Crossref, Google Scholar
- (1989) Affect grid: A single-item scale of pleasure and arousal. J. Personality Soc. Psych. 57(3):493–502.Crossref, Google Scholar
- (2020) The polarity of online reviews: Prevalence, drivers and implications. J. Marketing Res. 57(5):853–877.Crossref, Google Scholar
- (1983) Mood, misattribution, and judgments of well-being: Informative and directive functions of affective states. J. Personality Soc. Psych. 45(3):513–523.Crossref, Google Scholar
- (2003) Mood as information: 20 years later. Psych. Inquiry 14(3–4):296–303.Crossref, Google Scholar
- (1995) The effects of mood state on judgemental accuracy: Processing strategy as a mechanism. Cognition Emotion 9(5):417–438.Crossref, Google Scholar
- (2025) Online learning with sample selection bias. Oper. Res. 73(5):2458–2476.Link, Google Scholar
- (2021) Sequence effects of city tour experiences: A tourism fatigue perspective. J. Destination Marketing Management 21:100646.Crossref, Google Scholar
- (2018) Multiattribute loss aversion and reference dependence: Evidence from the performing arts industry. Management Sci. 64(1):421–436.Link, Google Scholar
- (2009) Discrete Choice Methods with Simulation, vol. 2 (Cambridge University Press, Cambridge, UK).Crossref, Google Scholar
- (1991) Endowment and contrast in judgments of well-being. Subjective Well-Being: An Interdisciplinary Perspective 21:101–118.Google Scholar
- (2019) The service recovery journey: Conceptualization, integration, and directions for future research. J. Service Res. 22(2):103–119.Crossref, Google Scholar
- (1992) Experiences extended across time: Evaluation of moments and episodes. J. Behav. Decision Making 5(3):169–185.Crossref, Google Scholar
- (2004) Service encounters as a sequence of events: The importance of peak experiences. J. Service Res. 7(1):53–64.Crossref, Google Scholar
- (2018) Item recommendation on monotonic behavior chains. Proc. 12th ACM Conf. Recommendation Systems (RecSys ’18) (Association for Computing Machinery, New York), 86–94.Google Scholar
- (2018) A content-based recommender system for computer science publications. Knowledge Based Systems 157:1–9.Crossref, Google Scholar
- (1997) Habits and the anomalies in intertemporal choice. Management Sci. 43(11):1552–1563.Link, Google Scholar
- (1988) Development and validation of brief measures of positive and negative affect: The PANAS scales. J. Personality Soc. Psych. 54(6):1063–1070.Crossref, Google Scholar
- (2010) Econometric Analysis of Cross Section and Panel Data, vol. 108, no. 2 (MIT Press, Cambridge, MA), 245–254.Google Scholar
- (2021) Expertise makes perfect: How the variance of a reviewer’s historical ratings influences the persuasiveness of online reviews. J. Retailing 97(2):238–250.Crossref, Google Scholar
- (2015) A meta-analysis of electronic word-of-mouth elasticity. J. Marketing 79(2):19–39.Crossref, Google Scholar

