


How APIs Create Growth by Inverting the Firm
Abstract
Traditional asset management strategy has emphasized building barriers to entry or closely guarding unique assets to maintain a firm’s comparative advantage. A new “inverted firm” paradigm, however, has emerged. Under this strategy, firms share data seeking to become platforms by opening digital services to third parties and capturing part of their external surplus. This contrasts with a “pipeline” strategy where the firm itself creates value. This paper quantitatively estimates the effect of adopting an inverted firm strategy through the lens of application programming interfaces (APIs), a key enabling technology. Using both public data and those of a private API development firm, we document rapid growth of the API network and connecting apps since 2005. We then perform difference-in-difference and synthetic control analyses and find that public firms adopting public APIs grew an additional 38.7% over 16 years relative to similar nonadopters. We find no significant effect from the use of APIs purely for internal productivity: the pipeline strategy. Within the subset of firms that adopt public APIs, those that attract more third-party complementors and those that become more central to the network see faster growth. Using variation in network centrality caused by API degradation, an instrumental variables analysis confirms a causal role for APIs in firm market value. Finally, we document an important downside of public APIs: increased risk of data breach. Overall, these facts lead us to conclude that APIs have a large and positive impact on economic growth and do so primarily by enabling an inverted firm strategy.
This paper was accepted by D. J. Wu, information systems.
Funding: This work was partially supported by Mulesoft and Apigee Corporation.
Supplemental Material: The data files and online appendix are available at https://doi.org/10.1287/mnsc.2023.4968.
1. Introduction
In the information age, the value of a firm rests fundamentally on how it gathers, shares, and processes information.1 Although traditional approaches to asset management have emphasized closely guarding a firm’s comparative advantage, a new digital management paradigm has emerged. This new approach relies on data’s nonrival property, allowing it to be shared. Value creation and value capture based on regulating data access lead to an “inverted firm,” where production moves from inside to outside. Third parties, and not just insiders, create much of the value. If openness creates a large-enough ecosystem of interactions, then capturing even a small share of the resulting surplus can greatly benefit the inverted firm. Many of the world’s most successful companies, such as Alphabet, Meta, and Amazon, have developed platforms that use their centrality in the digital economy to coordinate and monetize the activity of others.
Key to the inverted firm strategy is the public application programming interface (API). APIs are tools and protocols that allow computers to easily communicate with each other (Jacobson et al. 2011). Web accessibility allows public APIs to serve as conduits to business processes that the firm itself controls. APIs offer the dual virtues of practical modular design and precise metering of access: foundations of a digital ecosystem.
This paper investigates the inverted firm and pipeline strategies through the lens of public APIs, a core enabling technology. We provide empirical evidence that employing APIs helps firms grow and that they do so primarily by inverting the firm, enabling third-party complementors, rather than improving the firm’s own value creation. Production, enabled and moderated by APIs, moves from inside to outside the firm. We also find that wealth created by these strategies is of massive scale, increasing the market value of public firms an additional 12.9% versus similar firms two years after adoption. Although this alone is large, it excludes the growth induced in the thousands of smaller firms that build on these platforms.
We document the development of the public API network that links the business interests of companies together through a matrix of third-party applications calling one or more APIs. Using summary statistics, difference-in-difference estimates, instrumental variables (IVs), and synthetic control analyses, we document strong growth in market value among firms that adopt public-facing APIs. This positive effect is not limited to large technology firms; we find a positive effect of similar magnitude for smaller publicly traded firms and those in other industries. We further show that high third-party engagement with APIs predicts particularly large gains. Firms with APIs that have more followers, developers, and connected apps see significantly larger growth.
The value from external connections is not just because of volume but also because of network position. Firms with more central APIs grow faster. The 14 public firms with APIs ranked in the top 40 by betweenness centrality added $6.6 trillion in market value from Q1 2007 to Q3 2020, a significant fraction of the U.S. public equity market’s appreciation over that time. We confirm that this relationship is causal via an instrumental variable analysis. When central APIs are degraded, they change the network centrality of other APIs. This variation shows a causal role for API network centrality in firm market value.
On the other hand, firms that use APIs exclusively for internal efficiency gains do not see statistically significant growth in market value after adoption. We further test the hypothesis that APIs create internal benefits, in particular the efficiency benefit of lowering adjustment costs, by measuring the evolution of a firm’s Ratio of output to capital (Q)—the ratio of market value to book value. If APIs primarily help firms by reducing adjustment costs, successful API-adopting firms should not see large market value growth after controlling for their asset growth. We find the opposite: evidence consistent with API benefits derived from an external ecosystem.
Finally, we investigate an important downside of external API adoption. This is the risk of data breaches. We find that firms with public APIs see significantly increased risk of hack events in the years after opening an API. This result remains after controlling for API popularity. Private APIs do not create the same exposure risk. Thus, public APIs offer greater gains along with higher risks, an important information systems trade-off. We further find that, for a subset of firms whose API traffic we can observe, hack events cause an increase in testing and log-in authorization data flows and a decrease in internal communications flows, indicating that firms adapt their API use in order to manage exposure risk.
2. Theoretical Development and Hypotheses
2.1. The Inverted Firm
The rise of information and communication technologies in the 1990s and the rise of Web 2.0 user-generated content in the 2000s have given companies vast new data and data processing capabilities (O’Reilly 2009). Companies can store, transmit, and analyze data at much lower marginal cost than before the digital revolution. These empowered companies have faced the question of how to monetize their newfound capabilities. Traditional approaches to profiting from a new resource, such as the resource-based view (Wernerfelt 1984), focus on keeping the asset in a secure vertical stack so that competitors cannot copy its value. Alternatively, the firm erects barriers to entry to sustain higher margins (Porter 2008). This might be called a “pipeline” business model because the firm itself designs a product or service, produces it, and then sells it to an end consumer (Van Alstyne et al. 2016), adding value at each step of the value chain (Porter 2001). This approach has the advantage of giving the firm maximum control, maintaining margins, and lessening the chance that a key competitive advantage falls into the hands of rivals.
Although numerous firms have taken that route, the inverted firm takes an alternate approach and seeks to create an external ecosystem of partners and complementors (Parker et al. 2016, Van Alstyne et al. 2016). In a successful platform ecosystem, different types of users—small-scale outside developers, other large firms, or consumers—connect with resources provided by the platform and to each other. In the process, these outsiders can create profitable businesses that rely on the focal firm’s resources and produce valuable complements that enhance its value to ordinary users (Parker et al. 2016).
Anecdotally, the inverted business model dominates the market. In 2020, 7 of the top 10 firms by market value were platforms.2 Sampling from the Forbes Global 2000, platform firms compared with industry controls had much higher market values ($21,726 million versus $8,243 million) and much higher margins (21% versus 12%) but only half the employees (9,872 versus 19,000) (Cusumano et al. 2020).
Why should platform firms be more successful than pipeline firms? Perhaps the most important reasons are that, for many digital products, positive network effects are important and that marginal costs of digital reuse and adding users are low. If the value of a product grows strongly in users and complementors, although marginal costs remain low, then a firm should increase scale as quickly as possible. By contrast, internal growth mechanisms, such as investing in capital, hiring employees, pursuing new markets, and conducting Research and Development can face large delays and adjustment costs. These investment options pose challenging financial trade-offs. Yet, even if the firm faced no adjustment costs, there are outsiders—lead users (von Hippel 1986), employees of other firms (Jacobides et al. 2018), or outside developers (Parker and Van Alstyne 2018)—who might be unknown to the firm or otherwise not available for hire. More people with good ideas always exist outside a firm than inside it,3 and these outsiders might be interested in using the firm’s resources to further their own ends. Theory suggests that if the potential of third-party complementors is large enough, then the structure of the firm shifts. Inverting a firm and taking a small share of the vastly larger surplus created become the profit-maximizing strategy (Parker et al. 2017).
2.2. Public APIs and the Inverted Firm
The technical difficulty in creating an inverted firm is finding the right way to externalize internal resources. Ideally, the method would be modular, recombinable, and permissionless yet meterable. A modular sharing system will be more robust to unanticipated shocks, allowing third parties to trust that the source will be reliable. Modularity also contributes to recombination. Reuse, or combinatoric innovation, is the ability remix data, software, or services in surprising and value-creating ways (Weitzman 1998, Baldwin and Clark 2000). Finally, the ways that inverted firms share their data must be permissionless yet excludable. Negotiating access rights to digital services is one of the most important adjustment costs for any digital firm. For an inverted firm to succeed, third-party developers must have permission to experiment with and profit from using the inverted firm’s resources. Developers can also prefer not to disclose their own innovation plans for fear of misappropriation (Chesbrough and Van Alstyne 2015). At the same time, the focal firm needs a way to meter outsider access, to guard against malfeasance, and to monetize their most successful complementors.
APIs have all these characteristics. An API is a set of routines, protocols, and tools that standardizes building software applications compatible with an associated program or database (Ofoeda et al. 2019). APIs are codes that control access to information. They can also be thought of as contracts (Jacobson et al. 2011). They govern the type and format of calls or communications that any application can make of another associated program. The answering program is agnostic about the source of the call yet can enforce access permission, and the calling program does not need to know anything about the internal workings of the answering program.
APIs simplify the writing and operation of programs that communicate with online services and shared databases. They are essential for powering such systems as Google’s documents and maps, Amazon’s voice and web services, Apple’s online market, Walgreens’ photo printing, Nike’s fitness trackers, and Facebook’s authentication services. They mediate economic transactions. Their value is not only determined by the actions of their creators but also by the habits of their users and the strategic choices of third parties that connect systems and reuse components in unanticipated ways (von Hippel 1989).
APIs can be public or private. It is the public APIs, ones that can be accessed without permission by third parties, that are essential to an inverted firm. A public API is an externalization and modularization of one’s technology stack. What was previously a black box is now available to others in easily understood and recombinant modules (Zachariadis and Ozcan 2017). A seminal open-innovation paper suggests two kinds of advantage. From the “outside-in” perspective, APIs allow the firm to pull ideas from external sources without having to generate them. Firms can acquire innovations built on top without having to even conceive them. From the “inside-out” perspective, APIs let others build upon and repurpose parts of the firm’s tech stack. They foster a vibrant ecosystem of complementors. Together, these provide alternative revenue streams, broaden technology adoption, and potentially reduce internal costs for sustaining that technology over time (Enkel et al. 2009).
Indeed, there is a historical relationship between APIs and inverted, platform firms. APIs only fully came into their own in the internet era.4 Many web pioneers featured APIs as core to their businesses. Salesforce.com included them in their 2000 launch of the world’s first “software-as-a-service” product. Likewise, eBay launched a developer program in 2000 to a select group of partners, encouraging them to create services that drew information from eBay’s API. Having created one of the first popular open APIs, eBay’s decision led to a virtuous cycle of better tools, higher visibility, and more customers. Perhaps the most iconic effort to place APIs at the center of a firm’s strategy was Bezos’ “Big Mandate” of 2002. Frustrated by the haphazard way Amazon solved its digital challenges and hoping to turn hard-won lessons into new sources of revenue, he demanded, among other things, the following.
All teams will henceforth expose their data and functionality through service interfaces.
There will be no other form of interprocess communication allowed: no direct linking, no direct reads of another team’s data store, no shared-memory model, no backdoors whatsoever. The only communication allowed is via service interface calls over the network.
All service interfaces, without exception, must be designed from the ground up to be externalizable. That is to say, the team must plan and design to be able to expose the interface to developers in the outside world. No exceptions (Nordic APIs 2021, citing Yegge).
How was it that a book seller came to be the world’s largest web services provider? In Working Backward: Insights, Stories, and Secrets from Inside Amazon, Bryar and Carr (2021) give an insider’s answer to that question. Amazon launched the “Amazon Product [Advertising] API” in 2002. This tool allowed outsiders to build links to Amazon product listings into their apps and websites. Announcing the project launch, Jeff Bezos remarked, “We’re putting out a welcome mat for developers-this is an important beginning and new direction for us … Developers can now incorporate Amazon.com content and features directly onto their own websites. We can’t wait to see how they’re going to surprise us.”5 The program attracted over 25,000 users in the first year. One of the biggest surprises was that internal Amazon developers often preferred using resources from the public API to Amazon’s internal tools. The success of the product API led Amazon management to consider other internal strengths they could externalize and monetize, such as data storage and messaging. Amazon launched the Amazon S3 API to provide an inexpensive simple storage solution. Amazon’s EC2 API, providing elastic cloud computing, quickly followed.
APIs brought results. By 2013, Amazon’s marketplace featured more than 2 million third-party sellers, accounting for roughly 40% of total sales. In 2020, Amazon Web Services, including S3 storage and EC2 computing, earned over $46 billion in revenue (Furrier 2020). Using partner sales data, Amazon has also moved to vertically integrate into 3% of its partners’ top-selling products (Zhu and Liu 2018). Amazon’s market capitalization has duly expanded. Bezos’ gamble that there was more money in managing bytes than managing books succeeded handsomely.
2.3. Hypotheses
We seek to test the hypothesis that a firm inversion strategy, as enabled by public APIs, has been a major driver of market value growth for U.S. publicly traded companies. This paper is the first to empirically test this hypothesis. Key thesis elements include that (i) public firms benefit from sharing data and digital services, that (ii) the magnitude of benefit increases in the number of third-party developers that the firm attracts, and that (iii) benefits increase in API network centrality within a digital ecosystem.
At the highest level, our hypothesis is as follows. “Firms increase their market value by building a network of outside complementors. Firms more central in API networks capture more value.” If this theory is correct, several empirical observations follow. We would expect to see public API-adopting firms increase their market value and that the size of this gain should be related to the network of third-party developers attracted. Importantly, the benefit of inversion is not simply a one-time step function but a growth benefit that increases over time as usage creates data, which create value, attract partners, and beget usage. Further, inverted firms should manifest their market value growth not simply by scaling their assets but by capturing value from these outside partners. Finally, firms with successful public APIs should benefit more than firms implementing private APIs.
This high-level hypothesis leads us to three specific hypotheses that we empirically test in the remainder of the paper. Figure 1 summarizes these hypotheses in a directed acyclic graph.

Notes. The path involving third parties is nonexclusive and can potentially create much more value. Thus, engaging others might create more value than working alone, leading to an inverted firm. H, hypothesis; MV, Market Value.
Implementing APIs increases firm market value over time.
Our first hypothesis is that API-adopting firms will see increases in market value that may exhibit lags between technology implementation and growth realization. We have much anecdotal evidence on the success of inverted firms, and therefore, we expect APIs, the key enabler of this strategy, to lead to positive outcomes. However, there are also reasons to believe that this IT investment will not work. Many IT adoption projects fail. A 2019 Forrester analyst report to CIOs observes that, on average, IT investments have led to stagnation (Bartels 2019). U.S. productivity growth plateaued at 1% after 2010, yet IT investments rose at a rate of 5% over that same period.
There are several reasons why API investment might have limited to no effect. First, internally, managers should invest in any asset, not just APIs, up to the point where marginal benefit equals marginal cost. APIs have existed since at least 1961, suggesting that consequences from new investment might be strictly marginal. Market capitalization, in particular, might change little as it aggregates across all firm activities. Second, externally, if firms are observed gaining advantage from APIs, then competitors should also invest and compete away that advantage. Competitors’ investments restore a balance of normal profits. Third, external developers are not employees. Firms that open APIs often have no idea who the developers are. If developers choose not to engage with or use the APIs, then no external value is created. Voluntary third-party investment that never materializes cannot drive value. Fourth, empirical research suggests that IT investments frequently fail to deliver promised productivity gains. The 2019 analyst report to CIOs that highlighted stagnant growth from IT investment also noted that, at the sector level, the relationship between IT investment and growth was often negative (Bartels 2019). Overlapping our research window, that study impugns any notion that investments in digital transformation, like those in electronic data interchange (EDI), enterprise resource planning (ERP), customer relationship management (CRM), electronic health records (EHRs), and others, unconditionally deliver positive outcomes. Forrester’s conclusion is consistent with recent (Brynjolfsson et al. 2018) and early (Brynjolfsson et al. 2002) academic research that IT investments alone can produce negligible value or even periods of negative value. To create value, they need to be coupled with complementary investments in organizational capital and other intangible assets. Absent complementary investments in new processes, products, and business models, we should not expect observable changes in market value. IT investments have a history of not affecting aggregate market value (Tam 1998).
We theorize that APIs may drive value through internal and external mechanisms. By external mechanisms, we mean the inverted firm hypothesis: third-party value creation that expands the boundaries of the firm. By internal mechanisms, we mean private value creation that does not expand the boundaries of the firm. APIs may create internal value and drive profits through new products or new sales channels, as in the case of reaching customers via mobile phones (Iyer and Henderson 2010). Additionally, APIs grant firms metered control over outside access and the ability to capture new data. This can help firms price discriminate among existing products while enabling new kinds of digital services (Tiwana et al. 2010). APIs are more modular than traditional code, potentially increasing effectiveness through data and software access, reuse, and recombination within the firm (Baldwin and Clark 2000, Yoo et al. 2012). They facilitate deprecation of old technology (Jacobson et al. 2011). The potential to remix resources in new ways creates option value (Baldwin and Clark 2006). This expands a firm’s dynamic capabilities by providing low-cost variation and selection of business routines (Teece 1988, Eisenhardt and Martin 2000). They facilitate the remixing of disconnected resources or pockets of expertise (Purvis et al. 2001), facilitate the integration of new software into legacy software (Joseph et al. 2016), and speed IT deployment (Iyer and Subramaniam 2015). They help firms raise labor productivity for a given expenditure on programmers (Brynjolfsson and Hitt 2000). Thus, one of the main theories supporting APIs is their ability to lower adjustment costs. Summarizing leads to the following hypothesis.
Implementing APIs increases market value via internal value creation.
Although it is possible that APIs increase firm value through internal mechanisms, our core hypothesis is that public APIs enable an inverted firm strategy that benefits the firm through the expansion of firm boundaries. Public APIs facilitate development of third-party complements (Parker et al. 2017). APIs differ in important ways from earlier outsourcing, back-office, and front-office technologies, such as EDI, ERP, CRM, and EHR. These legacy technologies targeted internal employees or known contractors. By contrast, public APIs specifically emphasize permissionless innovation by unknown partners, which generate uses of digital assets of which the firm never conceived (Chesbrough and Van Alstyne 2015, Thierer 2016, Parker et al. 2017). Salient illustrations of this external value add include the numerous apps sold by Apple, Amazon, and Google that were never conceived by these platforms themselves. More permissive licensing, which is enabled by APIs, has been shown to increase complementary device development among handset manufacturers (Boudreau 2010). Platform banks have opened APIs as a means to invite fintechs to offer complementary banking services (Zachariadis and Ozcan 2017). This leads us to our next hypothesis.
Implementing APIs increases market value via external value creation.
One approach to distinguishing between Hypotheses 1a and 1b is based on standard theories in finance. If APIs boost internal efficiency and make it easier to repurpose capital, then it will boost firms’ capital investments. This would show up in the data as a decrease in Q—the ratio of market value to installed capital. Alternatively, if APIs primarily boost value by “inverting the firm” and causing third parties to make capital investments, then the portion of firm value not explained by its own capital stock will increase as a function of API adoption. A second way we distinguish between these hypotheses includes splitting the sample into public versus private APIs and by investigating the relationship between market value growth and third-party engagement.
Under the inverted firm hypothesis, public APIs do not automatically create value for their host firm. Rather, only public APIs that nurture a rich ecosystem of third-party developers will create value. APIs are more than technical plumbing designed to decrease transaction costs or increase efficiency. They enable markets. The consequence is not merely a shift from hierarchies to markets or a shift in the “make-versus-buy” decision (Malone et al. 1987). Instead of entering the market as a more efficient player, the focal firm becomes a market, an orchestrator of other firms’ transactions. Orchestrating a market gives the platform visibility into the data passing through its systems, which provides insights into competitors’ activities, margins, and opportunities (Khan 2017). This yields a strategic information asymmetry that favors the platform sponsor at the expense of the platform partner (Zhu and Liu 2018). This advantage has risen to the point of antitrust scrutiny(Schulze 2019, Cabral et al. 2021). Using an API strategy to orchestrate third-party value creation, which the focal firm can then monetize, is the key to inverting the firm (Parker et al. 2017) as value creation shifts from inside to outside. This shift is reflected in the following hypothesis.
The network structure of applications that call APIs affects the market value of firms that implement them. Firms with higher API network centrality, more connections, and larger effective network sizes have higher market value.
Once a firm opens to third parties, the opportunity for interactions among those parties creates new avenues for value creation and value capture. We hypothesize that firms with APIs that are more central to the network of data flows will see increased market value and that this is in part because of being able to capture a larger share of the surplus from the digital economy.
The insight that network structure influences resources available to parties embedded in that structure underpins a vast literature spanning decades of research (Simmel 1922; Moreno and Jennings 1938; Granovetter 1973; Baker 1990; Burt 1992, 2009; Padgett and Ansell 1993; Uzzi 1997; Hansen 1999; Podolny 2001; Reagans and Zuckerman 2001; Aral and Van Alstyne 2011). The central argument is that structurally diverse networks provide access to diverse resources. APIs can confer gatekeeper power. Controlling the bottlenecks in that structure provides the means to broker opportunities (Granovetter 1973, Burt 1992), improve decisions (Hansen 1999), resolve uncertainty (Podolny 2001), boost productivity (Aral and Van Alstyne 2011), innovate (Reagans and Zuckerman 2001), and extract rents from the digital economy (Burt 2009). Key measures of structural position include betweenness centrality, which measures the frequency of being on a shortest path (Borgatti 2005), and effective size, which measures diversity (nonredundancy) and reach among network contacts (Burt 2009). If APIs provide orchestration and innovation benefits, why might firms fail to adopt them? One reason for reluctance is the fear that malicious actors may pose as legitimate users and steal a firm’s sensitive data. APIs can facilitate illegitimate access and increase the risk of data breach. This leads to our final hypothesis.
Implementing external APIs can create security holes, increasing the risk of data breach.
There are considerable downside risks to allowing third parties access to a firm’s private data. Notable data breaches tied to API flaws are numerous (Gates 2019). APIs were implicated in a hack that released compromising and very private photos of celebrities stored on Apple’s iCloud (Berlind 2015). Security holes because of APIs have been a particular concern in open banking (Zachariadis and Ozcan 2017). Another API vulnerability allowed use of nothing more than a license plate to breach an insurance company and learn all movements of a car, its position in real time, and its owner’s name (Scarpino 2017). The CEO, CIO, and CSO of the credit scoring bureau Equifax all resigned after an API hack released the personally identifiable information of 143 million people (Gates 2019). Hack losses reached more than $1.6 billion (Lane 2020). T-Mobile announced an API data breach had exposed private data of more than 2.3 million users (Spring 2018). Google shut down Google+, its much maligned social networking venture, after revealing that the private data of more than 52 million users had been exposed to third parties through its APIs (Newman 2018). Poor choices by API suppliers can also compromise data. One suite of Microsoft APIs remained open by default, inadvertently exposing 38 million records across dozens of firms and government bodies (Dignan 2021). The editor-in-chief of ProgrammableWeb observes that API security “is so hard that even the biggest companies with the deepest pockets to hire the best talent make mistakes” (Berlind 2017).
Each of these breaches illustrates a “leaky API,” one that is vulnerable to hacking, misuse, or unintended disclosures because third parties are not properly metered or controlled when they request data. Open systems are more susceptible to hacking. Ransbotham (2016) finds that open-source software—although often functionally superior—is exploited earlier and more often relative to closed-source software.
Cyberattacks have negative financial consequences for firms and their CEOs. Kamiya et al. (2021) find that cyberattacks are associated with reductions in sales growth, investment, and stock market performance. They reduce CEO bonuses. Makridis and Dean (2018) match data breach reports from the Privacy Rights Clearinghouse (PRC) Compustat financial data and find that a 10% rise in records breached is associated with a 0.2% fall in firm productivity. Spanos and Angelis (2016) perform a systematic literature review of the impact of information security events on stock market outcomes. They review 45 studies from 37 papers. Over 75% of these studies find a statistically significant effect of digital security events on stock prices.
3. Data
Our paper draws on four main sources of data. These are (1) Compustat data on finances of publicly traded firms, (2) data on public APIs and their connections to third-party apps (mash-ups) from the ProgrammableWeb crowdsourced directory, (3) the Privacy Rights Clearinghouse for data breach events as matched to Compustat by Rosati and Lynn (2021), and (4) proprietary data on internal API usage from a private provider of API creation tools.
3.1. Financial Outcomes
Firms’ financial performance is provided by Compustat, which measures market capitalization and other covariates at the quarterly level. Our sample runs from Q1 2007 through Q3 2020.
3.2. Public APIs
Our main data source on firms’ API usage comes from ProgrammableWeb, a crowdsourced database of public APIs and the apps that call them. Data used for this analysis were collected in winter 2020. APIs were categorized and matched to the firms that sponsored them by a team of research assistants and checked by the authors. ProgrammableWeb also has data on apps calling one or more APIs, called “mash-ups” by ProgrammableWeb, emphasizing the role they play in recombining information from disparate sources. Submitters label these apps with various tags useful for categorization.
ProgrammableWeb data include the dates an API was first submitted and the list of apps calling that API. We also collect the number of users who express interest in an API (followers) and those who claim to work on applications using that API (developers), as well as the number of updates the API has undergone. All APIs with at least 15 followers, of which there were 3,402, were matched to the firms that own them. The majority, 63.1%, were associated with nonpublic for-profit companies, whereas 19.6% of these APIs were associated with publicly traded firms, 3.2% were associated with governments, and 8.1% were associated with nonprofit organizations.6 Of the 206,411 follows of APIs with at least 15 followers, 33% are of APIs created by public firms. Firms with APIs tend to have higher market value than firms without APIs. We further categorized apps as primarily B2B, B2C, both, or unclassifiable. API orientation is split roughly evenly between B2B and B2C APIs (APIs classified as “both” are associated with both categories for the purpose of summary statistics and regressions).
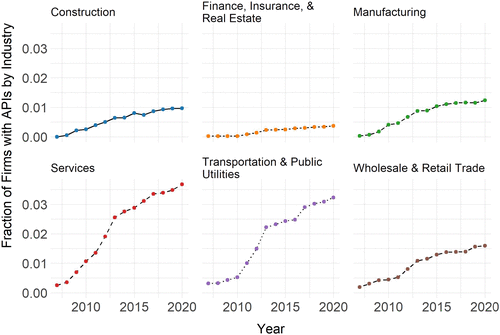
Matching ProgrammableWeb data to Compustat allows us to track API usage across sectors and time. Figure 2 plots the fraction of firms by one-digit Standard industry code (SIC) code that have at least one public API over the sample period. API use diffused across all sectors, with use in services and in transportation and public utilities growing the fastest. By the end of the sample period, roughly 3.5% of firms matched to Compustat in the services sector have public APIs, and 3% of firms in transportation and public utilities have public APIs. Online Appendix Figure A1 reports the fraction of firms with at least one API by two-digit SIC code circa Q3 2020. We see that air transportation firms are the most likely to have public-facing APIs, followed by firms in apparel, business materials, business services, and miscellaneous manufacturing industries.
Source. ProgrammableWeb and Compustat.
3.2.1. API Network Statistics.
Using ProgrammableWeb’s list of apps that connect to public APIs, we trace out the network of APIs connecting firms. For the subset of firms whose APIs connect to this network, we compute a series of network statistics. Each node corresponds to a firm’s API, and each link connects a firm’s APIs via third-party applications.
We compute three network statistics for a given API: betweenness centrality (White and Borgatti 1994), degree (Diestel 2005), and effective network size (Burt 1992). Betweenness centrality calculates the share of shortest paths between nodes in the network that pass through a given node. Degree sums the total number of connections between a node and other nodes. Effective network size captures nonredundant connections that each node provides. This measure calculates effective network size as the number of connections minus redundant connections between nodes. Network theorists refer to the latter measure as capturing a measure of “structural holes” within a network (Burt 2009). Nodes that rank high in effective network size act as structural bridges between sections of the network. Firms may operate several APIs; thus, we calculate averages, maximums, and sums of these network statistics across all the APIs a given firm operates for each quarter in which it has at least one operational API. For ease of interpretation, these network statistics have been centered and scaled. For the top 40 APIs by betweenness centrality, we also hand collected data on whether and when the API experienced a shutdown or reduction in functionality. We found that one API was completely shut down, that two were replaced with similar APIs, and that five experienced significant reductions in functionality. Online Appendix Table A1 reports summary statistics for the paired ProgrammableWeb data, Privacy Rights Clearinghouse data, Compustat data, and proprietary data from a consulting company that generates internal APIs.
3.3. Private APIs
We received proprietary data from a consulting firm that offers API development tools, implements APIs, and offers hosting services on behalf of API adopters. Many of the APIs are not published on ProgrammableWeb, as their use is restricted to actors within a firm. We matched this list of private APIs to our Compustat and ProgrammableWeb data. Some firms that operate public APIs also operate private APIs with the help of our API consulting company.
To measure the effect of purely internal APIs, we identify that subset of firms from this proprietary data set that do not have any APIs reported on ProgrammableWeb. This subsample leaves only internal API use as the treatment. In this sample, private APIs are less popular than public APIs, with approximately 0.7% of firm-quarters representing internal API use. The bulk of APIs, however, are private (Jacobson et al. 2011). Data on API flows from this data set are summarized in Online Appendix Table A2.
The API management firm also provided us with monthly records of API use for 273 separate accounts. These include the name of each API used as well as the number of calls and bytes processed by each API in a given month. Data on calls processed by partner firms’ APIs span December 2012 to September 2016. Data on bytes processed span December 2012 to May 2016. We designate the first date that we observe any call to any of a firm’s APIs as the API adoption date. Online Appendix Table A2 reports the total number of APIs, API calls, and API bytes of data flow that we observe in each month. We have 2,453 firm-months of API usage data. The average firm has 160 million API calls in a given month as well as 1.98 trillion bytes of data. The average firm in this source of API data has 31.4 APIs.
3.4. Breach Data
The PRC records public breach announcements as matched to Compustat firms by Rosati and Lynn (2021). We collect data for all public and private firms we observe using APIs from 2005 to 2015.7 PRC distinguishes six different breach types. “PHYS,” “PORT,” and “STAT” events involve the theft of physical storage media, paper documents, and stationary devices, respectively. “INSD” events involve breach events from insiders as well as malicious outsiders who have compromised insider credentials. “DISC” events are unintended disclosures. “HACK” events are incidents of hacking or malware leading to the data breach.
4. The API Network
This section characterizes the evolution of the economy’s API network. Figure 3 presents the API network as recorded in the ProgrammableWeb directory through Q3 2020. Nodes in this graph correspond to APIs. Edges connect APIs when an app calls both. Node colors correspond to the company associated with the API. Edges are colored according to the functionality of the app that calls them. For example, DeployPlace is an app designed as a developer tool. It interacts with the Amazon S3 and Gmail APIs, among others. Therefore, there is at least one yellow-green line connecting these two APIs, indicating they are connected by a productivity-focused API. Similarly, the ecomdash service, an app involved in e-commerce, calls both the Amazon Product Advertising and eBay APIs. This is visualized by at least one green edge connecting the two nodes.
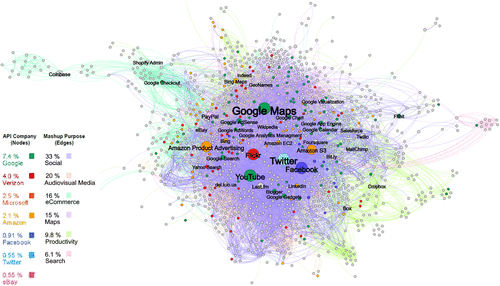
Notes. Larger nodes indicate higher API centrality. The 40 nodes with the highest betweenness centrality are labeled. Node colors represent API sponsors (see the key). APIs from other firms are gray. Edges exist between any pair of APIs called by the same app. Edge color indicates the functionality of the app calling the APIs
Several phenomena emerge from visual inspection of Figure 3. First is the relative frequency of companies appearing in the API network. The prevalence of green and orange nodes indicates the network importance of Google/Alphabet and Amazon. Perhaps more surprising is the number of red nodes associated with Verizon/Yahoo. Facebook, Twitter, and eBay are also central to the network but with many fewer nodes.
Online Appendix Figure A2 reports the company, degree, betweenness centrality, and market capitalization growth for the top 40 APIs by betweenness centrality. The top five APIs ranked by betweenness centrality (Google Maps, Twitter, YouTube, Facebook, and Flickr) are also the highest ranked in terms of degree. Unsurprisingly, these five APIs are both extremely popular for app calls and also central to the API network. Google Maps provides essential navigation functionality to a wide variety of apps, and Twitter and Facebook are go-to social media plug-ins, whereas YouTube and Flickr provide popular video- and image-hosting websites.
Lower on the list, we see that some APIs have centrality ranks much higher than their degree. Firms with high betweenness centrality, whatever their degree, play an important gatekeeping role in that sector of the data economy, which can offer profit opportunities. The API with the most extreme discrepancy between its degree and betweenness ranks is CoinBase, which can be seen in the top left of Figure 3. This API is called by apps that also call several cryptocurrency-related APIs (e.g., the Mt. Gox API) and is also connected by apps to several online shopping APIs, such as Google Checkout and PayPal. These edges are all related to e-commerce. Absent API connects to the core of the API network, many cryptocurrencies would be much harder to use in actual transactions. The Shopify API plays a complementary role in the portion of the network devoted to e-commerce, and Dropbox plays a similar role at the nexus of productivity-oriented apps (right side of Figure 3). Subnetworks, organized by purpose, appear in Figure 4. Unsurprisingly, Google Maps is at the center of the mapping network, whereas YouTube and Flickr are more central in the audiovisual media network.

Notes. Five notable features of the subnetworks are as follows. (1) Some APIs are highly central to some subsets of the network, despite being of low degree. For example, the Coinbase API is highly central in the e-commerce subnetwork, despite having low degree. (2) Dropbox, Box, Salesforce, and Amazon S3 are more central in the “productivity” subnetwork. (3) Google Maps is central in many subnetworks but especially the Maps subnetwork. (4) Also important in the maps subnetwork is GeoNames, one of the most important nonprofit-supported APIs. (5) Facebook, Twitter, and YouTube are especially central to the social media subnetwork, but they are also central in almost all subnetworks.
Firms with central APIs saw dramatic increases in market value over our sample period. The 14 publicly traded firms that have APIs ranked in the top 40 by API betweenness centrality added $6.584 trillion to their market value from 2005 to 2021. This constituted a 580.8% increase in value for the seven firms that were publicly traded for that entire period. By comparison, the entire U.S. stock market grew by $16.89 trillion or 99.3% from 2005 to 2019.8 The growth of the 14 firms at the center of the API network represents approximately a third of U.S. market value growth over the time period under consideration.
Creating a top API without large growth in market value is rare. Most top APIs are governed by publicly traded companies. Only 2 of the top 40 APIs by betweenness centrality (5%) are governed by nonprofits. These are GeoNames, a location directory, and Wikipedia, an online encyclopedia. Of all ProgrammableWeb APIs with at least 15 followers, 13.3% are produced by governments or nonprofits, meaning that for-profit companies are overrepresented in the creation of top APIs.
Several notable features stand out concerning API organization. For example, the consumer-facing social (periwinkle) and search (pink) apps densely connect the heart of the API network. APIs connecting these apps, especially Facebook, Twitter, YouTube, and Google Search, might drive engagement for the apps connecting to them. B2C-facing APIs may be better at driving network effects than B2B APIs because it is more immediately obvious to third parties how to incorporate consumer-facing features into their apps.
Unsurprisingly, the most central APIs in the network are also associated with both search or social media. APIs for Facebook, Twitter, and YouTube are some of the most connected APIs. Dropbox, Box, Salesforce, and Amazon S3 are important to the productivity cluster, yet these also include mapping functionality and are close to Google Maps, Indeed, Bing Maps, and GeoNames. The e-commerce cluster shows high density around the Amazon Product API as well as the PayPal and eBay APIs.
Online Appendix Figure A4, which labels nodes for all APIs owned by a given company, gives another view on how each company fits into the API network. Microsoft’s and eBay’s nodes are disproportionately located in the top left corner of the network, connected to each other and the cluster of e-commerce-oriented APIs. Facebook’s nodes are clustered in the bottom right of the figure, located in the heart of the social media subgraph but also closer to the productivity portion of the graph. Apple, despite its huge success as a technology company, is relatively poorly represented, perhaps because of the closed nature of Apple’s technological ecosystem.
Online Appendix Figures A5–A17 visualize the growth of the API network over time. Network density increased substantially in the late 2000s and early 2010s, a period of time when the ProgrammableWeb crowdsourcing was most comprehensive. Note also the early centrality of Flickr, an important early image-hosting website. Although Flickr has since fallen on hard times (supplanted by Imgur and other close substitutes), it remains central to the API network as we measure it. This occurs because we do not observe deprecated APIs in our data when apps stop using them. Importantly, our measure of the API network at any point in time is cumulative and somewhat backward looking for this reason.
5. Market Value Changes Among API Adopters
As shown in Section 4, firms with top APIs have seen tremendous increases in market value over the last 15 years. This section applies two-way fixed effect, difference-in-difference, and synthetic control approaches to estimate the impact of API adoption on a firm’s market value, evaluating Hypothesis 1.
We begin by estimating specification (1):
Table 1 reports the coefficient on post-API adoption using this specification. In the full sample, API adoption is associated with a 38.7% increase in market value. One challenge in understanding this result is determining whether some small subset of firms or industries is driving the results. Thus, the other columns in the table estimate the effect of API adoption on subsets of firms.
|

Table 1. Two-Way Fixed Effect Estimations of the Effect of API Adoption on Log Market Value Following Equation (1)
| All firms | Excluding top 20 firms with most popular APIs | Excluding industries where <1% of firms have APIs | Excluding any computer services firm | Year API open <2012 | Year API open ≥2012 | |
|---|---|---|---|---|---|---|
| Post × API | 0.387*** | 0.370*** | 0.377*** | 0.322*** | 0.750*** | 0.260** |
| (0.0855) | (0.0860) | (0.0856) | (0.0971) | (0.140) | (0.0997) | |
| R2 adjusted | 0.932 | 0.931 | 0.932 | 0.934 | 0.929 | 0.929 |
| Firm FE | Yes | Yes | Yes | Yes | Yes | Yes |
| Quarter FE | Yes | Yes | Yes | Yes | Yes | Yes |
| Observations | 133,202 | 132,446 | 127,796 | 119,201 | 129,670 | 130,040 |
| Firms | 4,647 | 4,627 | 4,478 | 4,060 | 4,556 | 4,561 |
| API adopters | 177 | 157 | 176 | 100 | 86 | 91 |
Notes. Column (1) includes the entire data set, whereas the subsequent columns restrict the regressions to various subsets of the data. Standard errors are in parentheses and clustered at the firm level. The outcome variable is the log market value of the firm. Post × API is a binary variable that equals one if a given firm has a public API operating on a given date. The top 20 firms excluded include Alphabet, Amazon, Apple, eBay, Facebook, FedEx, Groupon, Liberty Expedia, Microsoft, New York Times, PayPal, Pinterest, Salesforce, Spotify, Twilio, Twitter, Uber, UPS, Verizon, and Zillow. Excluded computer services industry refers to firms with SIC code 7370 “computer and data processing services.” FE, fixed effect.
**p < 0.01; ***p < 0.001.
The first subset, shown in column (2), excludes the top 20 firms with the most popular APIs as measured by number of followers on ProgrammableWeb. We see that the estimated coefficient moves down slightly to 0.37 but remains highly statistically significant. The second subset, shown in column (3), excludes firms in industries where less than 1% of firms operate APIs. The concern here is that the comparison group includes firms that could not adopt APIs. We see that the estimated coefficient decreases marginally to 0.377 but remains significant. The fourth subset, in column (5), excludes any firm classified as in the “computer and data services” industry (SIC code 7370), the concern being that only firms with a high degree of complementarities to APIs stand to benefit from them. We see the estimated coefficient attenuate to 0.322 but remain statistically meaningful. Finally, the last two columns separate the sample into firms that first operate APIs prior to and after 2012. This would be a concern if there was a significant first-mover advantage to the API network, which has subsequently been saturated. We see that firms opening APIs earlier stood to benefit more. The estimated coefficient is 0.75 when excluding APIs opened prior to 2012 and 0.26 when excluding firms opening APIs before then. Both estimates are statistically significant.
To further demonstrate that benefits from APIs are not restricted to the largest firms with greater market values, Online Appendix Table A3 estimates a quantile regression model of the baseline model 1, showing the estimated impact of API adoption on different quantiles of firm market value. We estimate that firms at the 10th percentile of market value gain 42.5% in market value from adopting APIs and that firms in the 90th percentile of market value gain 34.9% of market value following API adoption.
An important concern about difference-in-difference estimates of this form is that if API adoption has an effect on market value growth rates rather than levels, the estimate of the effect of API adoption will be highly sensitive to the length of the sample. Still, most of the effect we identify from API adoption is coming from across-firm decisions rather than within-firm timing. Online Appendix Table A4 reports a Bacon decomposition of our column (1) estimate and finds that 95% of our effect is identified from different decisions to adopt across firms.
Because API adoption seems to have an effect on market value growth rates rather than levels, it makes sense to reanalyze our results, separately estimating the effect of API adoption by the number of periods since the “treatment” began. This approach also lets us analyze whether there are pretrends in the data. We, therefore, estimate specification (2):
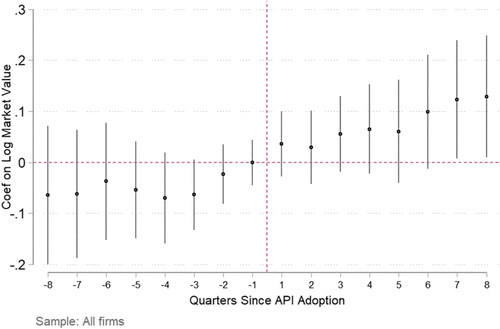
Notes. Standard errors are clustered at the firm level. Online Appendix Table A5 reports these same estimates in table form.
Figure 5 shows that firms adopting APIs saw elevated market value growth beginning soon after adoption and significant growth seven periods, or 1.75 years, after ProgrammableWeb received their first API. Eight quarters after adoption, firms have 12.9% higher market values, a considerable effect. For a $1 billion firm, this represents a $129 million increase in value. Because a typical API enterprise implementation costs $250,000,9 this increase, which already reflects expenditures, represents a return on investment within two years. Splitting the sample into firms with at least one B2C-oriented API versus those with B2B APIs, as Online Appendix Figure A18 does, shows that the effect is driven by B2C-oriented firms. This is consistent with our finding that the most important and central APIs tend to be B2C or “both” oriented (e.g., all APIs in the top five by betweenness centrality in Online Appendix Figure A2 are B2C or “both” oriented).
There is some slight visual evidence of a pretrend in API adoption beginning half a year before the API announcement date. We believe that this is because of anticipatory market value effects (the stock market can bid up the price of a company before a new technology is implemented) and that some APIs are only posted to ProgrammableWeb after a lag. A lag in posting is certainly consistent with ProgrammableWeb’s nature as a crowdsourced data set. Developers who can take early advantage of a new API may be in the best position to post on ProgrammableWeb after using them. Their private knowledge might motivate these individuals to push information about the new API after they had a chance to exploit that knowledge (Hirshleifer 1978).10
Still, this result may lead to concern that our analysis faces a reverse causality problem—in other words, that market value growth causes API adoption rather than vice versa.11
As a first approach to addressing this concern, we conduct a synthetic control analysis of API adoption. Synthetic control analysis creates composite firms of API nonadopters with the same pre-API adoption market value growth trend as adopters. If the API adopters and synthetic non-API-adopting firm have different outcomes postadoption, then the differential is plausibly attributed to adoption itself and not reverse causality.
Figure 6 reports average log market values for API-adopting firms and a composite of synthetic controls for the 20 periods before and after API adoption. The synthetic control was constructed following the Xu (2017) generalized synthetic control procedure based on data for API adopters on only the eight quarters prior to adoption. Despite this, both the treated average and the synthetic control are virtually identical for the 20 periods prior to adoption. Both the average adopter and the synthetic control firm see an increase in market value from about two periods prior to adoption to two periods postadoption. However, after that point, the market value of adopting firms continues to grow rapidly, whereas the synthetic control firms see a large decrease in market capitalization. The nonadopters see a decrease in market value, which is consistent with a business-stealing effect to the advantage of the adopters. A further managerial interpretation is that success in API networks might be because of early mover advantage.
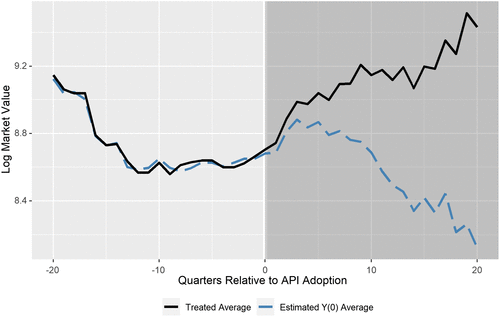
Note. The implied gap is $8.4 billion 20 quarters after adoption.
Table 2 reports the point estimate and confidence interval for the effect of API adoption, again using generalized synthetic control following Xu (2017). This result should be contrasted with the basic difference-in-difference result in column (1) of Table 1. The point estimate of the effect is larger than in the baseline estimate and significant at the 5% level.
|
Table 2. Estimated Average Treatment Effect on Log Market Value and Confidence Interval Using Generalized Synthetic Control
| Average treatment on treated | Standard error | CI lower | CI upper | p-value |
|---|---|---|---|---|
| 0.729 | 0.334 | 0.075 | 1.384 | 0.029 |
Note. Online Appendix Figure A19 reports confidence intervals (CIs) for the treatment effect in each quarter.
As another way to address concerns about a pretrend, we perform power calculations of the pretrend test and examine the biasing effect of possible violations of the parallel trends assumption following Roth (2022). The pretrends test is shown in Online Appendix Figure A22. The red line constitutes a hypothetical linear trend difference between the treated and control groups, illustrating a potential violation of the parallel trends assumption. It represents the largest linear parallel trend violation we would fail to detect with 80% power. The black dots display our estimated time-varying effect of API adoption coefficients from Figure 5 and model Equation (2). Finally, the blue triangles correspond to the hypothetical estimates we would expect to see if there was only the red line linear trend difference between the treated and control groups. Equivalently, the figure displays the estimates we would expect to find if we incorrectly failed to detect the hypothesized nonparallel trend. Our estimated model coefficients, shown in black, are well above the coefficients in the postperiod that we would estimate if there was only this linear trend difference between the treated and control groups. This suggests that our large treatment effect estimates are not solely caused by a violation of the parallel trend assumption.
With evidence in hand that API-adopting firms outperform nonadopters, we proceed to investigating the importance of different proposed mechanisms for APIs’ positive impact.
6. Why APIs Matter: Inverted Firm or Internal Effects?
In our hypotheses and literature review, we pointed to two main classes of mechanisms by which API adoption might help firms. Hypothesis 1a is that they do so through internal productivity effects. Hypothesis 1b is that they do so through inverting the firm. If the inverted firm hypothesis is true, then it is likely that firms that are more central to the public API network especially benefit from it; this is Hypothesis 2. We begin by considering evidence for Hypotheses 1b and 2, and then, we return to the question of whether APIs also have internal productivity effects (Hypothesis 1a).
6.1. Evidence for Firm Inversion
In this subsection, we evaluate Hypothesis 2. The network structure of applications that call APIs affects the market value of firms that implement them. Under the inverted firm hypothesis, greater intense external use of a firm’s resources should correspond to more value creation and capture from the API network. APIs that are more frequently integrated into apps should create more value. Firms with APIs that are more central to the API network may be better placed to capture the surplus created by the digital economy.
Our first evidence for this hypothesis is cross-sectional data on the growth rates of API-adopting firms. Figure 7 plots percentage growth in the firm’s market value as a function of the firm’s rank in the number of connections in the API network (i.e., the sum of a firm API’s degrees in Figure 3 as well as by the centrality of their most central API in the most recent API network). The figure restricts attention to the 67 firms that have data available for Q3 2020 and have at least one API, which is connected to another API. There is a significant positive relationship between measures of network importance and market value growth. The effect is large and approximately the same for both network importance measures. The magnitude is such that a 50-percentile increase in firm rank (e.g., from the 25th percentile, at rank 17, to the 75th percentile, at rank 50) is associated with about a 90% increase in market value. Regressions estimating the line of best fit for this figure, as well as a variation that restricts attention to a balanced panel (the 36 firms that exist in both Q1 2007 and Q3 2020, the beginning and end of our sample), are reported in Online Appendix Table A6. Estimates are significantly different than zero for both the balanced and full data sets.
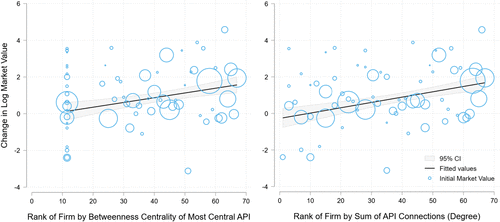
Notes. Marker sizes are proportional to firms’ initial market values. In the left panel, a firm’s network importance is measured by the betweenness centrality of its most central API. There is bunching at rank 11, as there are 11 firms that have APIs that connect to no more than one other API and therefore, are tied for lowest possible betweenness centrality. In the right panel, firm importance is measured by the sum of a firm’s API degrees. Log market value growth is measured from the date the firm first appeared in Compustat. Firm rank is measured for 67 firms as of Q3 2020. Higher rank indicates greater importance. Best-fit regression lines are reported in Online Appendix Table A6 both for the full sample of 67 firms and for a balanced panel of 36 firms in business since Q1 2007.
According to the inverted firm hypothesis, the nature of a firm’s connections is just as important as their abundance. If an API is strategically placed in an information bottleneck, this may benefit the API-creating firm. APIs with high centrality, especially betweenness centrality, play a more important role in connecting the services of firms that would otherwise not be incorporated to the larger internet economy. As Online Appendix Figure A2 shows, API degree and centrality are tightly related. Still, there are APIs that “punch above their weight.” A good example is Coinbase, which has relatively few connections to other APIs (24) but is the 10th most central platform overall because it is the key API connecting many cryptocurrency APIs to online sales and shopping APIs.
A firm’s success in the API network is not directly under its control. Third parties must decide to connect. If decisions to join a platform ecosystem are driven by preferential attachment, then small random advantages or disadvantages will snowball into much larger ones.12 Still, the success of a firm’s APIs is likely somewhat endogenous. To further identify the impact of API placement on market value, we need variation in the API network that affects a firm’s placement within the network that is uncorrelated with relevant omitted variables. Table 3 presents our IV strategy estimates using degraded APIs as shocks to the API network to identify the impact of API network placement on firm market value. Because API discontinuations or degradations are unlikely to be anticipated by those building apps connected to these APIs and even less so to those firms hosting other APIs, these negative connectivity shocks to the API network provide a plausibly exogenous source of variation.13
|
Table 3. 2SLS Results Using Disconnected APIs as an Instrumental Variable for the Effect of the API Network Statistic on Firm Market Value
| (1) | (2) | (3) | (4) | (5) | (6) | (7) | (8) | (9) | |
|---|---|---|---|---|---|---|---|---|---|
| Mean Betweenness Centrality | 0.173 | ||||||||
| (0.541) | |||||||||
| Max Betweenness Centrality | 0.137+ | ||||||||
| (0.0703) | |||||||||
| Sum Betweenness Centrality | 0.125* | ||||||||
| (0.0586) | |||||||||
| Mean Degrees | 0.363 | ||||||||
| (0.361) | |||||||||
| Max Degrees | 0.309+ | ||||||||
| (0.177) | |||||||||
| Sum Degrees | 0.142* | ||||||||
| (0.0576) | |||||||||
| Mean Effective Network Size | −0.0462 | ||||||||
| (0.355) | |||||||||
| Max Effective Network Size | 0.243 | ||||||||
| (0.158) | |||||||||
| Sum Effective Network Size | 0.151* | ||||||||
| (0.071) | |||||||||
| Firm FE | Yes | Yes | Yes | Yes | Yes | Yes | Yes | Yes | Yes |
| Quarter FE | Yes | Yes | Yes | Yes | Yes | Yes | Yes | Yes | Yes |
| Observations | 2,287 | 2,287 | 2,287 | 2,287 | 2,287 | 2,287 | 2,287 | 2,287 | 2,287 |
| Apps connections | 19,893 | 19,893 | 19,893 | 19,893 | 19,893 | 19,893 | 19,893 | 19,893 | 19,893 |
| API firms | 66 | 66 | 66 | 66 | 66 | 66 | 66 | 66 | 66 |
| F-statistic 1st stage | 33.08 | 51.42 | 68.31 | 38.91 | 41.85 | 90.09 | 28.4 | 37.18 | 77.52 |
| Adjusted R2 | 0.365 | 0.370 | 0.371 | 0.369 | 0.377 | 0.370 | 0.364 | 0.375 | 0.371 |
Notes. All explanatory variables are normalized to a mean of zero, with a standard deviation of one. The explanatory variables in columns (1)–(3) are the max, mean, and sum of betweenness centrality. Columns (4)–(6) report mean, max, and sum of degrees in the API network. The explanatory variables in columns (7)–(9) are the mean, max, and sum of a firm API’s effective network size according to Burt (1992). First stage uses changes in a given API network statistic brought about by API shutdown events to instrument for that network statistic. Second stage regresses those predicted network statistics on log market value. FE, fixed effect.
*p < 0.05; +p < 0.10.
We hand collected panel data on disconnections or degradations of the 40 most central APIs in our data (those appearing in Online Appendix Figure A2).14 To conduct our instrumental variable analysis, we calculate the network centrality of APIs in every period both including and not including degraded APIs after their degradation events. Our IV strategy uses the changes in network statistics coming from the degradations to instrument for postdegradation network statistics. The first stage of this IV regression, where disconnections are used to explain network centrality, produces F statistics over 28 for all specifications, well above the threshold suggested by Stock and Yogo (2002).
The two stage least squares (2SLS) coefficients from this regression are presented in Table 3. They show that better placement in the API network significantly and positively affects a firm’s market value. We see positive and significant coefficients on the sum of centrality, the sum of degree, and the sum of effective network size, and we see marginal significance for max centrality and degrees. The size of the coefficients on the sum of centrality, degree, and network size varies from 0.125 to 0.151. Network statistics are centered and scaled, meaning that the coefficients indicate that a one-standard deviation change in the sum of centrality, degree, or network size is estimated to increase firm market value by 12.5%–15.1%. We note that the sum of the network statistics is most significant—and not the mean or max—indicating that for a firm, their combined API presence is more important than having a single important and dominant API. For robustness, we include the ordinary least squares results regressing the network statistics on market value, shown in Online Appendix Table A8, and find results consistent with the 2SLS estimates. Together, the results strongly support Hypothesis 2 using two different sources of plausibly exogenous variation in API centrality.
To further investigate the mechanisms by which inverted firms create value, we relate market value to other measures of third-party API engagement. Specifically, in a two-way fixed effect model, we regress market value on follower count, developer count, and number of API updates in addition to the binary indicator of API adoption. We present the results of this analysis in Online Appendix Table A9. Follower count is a firm-level sum of the number of followers of that firm’s APIs. Following an API allows a ProgrammableWeb user to easily track updates to those APIs, and it is, therefore, a self-reported measure of that user’s interest in that API. Likewise, the number of developers tracks the interest of self-reported developers.15 “Change count” reports the total number of updates the firm has made to all of its APIs. Finally, Online Appendix Table A10 estimates market value based on APIs with zero listed developers, showing low and insignificant coefficients.
Almost all specifications show the intensity of engagement to be significantly correlated with market value growth over and above the extensive margin of API adoption. We estimate that adding 100 additional API developers is associated with a 1.75% additional increase in market value. In a parallel specification, 100 additional API followers are associated with a 0.13% increase in market value. The managerial implications for labor are large. An increase in outside programmer interest, of a magnitude generating one more self-reported developer on ProgrammableWeb, is associated with an average increase in market value of $4.52 million. This implies that managers need methods to recruit and support outside expertise. Hypothesis 2 is supported by this analysis as well.
6.2. Evidence on Internal Productivity
To distinguish between adopting a public versus private API, we draw on our second API usage data set—one from a private API tool provision company. Of the 78 firms that deployed APIs using tools from this company, only 44 are listed as having public APIs available at any point on ProgrammableWeb. Therefore, we can measure the effect of internal APIs by focusing on the effect of API adoption among the remainder. In these data, we measure the date of API adoption as the first date we observe the firm with nonzero data flows through one of their APIs.
Online Appendix Figure A3 reports estimates of the effect, over time, of API adoption on log market value for firms adopting purely internal APIs. The specification used is Equation (2), and as in Figure 5, although all leads and lags are included in the estimation, only estimates for quarters within two years of adoption are displayed.
Using specification (2), Online Appendix Figure A3 shows that there is no clear effect of internal API adoption on firm market value. As an alternative specification, we use generalized synthetic controls. Again, we fail to find evidence of a positive effect of API adoption, as shown in the counterfactual plot in Online Appendix Figure A20 or the synthetic control difference-in-difference estimate in Online Appendix Table A12. This test of Hypothesis 1a shows low confidence in an effect. However, the confidence interval is wide and consistent with a moderate or even large positive effect.
An alternate mechanism by which APIs are said to boost firms internally is through reducing adjustment costs. This would be consistent with increased dynamic capabilities or options value from remixed resources (Teece and Pisano 2003, Baldwin and Clark 2006). If APIs allow firms to more easily integrate new resources or reconfigure old ones, firms should be able to make and capitalize on investments more quickly. This should lead profitable (at the margin) firms to make more investments, boosting their market capitalization. Alternatively, if APIs primarily benefit firms through firm inversion, the firm itself will not need to make major capital investments in order to grow. Third parties would make them. A typical approach to measuring whether a firm’s investment is limited by capital adjustment costs is Tobin’s Q (Tobin 1969), the ratio of market capitalization to assets.
To test which theory best explains the growth in market capitalization for API-using firms, we run a set of regressions analogous to specification (1) with the addition of log of firm assets. Essentially, this means we now estimate the effect of API adoption on Q (log(Q) to be precise). As Table 4 shows, across specifications, API adoption positively predicts market value after controlling for total assets. In the base specification, paralleling Table 1, column (1), the effect of API adoption is roughly cut to a third after controlling for growth in assets. This means that although some of the effect of API adoption on market value is mediated by added asset investments, API adoption still increases Q, consistent with the benefits of API adoption stemming from factors outside the firm.
|
Table 4. Difference-in-Difference Estimate of the Effect of API Adoption, with Firm Asset Controls
| All firms | Excluding top 20 firms with most popular APIs | Excluding industries where <1% of firms have APIs | Excluding any computer services firm | Year API open <2012 | Year API open ≥2012 | |
|---|---|---|---|---|---|---|
| Log of total assets | 0.738*** | 0.738*** | 0.738*** | 0.747*** | 0.736*** | 0.736*** |
| (0.0164) | (0.0166) | (0.0166) | (0.0184) | (0.0167) | (0.0168) | |
| Post × API | 0.135* | 0.133* | 0.123* | 0.156* | 0.305*** | 0.0744 |
| (0.0607) | (0.0623) | (0.0608) | (0.0716) | (0.0912) | (0.0744) | |
| Firm FE | Yes | Yes | Yes | Yes | Yes | Yes |
| Quarter FE | Yes | Yes | Yes | Yes | Yes | Yes |
| R2 adjusted | 0.951 | 0.950 | 0.951 | 0.952 | 0.948 | 0.948 |
| Observations | 132,934 | 132,178 | 127,528 | 118,936 | 129,402 | 129,772 |
| Firms | 4,645 | 4,625 | 4,476 | 4,058 | 4,554 | 4,559 |
| API adopters | 177 | 157 | 176 | 100 | 86 | 91 |
Notes. Standard errors in parentheses are clustered at the firm level. The outcome variable is log Market Value of the firm. Post × API is a binary variable that equals one if a given firm has a public API operating on a given date. FE, fixed effect.
*p < 0.05; ***p < 0.001.
7. API Exposure: Security Challenges and Responses
The usefulness of APIs depends on how well they balance trade-offs. An API is a kind of aperture or membrane that selects which information to diffuse in and out. Too wide an aperture, the firm may give away its data assets. Too narrow or difficult to access, outsiders will struggle to meaningfully engage. As noted, firms that update their APIs more frequently see larger increases in market value (see Online Appendix Table A9), consistent with the ideas that managing details of third-party API use is critical and that benefits accrue over time.
One dominant decision for trafficking in data is how to defend against data breaches. If APIs increased the risk of major loss or liability, their use would pose an important downside risk. There is a trade-off between an interest in enabling third-party innovations and an interest in thwarting third-party damage or ransom. Opening APIs can have both effects. The trade-off depends in part on the relative mix of benevolent and malicious outsiders, which is hidden information. Ransbotham (2016) has shown this “paradox of exposure” to be present in the context of open-source software. This risk is particularly notable given evidence that executives of companies that experience data breaches face negative personal consequences (Kamiya et al. 2021). Even if the ratio of risk to reward is favorable, risk aversion or personal costs to executives may limit investment in API projects.16
Table 5 reports an increased risk of data breach by insiders in the two years postadoption. Relevant for APIs, this may represent stolen or forged credentials for authorized API keys. Data loss based on physical documents or portable computers shows little or no significance.17
|
Table 5. Fixed Effect Logistic (First Six Columns) or Linear Regression (Final Column) of the Impact of API Adoption on Breach Events or Log Total Records Exposed
| Any breach event | Breach of credit card info | Breach via malicious hack | Breach via stolen document or fixed computer | Breach via portable computer | Breach via malicious insider | Log count of records exposed | |
|---|---|---|---|---|---|---|---|
| 0–2 years post-API adoption | 1.086 | 1.482 | 0.854 | 5.526+ | 0.772 | 6.852** | 1.004 |
| [0.28] | [0.33] | [−0.33] | [1.66] | [−0.22] | [2.63] | [−0.06] | |
| Firm FE | Yes | Yes | Yes | Yes | Yes | Yes | Yes |
| Quarter FE | Yes | Yes | Yes | Yes | Yes | Yes | Yes |
| Pseudo-R2 | 0.0887 | 0.332 | 0.181 | 0.355 | 0.205 | 0.253 | |
| Log likelihood | −581.5 | −41.21 | −165.9 | −32.33 | −94.29 | −104.6 | −23,811.1 |
| Observations | 3,878 | 445 | 1,522 | 386 | 1,054 | 987 | 91,946 |
| Event count | 221 | 19 | 63 | 15 | 35 | 44 | 95 |
| R2 adjusted | 0.000151 |
Notes. Breach by Malicious Insider is often misuse of an authorized API key by a malicious unauthorized actor. The t statistics are in parentheses. Exponentiated coefficients are presented. The outcome variable is a binary indicator of whether a specific type of breach event occurred (first six columns) or log of the total amount of records breached (final column). Event count refers to the number of distinct breach events of a given type. The last column is estimated via panel linear regression. FE, fixed effect.
**p < 0.01; +p < 0.10.
To explore how firms respond to data breaches, Online Appendix Figure A24 takes advantage of the fact that we observe data flows in our proprietary API data to see how firms respond to data breach events. These data include all 78 firms that work with the API tool developer, including the 44 that have public APIs. All firms’ APIs, in this data set, were classified by purpose based on their names (see Online Appendix Section B).
Online Appendix Figure A24 shows that firms that report data breaches see a decrease in API flows in the short run that rebounds over time. The API type that sees the largest reduction after a hack is internal communications, perhaps indicating firms’ hesitance to use internal channels after a data breach. On the other hand, the data flows for testing APIs increase dramatically in the months after a data breach is reported. This is consistent with firms taking steps to reduce adverse API exposure in the wake of an unexpected breach.
Substantial differences in API practice separate good firms from bad. Firms that consciously open external APIs are much more careful about security for two reasons: awareness and agency costs.18 Design for external use causes host firms to intentionally harden APIs against attack. Such firms are aware of the risks and mitigate them. By contrast, those firms that implement technology for internal use assume that “security through obscurity” protects them, leading to cost cutting by avoiding security investments. These hidden points of access are less secure but nonetheless, discoverable by those hackers sophisticated enough to look for them. Interestingly, in the two years post-API adoption, breaches by malicious insiders were less likely at firms with more popular APIs.19 A second reason why conscious external implementation dominates casual internal implementation is a partner agency problem. Most firms, whether implementing APIs or not, must coordinate with upstream suppliers and downstream channels. If this coordination is left to upstream and downstream partners without conscious design by the host firm, then the partner often implements backdoor system access for their own needs but does not take the necessary steps to secure access relative to the host needs. Thus, host firms that consciously protect themselves are more secure than those that simply leave it to others. Security is challenging, and even good programmers exhibit blind spots in coding practice (Oliveira et al. 2018). API practices that distinguish successful from unsuccessful firms include (i) rate-limiting data queries and throttling them when rates are exceeded, (ii) time-limiting queries to curb copycat requests, (iii) using well-established standards in preference to custom built, (iv) separating the API access tokens name and password credentials, (v) never storing plaintext credentials, and (vi) two-factor authentication (Lamba 2019). Editors at ProgrammableWeb have observed firms shifting from Larger numbers of unknown developers to smaller numbers of known developers (Berlind 2016). In practice, this strategy may balance the benefits of inverting the firm and securing systems from breach.
8. Conclusion
This paper evaluates the inverted firm business strategy through the lens of a key enabling technology, APIs, that facilitates access to digital resources. This is particularly important for cooperating with developers outside a firm, enabling third parties to build apps and add value using the API-hosting firm’s data and digital services. If the API-hosting firm can capture enough of the value created by these third parties, then the inverted firm strategy succeeds. This paper estimates, for the first time, the quantitative effect of API adoption on market capitalization. By distinguishing internal and external productivity effects, we estimate the effects of new inverted firm versus traditional pipeline strategies.
Using public API data from ProgrammableWeb, we visualize the growth of the digital economy over time. Representing APIs as nodes and the apps calling them as edges, the size of the digital economy grew dramatically from 2005 to 2017. Central APIs play a disproportionate role in anchoring ecosystems within this network. APIs with the highest betweenness centrality and largest effective network size saw tremendous market value growth. The 14 publicly traded firms with APIs in the top 40 by betweenness centrality saw their total market value increase by $6.6 trillion from 2005 to 2021, representing a sizable share of total appreciation in the U.S. equity market over that period.
To confirm the role of APIs in boosting market value, we ran a series of analyses. A difference-in-difference model showed that public API-adopting firms saw their market value increase by 12.9% over two years. An event study analysis, with leads and lags, shows that effect size grows with the length of time since API adoption, rising to 38.7% over 16 years. This is consistent with APIs growing in utility as more complementors add more value. Multiple robustness analyses confirm the positive treatment effect. Subsets removing superstar firms and technology firms, as well as quantile regressions, show that results span firm sizes and industries. The financial implications are economically significant, implying a return on investment on the order of 500 times.
We then investigate to what extent the success of API-adopting firms is because of enabling third-party value creation, the inverted firm hypothesis. We show that firms with greater third-party engagement, as measured by the number of followers and developers, see greater gains in market value. Firms with zero developer-followers had no statistically significant gains. Developer engagement thus provides a useful predictor of market value. These results are important for information systems governance as they imply a need to attract developers and reward third-party investment. Building public APIs on which no one builds is a failure to invert the firm.
Beyond numbers of complementors, network position also matters, a result shown both in pooled two-way fixed effect and in IV panel specifications. IV results are particularly compelling. Degradations of central APIs by one firm are plausibly exogenous to the choices of the many other API-hosting firms that connect to them. Using these degradations as instruments for API network centrality, we find that firm API degree and centrality significantly increase a firm’s market value. Although difference-in-difference results might plausibly be confounded by endogenous firm choices, the fact that changes to the API network impact the value of all firms in that network confirms a causal role for APIs in raising market capitalization.
To further investigate whether gains from APIs come from an inverted firm strategy versus an internal productivity effect, we use proprietary data from an API tool provision company to replicate our analysis for private APIs. We fail to find evidence of a direct market value effect from private APIs. That said, those estimates have large confidence intervals, and they are consistent with a moderate positive effect. We also test the hypothesis that APIs help firms internally by lowering their capital adjustment costs, which would tend to lower their Q. In a specification controlling for a firm’s capital assets, we find that Q rises, and there is still a positive effect of API adoption on firm value. This effect is attenuated, however, indicating that some gains derive from internal capital adjustment even if most gains arise from third-party complementors.
These results show that businesses can benefit from investing in technology that facilitates outside engagement. Strategically, this is important for two reasons. First, shifting to an inverted firm organizational structure can tap open innovation, thereby capturing more profit than a closed firm pipeline structure. Second, results show that placing oneself at the center of an interconnected web of outside partners is more valuable than adding redundant connections. Recapitulating an important insight from social networks, a firm’s centrality and effective network size support its gatekeeping role in the context of APIs.
Finally, we investigate one major downside of API adoption—a greater risk of data breach. Panel fixed effect logistic regressions show an increased risk of breach in the two years after opening public APIs. Combining data on breach events and data from Google Trends suggests that malicious insider breaches are not born of popularity but affect obscure APIs, likely because of poor security. Further, we observe that firms clearly adjust their behavior in the wake of a data breach. Consistent with APIs playing a role in breach events, firms decrease their use of internal communications APIs and increase their API testing in the months after a hack. Does this mean that firms should avoid implementing APIs out of fear of data breach losses? Evidence suggests otherwise. From a purely economic standpoint, the gains in firm market value swamp the losses from data breaches. Moreover, evidence of increased testing after a hack indicates that firms learn to employ better security practices following a hack. To mitigate risk, firms might consider limiting public APIs when outside collaborators add little value or when security concerns are paramount.
Collectively, these results show, quantitatively, that APIs play a critical role in the economy’s growing digital ecosystems. Firms that use APIs to successfully implement an inverted firm strategy place themselves at the center of an ecosystem and capture large returns.
The authors thank the numerous research assistants who contributed to this project, especially Faiz Essa, as well as Yansong Bai, Siddarth Gumireddy, Nikita Jakkam, Carter Vande Moore, Anoushka Sarma, Qingyang “Rose” Shi, Jessie Wang, and Danial Muhammad. The authors also thank Guillermo Lagarda, who contributed to the early development of this research before needing to withdraw from the project, and their colleague and advisor Daniel Rock.
1 The value of U.S. corporate intangible assets increased from near zero in the early 1990s to more than $6.6 trillion in 2016 (Benzell and Brynjolfsson 2019)—calculated as U.S. corporate equity and liabilities less financial assets from Federal Reserve series Z.1 and less fixed capital from Bureau of Labor Statistics table 4.1.
2 The seven firms are Apple (1), Microsoft (2), Amazon (3), Alphabet (4), Meta (5), Tencent (6), and Alibaba (8) (source: Wikipedia; accessed January 19, 2021).
3 This insight is codified as Joy’s Law, which states that “no matter who you are, most of the smartest people work for someone else” (Lakhani and Panetta 2007, p. 97).
4 It is not clear when the first API was created, but they clearly predate the internet. Google’s n-gram tool lists usage of the phrase “application programming interface” as early as 1961.
5 Amazon.com Launches Web Services (July 16, 2002)—Amazon Press Release https://press.aboutamazon.com/2002/7/amazon-com-launches-web-services-developers-can-now-incorporate-amazon-com-content-and-features-into-their-own-web-sites-extends-welcome-mat-for-developers.
6 We have matched many of these nonpublic firms to Crunchbase information on start-ups. This is an intriguing database for future research on the financial impact of APIs and strategic entrepreneurship.
7 Data from Rosati and Lynn (2021) end in 2015, so our main results focus on this period. Online Appendix Figure A24 restricts attention to the 78 firms for which we have flow data, extending the PRC data through 2016. However, this only increases the number of data breaches observed by four.
8 See World Bank (2022). According to an alternate source, the total U.S. equity market increased by 30 trillion in value from 2005 to 2021. See Siblis Research (2022).
9 This was based on private communication with the API consulting firm and independently confirmed for a different vendor (how much does Mulesoft cost?).
10 To confirm that delayed submission to ProgrammableWeb is a possible source of the pretrend, we hand collected data on ProgrammableWeb submission dates, online article reference dates, and official release dates of the top 40 APIs by betweenness centrality (those listed in Online Appendix Figure A2). For the 22 APIs where an official launch date could be explicitly determined, the median delay between API launch and ProgrammableWeb submission was 0 months, and the average delay was 5.7 months. For an additional 10 APIs, we could not find an official launch date, and we also could find no evidence of the API being mentioned by a source before the ProgrammableWeb submission date. We conclude that although the ProgrammableWeb data set is the best and most complete one available, occasional lags in ProgrammableWeb submission after API launch likely generate the ex ante effect seen in the event study. Further, if we shift the treatment indicator one or two quarters forward, the coefficient for our estimated baseline declines from 0.387 in Table 1 to 0.381 and 0.378, respectively, yet remains statistically significant.
11 It is important to note that differences in the market value of API-adopting and nonadopting firms do not bias our estimates. By including firm fixed effects, we control for nontime-varying latent factors that might drive both market value and API adoption. These firm fixed effects make our regression analysis a type of difference-in-difference analysis, which does not identify off of the level of the outcome variable (Roth et al. 2023).
12 Preferential attachment might also explain why the variance in some estimates is imprecise. Preferential attachment leads to power-law distributions in the tail, which can have large or even infinite variance (Newman 2005).
13 Compare with the identification strategy of Benzell and Cooke (2021), which identifies the effect of family ties by instrumenting using the deaths of individuals important to the marriage network.
14 Of the 40 APIs, 5 had significant reductions in features, 2 were discontinued and replaced with similar APIs, and 1 was entirely discontinued. The del.icio.us API was discontinued (Q2 2017); Google Visualization and Google Chart APIs were replaced with substitutes (both Q1 2019). The five APIs with significant reductions in functionality over our period were Twitter (Q2 2018), Facebook (Q2 2018)), Last.fm (Q2 2014), Google Gadgets (Q4 2013), and LinkedIn (Q2 2015).
15 It is not uncommon for ProgrammableWeb users to be both followers and developers of the same API.
16 Other hypothetical instances of data “overexposure,” such as intentionally giving away data that later turn out to be key to a firm’s competitive advantage, are also possible but beyond the scope of the current paper.
17 Online Appendix Table A11 controls for the time-varying popularity of firms’ APIs using a time-varying Google Trends score for each of the firm’s APIs in the logistic panel regression. Surprisingly, this increases the estimated effect of API adoption on malicious insider breach events, which we estimate at almost nine times more likely controlling for API popularity.
18 This information came from a conversation with the CTO of Mulesoft, one of the largest API providers (July 21, 2022).
19 See Online Appendix Table A11, column (5), 90% confidence.
References
- (2011) The diversity bandwidth trade-off. Amer. J. Sociol. 117(1):90–171.Crossref, Google Scholar
- (1990) Market networks and corporate behavior. Amer. J. Sociol. 96(3):589–625.Crossref, Google Scholar
- (2000) Design Rules: The Power of Modularity, vol. 1 (MIT Press, Cambridge, MA).Crossref, Google Scholar
- (2006) The architecture of participation: Does code architecture mitigate free riding in the open source development model? Management Sci. 52(7):1116–1127.Link, Google Scholar
- (2019) Your technology investments may not deliver the productivity gains you expected. Accessed October 30, 2023, https://www.forrester.com/blogs/your-technology-investments-may-not-deliver-the-productivity-gains-you-expected/.Google Scholar
- (2019) Digital abundance and scarce genius: Implications for wages, interest rates, and growth. NBER Working Paper No. 25585, National Bureau of Economic Research, Cambridge, MA.Google Scholar
- (2021) A network of thrones: Kinship and conflict in Europe, 1495–1918. Amer. Econom. J. Appl. Econom. 13(3):102–133.Crossref, Google Scholar
- (2015) The naked truth about internet security. Accessed July 30, 2021, https://en.wikipedia.org/wiki/ProgrammableWeb.Google Scholar
- (2016) Do you publish API docs online for availability to third party developers? Accessed July 30, 2021, https://en.wikipedia.org/wiki/ProgrammableWeb.Google Scholar
- (2017) New snafus illustrate scope of API security challenge and hacker tenacity. Accessed July 30, 2021, https://en.wikipedia.org/wiki/ProgrammableWeb.Google Scholar
- (2005) Centrality and network flow. Soc. Networks 27(1):55–71.Crossref, Google Scholar
- (2010) Open platform strategies and innovation: Granting access versus devolving control. Management Sci. 56(10):1849–1872.Link, Google Scholar
- (2021) Working Backward: Insights, Stories, and Secrets from Inside Amazon (Pan Macmillan, London).Google Scholar
- (2000) Beyond computation: Information technology, organizational transformation and business performance. J. Econom. Perspect. 14(4):23–48.Crossref, Google Scholar
- (2002) Intangible assets: Computers and organizational capital. Brookings Papers Econom. Activity 2002(1):137–181.Crossref, Google Scholar
- (2018) The productivity J-curve: How intangibles complement general purpose technologies. NBER Working Paper No. 25148, National Bureau of Economic Research, Cambridge, MA.Google Scholar
- (1992) Structural Holes (Harvard University Press, Cambridge, MA).Crossref, Google Scholar
- (2009) Structural Holes: The Social Structure of Competition (Harvard University Press, Cambridge, MA).Google Scholar
- (2021) The EU Digital Markets Act: A Report from a Panel of Economic Experts. The EU Digital Markets Act (Publications Office of the European Union, Luxembourg City, Luxembourg).Google Scholar
- (2015) Permissionless innovation. Comm. ACM 58(8):24–26.Crossref, Google Scholar
- (2020) The future of platforms. MIT Sloan Management Rev. (February 11), https://sloanreview.mit.edu/article/the-future-of-platforms/.Google Scholar
- (2005) Graph Theory, 3rd ed. Graduate Texts in Mathematics (Springer, Berlin).Google Scholar
Dignan L (2021) Microsoft power apps misconfiguration exposes 38 million data records. ZDNet (August 23), https://www.zdnet.com/article/microsoft-power-apps-misconfiguration-exposes-38-million-data-records/ .Google Scholar- (2000) Dynamic capabilities: What are they? Strategic Management J. 21(10–11):1105–1121.Crossref, Google Scholar
- (2009) Open R&D and open innovation: Exploring the phenomenon. Res. Management 39(4):311–316.Google Scholar
- (2020) Exclusive with AWS chief Andy Jassy: The wakeup call for cloud adoption. Silicon Angle (November 30), https://siliconangle.com/2020/11/30/exclusive-aws-chief-andy-jassy-wakeup-call-cloud-adoption/.Google Scholar
- (2019) Post-Equifax: Why API security should be a priority.Google Scholar
- (1973) The strength of weak ties. Amer. J. Sociol. 78(6):1360–1380.Crossref, Google Scholar
- (1999) The search-transfer problem: The role of weak ties in sharing knowledge across organization subunits. Admin. Sci. Quart. 44(1):82–111.Crossref, Google Scholar
- (1978)
The private and social value of information and the reward to inventive activity . Diamond P, Rothschild M, eds. Uncertainty in Economics: Readings and Economics (Elsevier, Amsterdam), 541–556.Crossref, Google Scholar - (2010) Preparing for the future: Understanding the seven capabilities of cloud computing. MIS Quart. Executive 9(2):117–131.Google Scholar
- (2015) The strategic value of APIs. Harvard Bus. Rev., https://hbr.org/2015/01/the-strategic-value-of-apis.Google Scholar
- (2018) Towards a theory of ecosystems. Strategic Management J. 39(8):2255–2276.Crossref, Google Scholar
- (2011) APIs: A Strategy Guide (O’Reilly Media, Inc., Sebastopol, CA).Google Scholar
- (2016) Plugging in: Enabling the enterprise for the platform economy. Technical report, Gartner Research Board, Stamford, CT.Google Scholar
- (2021) Risk management, firm reputation, and the impact of successful cyberattacks on target firms. J. Financial Econom. 139(3):719–749.Google Scholar
- (2017) Amazon’s antitrust paradox. Yale Law J. 126(3):710–805.Google Scholar
- (2007) The principles of distributed innovation. Innovations Tech. Governance Globalization 2(3):97–112.Crossref, Google Scholar
- (2019) API design principles & security best practices. Cybernomics 1(3):21–25.Google Scholar
- (2020) Equifax expects to pay out another $100 million for data breach. Housing Wire (February 14), https://www.housingwire.com/articles/equifax-expects-to-pay-out-another-100-million-for-data-breach/.Google Scholar
- (2018) Measuring the economic effects of data breaches on firm outcomes: Challenges and opportunities. J. Econom. Soc. Meas. 43(1–2):59–83.Google Scholar
- (1987) Electronic markets and electronic hierarchies. Comm. ACM 30(6):484–498.Crossref, Google Scholar
- (1938) Statistics of social configurations. Sociometry 1(3):342–374.Crossref, Google Scholar
- (2018) Google+ exposed data of 52.5 million users and will shut down. Wired (December 10), https://www.wired.com/story/google-plus-bug-52-million-users-data-exposed/.Google Scholar
- (2005) Power laws, Pareto distributions and Zipf’s law. Contemporary Physics 46(5):323–351.Crossref, Google Scholar
Nordic APIs (2021) The Bezos API mandate: Amazon’s manifesto for externalization. Accessed November 28, 2023, https://nordicapis.com/the-bezos-api-mandate-amazons-manifesto-for-externalization/ .Google Scholar- (2019) Application programming interface (API) research: A review of the past to inform the future. Internat. J. Enterprise Inform. Systems 15(3):76–95.Crossref, Google Scholar
- (2018) API blindspots: Why experienced developers write vulnerable code. Fourteenth Sympos. Usable Privacy and Security (SOUPS) (USENIX Association, Berkeley, CA), 315–328.Google Scholar
- (2009) What Is Web 2.0 (O’Reilly Media, Inc., Sebastopol, CA).Google Scholar
- (2018) Innovation, openness, and platform control. Management Sci. 64(7):3015–3032.Link, Google Scholar
- (2017) Platform ecosystems: How developers invert the firm. MIS Quart. 41(1):255–266.Crossref, Google Scholar
- (2016) Platform Revolution: How Networked Markets Are Transforming the Economy and How to Make Them Work for You (WW Norton & Company, New York).Google Scholar
- (2001) Networks as the pipes and prisms of the market. Amer. J. Sociol. 107(1):33–60.Crossref, Google Scholar
- (2001)
The value chain and competitive advantage . Barnes D, ed. Understanding Business Processes (Psychology Press, New York), 50–66.Google Scholar - (2008) The five competitive forces that shape strategy. Harvard Bus. Rev. 86(1):25–40.Google Scholar
- (2001) The assimilation of knowledge platforms in organizations: An empirical investigation. Organ. Sci. 12(2):117–135.Link, Google Scholar
- (2016) Open source code and the risk of attacks after vulnerability discovery. Open and User Innovation Conference. Accessed November 6, 2023, https://programme.exordo.com/oui2016/delegates/presentation/140/.Google Scholar
- (2001) Networks, diversity, and productivity: The social capital of corporate R&D teams. Organ. Sci. 12(4):502–517.Link, Google Scholar
- (2021) A dataset for accounting, finance and economics research on US data breaches. Data Brief 35:106924.Crossref, Google Scholar
- (2022) Pretest with caution: Event-study estimates after testing for parallel trends. Amer. Econom. Rev. 4(3):305–322.Google Scholar
- (2023) What’s trending in difference-in-differences? A synthesis of the recent econometrics literature. J. Econometrics 235(2):2218–2244.Google Scholar
- (2017) How my car insurance exposed my position. Accessed November 28, 2023, https://scarpino.dev/posts/how-my-car-insurance-exposed-my-position.html.Google Scholar
- (2019) If you want to know what a US tech crackdown may look like, check out what Europe did. CNBC (June 7), https://www.cnbc.com/2019/06/07/how-google-facebook-amazon-and-apple-faced-eu-tech-antitrust-rules.html.Google Scholar
Siblis Research (2022) Total market value of U.S. stock market. Accessed November 6, 2023, https://siblisresearch.com/data/us-stock-market-value/.Google Scholar- (1922) Conflict and the Web of Group Affiliations (New York Free Press, New York).Google Scholar
- (2016) The impact of information security events to the stock market: A systematic literature review. Comput. Security 58:216–229.Crossref, Google Scholar
- (2018) T-Mobile alerts 2.3 million customers of data breach tied to leaky API. ThreatPost (August 24), https://threatpost.com/t-mobile-alerts-2-3-million-customers-of-data-breach-tied-to-leaky-api/136896/.Google Scholar
- (2002) Testing for weak instruments in linear IV regression. NBER Working Paper No. 0284, National Bureau of Economic Research, Cambridge, MA.Google Scholar
- (1998) The impact of information technology investments on firm performance and evaluation: Evidence from newly industrialized economies. Inform. Systems Res. 9(1):85–98.Link, Google Scholar
- (2003)
The dynamic capabilities of firms . Holsapple CW, eds. Handbook on Knowledge Management, International Handbooks on Information Systems, vol. 2 (Springer, Berlin), 195–213.Crossref, Google Scholar - (1988) Capturing value from technological innovation: Integration, strategic partnering, and licensing decisions. Interfaces 18(3):46–61.Link, Google Scholar
- (2016) Permissionless Innovation: The Continuing Case for Comprehensive Technological Freedom (Mercatus Center at George Mason University, Fairfax, VA).Google Scholar
- (2010) Research commentary-Platform evolution: Coevolution of platform architecture, governance, and environmental dynamics. Inform. Systems Res. 21(4):675–687.Link, Google Scholar
- (1969) A general equilibrium approach to monetary theory. J. Money Credit Banking 1(1):15–29.Crossref, Google Scholar
- (1997) Social structure and competition in interfirm networks: The paradox of embeddedness. Admin. Sci. Quart. 42(2):35–67.Crossref, Google Scholar
- (2016) Pipelines, platforms, and the new rules of strategy. Harvard Bus. Rev. 94(4):54–62.Google Scholar
- (1986) Lead users: A source of novel product concepts. Management Sci. 32(7):791–805.Link, Google Scholar
- (1989) New product ideas from ‘lead users.’ Res. Tech. Management 32(3):24–27.Crossref, Google Scholar
- (1998) Recombinant growth. Quart. J. Econom. 113(2):331–360.Crossref, Google Scholar
- (1984) A resource-based view of the firm. Strategic Management J. 5(2):171–180.Crossref, Google Scholar
- (1994) Betweenness centrality measures for directed graphs. Soc. Networks 16(4):335–346.Crossref, Google Scholar
World Bank (2022) Market capitalization of listed domestic companies (current US$)—United States. Working paper, World Bank, Washington, DC.Google Scholar- (2017) Generalized synthetic control method: Causal inference with interactive fixed effects models. Political Anal. 25(1):57–76.Crossref, Google Scholar
- (2012) Organizing for innovation in the digitized world. Organ. Sci. 23(15):1398–1408.Link, Google Scholar
- (2017) The API economy and digital transformation in financial services: The case of open banking. Technical Report No. 2016-001, SWIFT Institute, La Hulpe, Belgium.Google Scholar
- (2018) Competing with complementors: An empirical look at Amazon.com. Strategic Management J. 39(10):2618–2642.Crossref, Google Scholar

