
Next Lives Here: Forging Academia–Industry Partnerships in Analytics at the University of Cincinnati
Abstract
In 2018, the Department of Operations, Business Analytics, and Information Systems (OBAIS) in the Carl H. Lindner College of Business at the University of Cincinnati (UC) celebrated its 50th anniversary, and in 2019 the OBAIS department won the INFORMS UPS George D. Smith Prize. The OBAIS department has a long history of excellence in fostering academia-industry collaboration in the area of analytics as well as a track record of continued innovation. In this article, we summarize some of the history of the OBAIS department and describe many of the department’s innovations that enabled the department to win the 2019 Smith Prize. We provide an overview of the department’s curriculum of analytics-focused degree programs, and we explain how the UC Center for Business Analytics serves as the culmination of the department’s efforts to provide a supportive ecosystem in analytics for students, faculty, business leaders, and practitioners. We conclude with some lessons learned along our journey.
Introduction
In 2018, the Department of Operations, Business Analytics, and Information Systems (OBAIS) in the Carl H. Lindner College of Business at the University of Cincinnati (UC) celebrated our 50th anniversary, and we are grateful and proud to have received the prestigious 2019 INFORMS UPS George D. Smith Prize in recognition of the outstanding record of working cooperatively with industry to develop students and to solve real-world problems. The OBAIS department has a long history of excellence in fostering academia-industry collaboration in the area of analytics as well as a track record of continued innovation.
As UC is the birthplace of cooperative education, the OBAIS department upholds the commitment to giving its students immersive, experiential learning opportunities by partnering with a broad range of industries to solve relevant business problems using data and analytics, together with disciplined project management and faculty guidance. The experiential-education opportunities include student internships, required capstones, and client-facing analytics projects supported by the UC Center for Business Analytics.
OBAIS department faculty also have a long and rich history of innovation in the teaching of analytics. Departmental faculty have authored leading textbooks that are used at more than 400 different colleges and universities around the world. Two departmental faculty members have been awarded the INFORMS Award for Teaching OR/MS Practice, and the Center for Business Analytics has provided continuing education classes to hundreds of analytics professionals.
In this article, we summarize some of the history of the OBAIS department and describe many of the department’s innovations that enabled us to win the 2019 INFORMS UPS George D. Smith Prize. We begin by giving overviews of UC, the Lindner College of Business, and the OBAIS department. We discuss efforts over the 50-plus-year history of the department to bridge the gap between practice and academia in research and teaching. We provide an overview of the curriculum of analytics-focused degree programs in the OBAIS department, and we explain how the Center for Business Analytics serves as the culmination of the department’s efforts to provide a supportive ecosystem in analytics for students, faculty, business leaders, and practitioners. We conclude with some lessons learned along our journey.
About the University of Cincinnati and the Lindner College of Business
The University of Cincinnati was founded in 1819 when both Cincinnati College and the Medical College of Ohio were chartered. In 1870, the City of Cincinnati established the University of Cincinnati, which later incorporated both Cincinnati College and the Medical College of Ohio. In 1968, UC became a “municipally sponsored, state affiliated” institution (https://www.uc.edu/about/factsheet.html); in 1977, UC became part of the Ohio system of public universities. Today, the University of Cincinnati is classified as a Doctoral University: Very High Research Activity by the Carnegie Commission and is ranked among America’s top 25 public research universities by the National Science Foundation. Enrollment for the 2019–2020 academic year exceeded 46,000 students, the seventh year in a row in which UC has set a record for number of students enrolled (Suro 2019).
The University of Cincinnati strives to offer students a balance of educational excellence and real-world experience. In 1906, the University of Cincinnati created the first cooperative-education program in the world. For over 100 years, UC has provided students the opportunity to alternate full-time terms of school and work to provide students with a solid base of experience and professional development. UC is currently undertaking an ambitious new strategic plan known as “Next Lives Here” that fosters even closer interactions among the university and community partners, including local companies, around priorities that align directly with the efforts of the Lindner College of Business and OBAIS department.
The College of Business was founded in 1906 as the Cincinnati College of Finance, Commerce, and Accounts. In 1912, the college became part of the University of Cincinnati. In 1946, the college was rebranded as the College of Business and offered its own baccalaureate degree. The college began offering a master of business administration (MBA) degree in 1958, a PhD degree in 1966, and master of science (MS) degrees in 1978, including the MS in quantitative analysis degree, which was the precursor to the currently existing MS in business analytics degree.
In keeping with the philosophy of the university that created co-op education, the Carl H. Lindner College of Business believes in a mission of integrating real industry experience with classroom learning. The goal of the college is to deliver exceptional education to students and to provide value-added services to the business community. As part of this philosophy, all graduate students must complete a degree capstone that can be satisfied through a paid internship with a company or a faculty-supervised project.
The college currently enrolls more than 4,000 undergraduate students and more than 1,100 graduate students and currently employs 117 full-time faculty. Unique opportunities that build professional experience, cultural competency, and leadership skills through cooperative education, internships, field-study research, and cross-disciplinary studies are provided to all students.
Operations, Business Analytics, and Information Systems Department
The OBAIS department has a long and rich history in the College of Business at the University of Cincinnati. It was created in 1968 as the Department of Quantitative Analysis and has existed continuously since then under a variety of names and configurations, including Quantitative Analysis, Quantitative Analysis and Information Systems, Quantitative Analysis and Operations Management, and Operations and Business Analytics.
The OBAIS department currently includes 27 full-time faculty and more than 30 part-time faculty. The full-time faculty are well known for their contributions to research and teaching with a focus on real-world applications of operations research (OR) and analytics. UC’s location in Cincinnati, Ohio, also allows the department to employ exceptional part-time faculty who are leaders in the practice of analytics at companies such as Procter & Gamble, Teradata, US Bank, Kroger, 84.51°, Macy’s, and others.
The Master of Science in Business Analytics program is consistently ranked among the top graduate programs, including a number-one ranking of MS data science programs by Predictive Analytics Today and a number-seven ranking of U.S. master of business analytics programs by QS World University rankings.
Faculty Familiarity and Competence in Analytics Practice
As highlighted in the 2008 OR/MS Today cover story (Horner 2008), OBAIS department faculty have always had a strong belief in the importance of connecting their academic research and their teaching to relevant industry problems. The first author summarized this belief as a “Woolsyian” mindset (Camm 2007), referring to the importance of bringing practical problems into academia—a nod to the legacy of Gene Woolsey, who constantly preached about the importance of practically relevant education and research.
Below, we highlight some major industry-partnered collaborative efforts between OBAIS faculty and external organizations. One of the earliest such collaborations was undertaken by OBAIS department Professor Emeritus Dennis Sweeney in 1978 when Dennis chose to spend his sabbatical not at another university, but by working at Procter & Gamble (P&G). As Dennis described it many years later, he wanted to “get out of the ivory tower” (Sweeney 2019). Dennis began collaborating with Mike Doherty at P&G on developing new solution procedures for integer programs. P&G had many such problems that they needed to solve, and Dennis provided the expertise on the newest solution methods at the time. This collaboration between UC and P&G produced multiple research papers, including Martin et al. (1985), and also led to Mike Doherty serving as an adjunct faculty member at UC for nine years. The partnership between UC and P&G in analytics has continued for decades. This partnership produced the Edelman-finalist project of restructuring P&G’s North American supply chain that led to more than $250 million in verified savings per year in 1993 (Camm et al. 1997). The OBAIS department’s partnership with P&G continues to this day, as P&G was one of the founding members of the Center for Business Analytics. More recently, OBAIS faculty members have spent at least portions of their sabbaticals in industry working with such organizations as Cincinnati Children’s Hospital Medical Center and TechSolve, a Cincinnati-based company that specializes in helping manufacturing companies use emerging technologies.
Practice-oriented research has been a hallmark of the OBAIS department throughout its history. Research conducted by departmental faculty has been instrumental in a variety of fields of application and has often been recognized for its impact—including as Edelman finalists (Camm et al. 1997), INFORMS Wagner Prize finalists (Fry and Ohlmann 2009), and INFORMS Innovative Applications in Analytics Award finalists (Georgiades et al. 2018). Much of the OBAIS department’s work with industry partners is currently handled by the Center for Business Analytics, which we will discuss in much more detail later.
Impact on Analytics Education
UC’s OBAIS department faculty have also been instrumental in shaping the field of analytics education for many decades. Departmental faculty member E. Leonard Arnoff coauthored the seminal text Introduction to Operations Research in 1959 (Churchman et al. 1959). Len Arnoff later served as dean of the University of Cincinnati College of Business Administration and helped shape the department to focus on the practical application of operations research. Dave Anderson, Dennis Sweeney, and Tom Williams produced many best-selling textbooks for business statistics and management science over the years. Their textbook An Introduction to Management Science (Anderson et al. 2019) is currently on its 15th edition, and they have been joined by additional coauthors, including OBAIS department faculty members Jeff Camm and Mike Fry. OBAIS department Professor Emeritus Jim Evans has authored leading textbooks in quality management (Evans and Lindsay 2016) and a host of other subjects. Professor Emeritus David Kelton has written numerous books on discrete-event simulation, including Law and Kelton (2000), which, according to Google Scholar, has more than 19,000 citations. Most recently, two of the first textbooks dedicated to business analytics were written by OBAIS faculty and are both now in their third editions: Camm et al. (2018) and Evans (2019). A recent study found that textbooks authored by OBAIS department faculty are in use at more than 400 colleges and universities around the world. Textbook authorship allows OBAIS faculty to translate many of their experiences in working with industry partners to students through the examples, problems, and cases used in their textbooks. These textbooks also often serve as the first introduction to a much wider community of the OR and analytics work being done at the University of Cincinnati.
Departmental faculty have always seen the importance of bringing analytics education to as many students and professionals as possible, and this effort continues today. We also note that two OBAIS faculty have received the INFORMS Award for Teaching OR/MS Practice: Professor Emeritus Jeff Camm and Associate Professor Emeritus Dave Rogers. OBAIS department faculty have also been strong supporters of the analytics-professional community. Three OBAIS faculty have been named INFORMS Fellows (Professor Emeritus Jeff Camm, Professor Emeritus Mike Magazine, and Professor Emeritus David Kelton). Mike Magazine and David Kelton have also been named Institute for Industrial Engineers fellows, and Professor Yan Yu is an American Statistical Association fellow. Al Simone served as the first head of the precursor to the OBAIS department in 1968; Al also served as the inaugural editor of the journal Decision Sciences in 1970–1971. Jeff Camm served as the editor-in-chief of Interfaces, and David Kelton served as the editor-in-chief of INFORMS Journal on Computing. Numerous OBAIS faculty currently serve as associate editors at top journals, including INFORMS Journal on Applied Analytics, Production and Operations Management, Journal of the American Statistical Association, Statistica Sinica, Journal of the Association of Information Systems, and many others.
Degree Programs
The OBAIS department is currently home to faculty and students studying operations management, business analytics, and information systems. In addition to supporting core coursework in these areas for all College of Business students, the department offers majors at both the undergraduate and graduate levels:
BBA-IS: bachelor of science in information systems
BBA-OM: bachelor of business administration in operations management
BS-IM: bachelor of science in industrial management
BS-BANA: bachelor of science in business analytics
MS-BA: master of science in business analytics (formerly master of science in quantitative analysis, or MSQA)
MS-IS: master of science in information systems
PhD: doctor of philosophy in business, concentration in operations, business analytics, and/or information systems
Graduate certificate in operations excellence
Graduate certificate in data analytics
Graduate certificate in data science (jointly offered with College of Engineering and Applied Sciences).
The OBAIS department is currently the largest department in the Lindner College of Business in terms of full-time faculty, number of sections of courses offered, and number of graduate students. Below, we briefly summarize a few of the degree programs offered by the department. Additional details, including specific degree requirements, can be found on the OBAIS department website: https://business.uc.edu/faculty-and-research/departments/obais.html.
Master of Science in Business Analytics
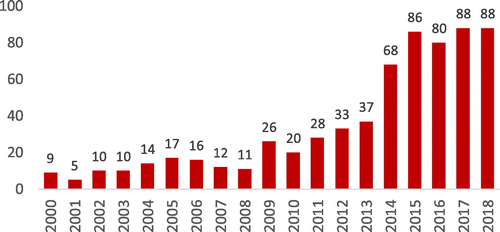
The master of science in business analytics degree is one of the oldest such degree programs in existence. The program was rebranded as “Business Analytics” in 2011, but the genesis of the degree dates back more than 40 years when the program was known as the MS-quantitative analysis degree. Throughout its history, this degree has combined operations research and statistics, using applied mathematics and computer applications in a business environment. Figure 1 shows the rapid growth in this program since 2000. The MS-business analytics degree is currently preparing 126 students (as of fall 2019, includes full-time and part-time students) to succeed in this rapidly growing career field. Graduates of this degree program have enjoyed high starting salaries and over 95% placement within three months of graduation. The average starting salary for 2018 graduates from this program was the highest average starting salary of any master’s degree program in the Lindner College of Business.
Graduates from this program have pursued careers as data scientists, business analysts, business intelligence engineers, analytics science consultants, market and consumer analysts, operations research analysts, and financial, risk, or recovery analysts in a wide variety of industries. Graduates have accepted positions at Google, Procter & Gamble, Disney, Yahoo!, Morgan Stanley, Amazon, PayPal, McKinsey & Company, eBay, US Bank, and other leading companies.
One of the key differentiators for UC’s MS-business analytics degree is that all entering students must have significant technical training prior to entering the program. The program prerequisites include calculus through multivariate calculus, either differential equations or linear programming, and some knowledge of a programming language. The net effect of these prerequisites is that virtually all entering students already have an undergraduate degree in a technical field, such as engineering, math/statistics, or computer science. This allows our program to focus on the specialized skills required to be successful as an analytics practitioner.
The coursework for the MS-business analytics degree is similar to many such programs in that it includes required classes in applied statistical modeling, applied linear regression, data management, data mining, statistical computing, optimization, and simulation. But it also includes required courses in fundamental concepts, such as an in-depth coverage of probability. This ensures that students also have a depth of knowledge to not only use the tools required to apply analytics but also understand the theory behind the tools they will be using. Students also receive training in data visualization and big data integration. Electives include forecasting, multivariate statistics, data wrangling, and additional training in such programming languages as Python.
One challenge for any such business analytics curriculum is staying current in a field that is constantly evolving and changing. Recent changes to the curriculum include the following: new required classes in data management as well as updating elective courses that cover topics in big data; additional classes on data wrangling; classes that introduce new programming languages; and classes that teach soft skills, such as storytelling with data and problem formulation methods. The constant updating of the curriculum has been facilitated by frequent offerings of “Special Topics” classes where new courses can be quickly tested for student and employer feedback before formal adoption as new courses in the curriculum. The OBAIS department also tries to stick to a philosophy that each course should cover a methodology, or a set of practical applications, rather than just “how to use a software tool.” This is driven by the belief that software tools will continue to change constantly, but if students understand the underlying methods and possible applications, then they should be able to learn new tools as required.
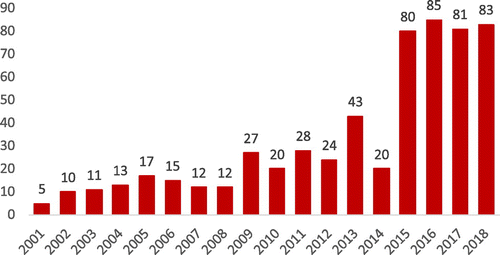
A key component of our MS-business analytics degree program is the graduate capstone requirement. All MS-business analytics students must satisfy a graduate capstone requirement to complete their degree. Students can satisfy this capstone requirement through either a paid internship with a company of at least three months in duration or a project that is supervised by two faculty members. Even for those students who choose to do the project, many of the projects are done in conjunction with an industry partner, so that students receive the invaluable experience of dealing with ill-defined problems and messy data. Figure 2 shows the number of industry-focused capstone projects that have been completed by MS-business analytics students since 2001—a total that surpasses 500 such projects since 2001.
Bachelor of Science in Business Analytics
The bachelor of science in business analytics degree was started in fall 2017 in response to demand from students and employers. The process of creating the degree started by soliciting input from our corporate partners who hire our students and who support our department. This helped the faculty identify the skills that are most in demand and would be most relevant to students.
Learnings from this input indicated that students should have a functional expertise (e.g., finance, marketing, operations, etc.) to pair with their analytics knowledge and that students in this program should have higher math skills than a typical business student. Therefore, we created this program as a separate degree—a bachelor of science degree—rather than as another major within the existing bachelor of business administration degree. The bachelor of science in business analytics degree has more, and higher-level, math requirements than other bachelor of business administration degrees in finance, accounting, operations, marketing, and information systems. The required credit hours are kept to a minimum to allow students to use free electives to earn either a second degree in a functional area or multiple minors or to begin graduate-level coursework from our master of science in business analytics degree program for those that want additional technical depth.
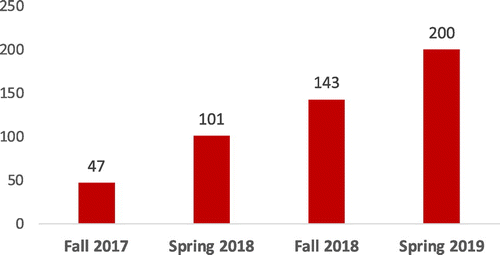
The response to this new degree has exceeded all expectations. Even with the more rigorous math requirements, student demand for the degree has been very high. As Figure 3 indicates, the degree program has grown to 200 students in less than two years of existence. We also have preliminary evidence that the degree program is drawing exceptionally bright students to our college, students who would not have previously considered the Lindner College of Business at the University of Cincinnati.
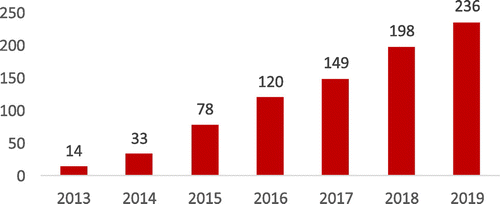
The undergraduate BS-business analytics degree is complemented by an undergraduate business analytics minor program. The minor does not require the higher math prerequisites that are required by the BS-business analytics degree and includes a subset of courses that are accessible for students of many different backgrounds. As shown in Figure 4, growth in the number of students choosing the business analytics minor since its inception in 2013 has been strong. The minor is currently the most popular minor chosen by undergraduate business students, and it has also proved to be a popular minor for nonbusiness students.
Regardless of program, what has always defined the OBAIS student experience is the relentless focus on real problems and being connected to industry. Those real problems are often brought into the classroom and tackled directly by the students. Although a practicum project has become somewhat commonplace in analytics programs today, this was not always the case. Solving real problems, by faculty and students, has been the OBAIS department’s focus from its origin. It is part of the DNA of the department. The impact on the students is perhaps best summarized by this comment from an OBAIS alumnus, a quote from a teaching award nomination:
(The professor) framed our projects by reviewing the theory involved. He then would introduce a specific real-world project he was actually working on solving. He provided the vast amount of real-world data required to solve the problem, and then we were challenged to return with a solution. I cannot emphasize enough how important it was to use actual consulting projects and not simply case studies. The real world does not conform to normal distributions and oftentimes has missing or invalid data. Many professors fail to teach this extremely important concept, probably due to the lack of their own real-world problem solving.
—Chris Lynd, MSQA 1997
This focus on industry was further codified in 2012 with the founding of the UC Center for Business Analytics. As described next, the center is a catalyst for scaling up the number of experiential opportunities for our students.
The Center for Business Analytics
The Center for Business Analytics was established in 2012 as a connection between the Lindner College’s OBAIS department and the business community, with specific emphasis on the application of business analytics. The center has four main directives in its mission: (1) host world-class events to disseminate best-in-class analytics practices; (2) provide effective training to analytics professionals; (3) create opportunities for students and faculty to work directly with analytics practitioners to advance applied research and provide experiential education; (4) foster interactions between different analytics professionals to support the entire analytics community.
The center began with 10 founding companies and today serves the needs of 28 member organizations (see Figure 5). We cater to both large and small companies, for-profit and nonprofit, and not just within the greater Cincinnati area. Our members include organizations from Chicago, Columbus, and Des Moines.

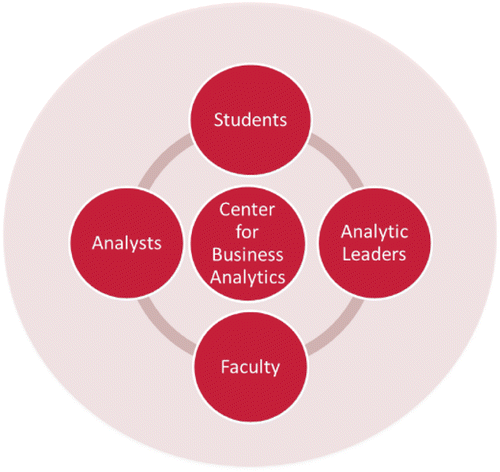
The center seeks to support a natural ecosystem (see Figure 6) that exists between the faculty who desire to teach about and to research real-world problems, business leaders who want to build better decision-making capabilities into their organizations, and practitioners who want to keep pace with the latest tools and methods used in this rapidly growing and changing field. But most importantly, the center provides students with an increased number of experiential-learning opportunities by engaging regularly with our member companies to identify problems where fresh insights and better decisions can be made with data and analytic methods applied to them. During the 2018–2019 academic year, the center engaged 60 MS-business analytics students (more than half of the total number of students) on industry projects.
The center currently staffs five roles: academic director, executive director, marketing and training manager, project and event manager, and full-time administrative assistant. During the academic year, the center also employs graduate assistants from the MS-BANA program, who engage on analytic projects and assist with events, training, and other administrative needs. For the fall 2019 semester, the center will employ up to 10 MS-business analytics students to work on company-supported projects and assist with other center activities. The center also currently employs an undergraduate student to provide continuity to the program on a number of administrative tasks over time.
The center operates as a membership-based entity. Member organizations provide financial support to the center in exchange for benefits that include center-hosted member representative forums, guided student projects, attendance to center-organized public events held several times during the year, and discounts on the center’s robust noncredit professional training course catalog offered throughout the year. Below, we provide more information on each facet of the benefits provided to member organizations by the center.
Member Forums
The center holds bimonthly member-only meetings where a specific topic of interest to our members is chosen for discussion. Past topics have included finding and onboarding analytics talent, text mining, and using external data in your organization. The amount of sharing and collaboration among the members on these topics has been surprising and extremely rewarding for all involved. To facilitate these sessions, we will call on certain center members to lead discussions on the topics if they have expertise that they are willing to share, or we will actively find a nonmember expert (which could be a UC faculty member) to bring to the forum to lead the discussion. The forums are held alternatively at our center location at UC and member locations. These forums have also been an effective way to highlight OBAIS faculty and students by bringing in subject matter experts, holding case competitions for our students, and so forth. Students and faculty are asked to present on work they are doing, which allows the practitioner community to learn about the work being done in the department as well as provides opportunities for students to improve the “soft skills” in presenting to a varied audience outside academia. Faculty learn about what problems are important to industry, and the industry members learn what research work is being done at the university. These forums provide another way in which we can facilitate interaction between our department and industry.
Center Events
The center holds two major events per year to bring together analytics practitioners and experts: the Data Science Symposium in the autumn and, our largest event, the Analytics Summit in the spring. Keynote speakers at these events have included best-selling analytics authors, such as Tom Davenport (Davenport 2007), Eric Siegel (Siegel 2013), and Zeynep Tufekci (Tufekci 2018), as well as leading analytics practitioners, such as Jack Levis (former senior director of process management at UPS), Cameron Davies (senior vice president of decision science at NBCUniversal), Crag Brabec (director of global data insights and analytics at Ford), and other analytics thought leaders, including Stephen Few (data visualization guru) and John Elder (world-renowned expert in data mining). In addition, we have hosted more than 50 other speakers in dedicated analytics tracks from organizations such as Amazon, Disney, Kroger, Macy’s, P&G, Facebook, GE, IBM, and many, many others. Our events have drawn more than 4,000 attendees in total since 2013, with the largest events drawing more than 400.
Professional Development Noncredit Courses
As part of the center’s mission to promote analytics education for practitioners, the center offers a series of short courses on topics such as data visualization, introduction to data mining, advanced data mining, data management, From Mess to Model, analytics in Excel, machine learning, and Power BI and multiple course sequences in tools such as Tableau, R, and Python. More than 1,200 working professionals representing more than 600 companies have attended the center’s professional training courses since 2013 and have provided feedback that has been exceptionally positive.
Student-Faculty Projects
One of the most important missions of the center is to provide meaningful experiential-education opportunities for students in analytics. As previously mentioned, each member organization is guaranteed at least one student project as part of their membership. These student projects are often run through our Graduate Case Studies in Business Analytics class and used for MS-business analytics student capstone experiences. The investment in a project and event manager in the Center for Business Analytics, along with developing standard agreement documents, was key to being able to scale up the number of projects we could run simultaneously.
Over the last three years, more than 60 member-company projects have been completed with students and faculty (many other nonmember organizations have also provided projects). These projects have supported dozens of our MS students and have given them extensive experience in working with real data on real problems. Below, we briefly summarize a few representative projects that have been run through the center in recent years to connect students and faculty with practitioners to provide meaningful results.
Macy’s: A Model-Driven Approach to Store Selling Space Optimization
Historically, Macy’s stores’ sales performance by merchandising line had been compared with benchmarks based on averages of stores of similar scale in terms of size and overall sales volume, rather than a more sophisticated analysis that statistically grouped similar stores. Consequently, some stores either were not challenged enough to perform beyond these averages or were asked to meet unrealistic goals. Additionally, space allocations were made without considering reasonable productivity ranges for merchandising lines, and short-term sales projections were based on plans that were more aspirational targets rather than actual statistical reflections of sales trends. Whereas seasonal plans were focused solely on short-term (six months out) projections, longer-term (with a two- to three-year outlook) sales expectations by merchandising line were approximate extensions of the present.
Macy’s partnered with the UC Center for Business Analytics and the UC School of Information Technology to address this challenge. OBAIS department Professor Yichen Qin and a team of four analytics students from the UC Center for Business Analytics developed the back-end algorithms to support the model-driven approach outlined below using R. Students and faculty from the UC School of Information Technology developed a front-end graphical interface that analysts at Macy’s could use to interact with the algorithms without having to adjust the R code. The timeframe of the project was about four months and was seen as being of high importance throughout Macy’s.
To address the perceived limitations of Macy’s previous approach, three different models were developed. First a coclustering model was developed that statistically groups stores and their merchandising lines based on their performance in a particular time period. Utilizing a coclustering approach, the application allows the analyst to explore different combinations of segments and generates a correlogram to help assess the relationships among the model variations. Second, a nonlinear spline regression optimization model was developed to identify opportunities for sales performance improvement for each store and merchandising line. Utilizing spline regression methods, the model seeks to identify the merchandise mix that generates the maximum sales lift for the store as a whole. Third, a seasonal (random walk) autoregressive integrated moving average model that calculated the monthly trending of every merchandising line in each location for up to 36 months into the future was developed to ensure that the space adjustments identified by the optimization models were consistent with the short- to midterm outlook of the store’s sales performance.
Macy’s developed a new workflow to integrate all three models in recommending optimal store layouts and merchandising mix for new stores and major remodels of existing ones. In addition, each of the models are used independently to meet ad hoc enterprise-level requests. For example, each variation of the optimization model is being tested on a select group of stores that each model has identified as candidates with the highest potential in optimization opportunities. This project was chosen as a 2018 Finalist for the INFORMS Innovative Applications in Analytics Award. Representatives from Macy’s presented details of this project during the Finalist Competition at the 2018 INFORMS Analytics Conference in Baltimore, Maryland.
Wiring St. Xavier High School Football Team
In 2016, through the center’s affiliations with the Cincinnati Reds baseball team, we were introduced to Michael Gordon, the head athletic trainer and a teacher at St. Xavier, a private all-men’s high school located in Cincinnati, Ohio, which is known locally as “St. X.” St. X has a proud history as a sports powerhouse in Ohio, particularly in football, where the program competes at the Division I state level and has produced NFL players, such as Luke Kuechly and Rocky Boiman.
St. X had been using vests that contained GPS and heartrate monitoring technology worn by many of their football team’s starting players to see if the data generated by the devices could help to improve the coaching staff’s training and preparation of their athletes to be at their best for game-day performance. The devices tracked player speed, acceleration, volume, and heart rates, which provided indications of exertion and efficiency of motion in the players. Twenty players were outfitted with the devices, which were worn during practices and also during games. This was important as it provided a clear indication of whether changes made during the week’s training exercises resulted in demonstrable effects on game day.
Although the device manufacturer provided a dashboard for data being collected, the coaching staff were unable to effectively analyze the results. The center assigned several graduate students to this project, who first spent time on the field with the players and also with the vest manufacturer to better understand the key data collected, and what data were the most important to understand training versus game-day performance. By focusing on specific exertion-related variables and plotting them onto time series graphs broken down by player, drill, and position, insights were drawn on which drills caused the most exertion for specific player positions during the week. This led to recommendations to adjust certain players’ training regimens to a heavier workout earlier in the week, allowing them to focus on fundamentals, recovery, and rest just before game day.
The results were dramatic. On the first year of tracking data, players missed a total of 156 games, averaging 10 starters missing a game because of injuries. Using the intuitive analysis, the coaching staff were convinced to change the training regimens for their players. According to Michael Gordon, when the changes were implemented, the number of injuries causing missed games decreased dramatically from 156 missed games to 13 missed games over the course of two seasons (Gordon 2019). The team went on to win the Ohio State Division I Title in 2016.
Conclusions
The OBAIS department at the University of Cincinnati has a more-than-50-year history of working with industry partners to advance the state of analytics research and practice. The department has also had a tremendous impact on knowledge dissemination of analytics through textbook authorship and teaching. Much of the current state of impacting the practice of analytics at UC is accomplished through the UC Center for Business Analytics, which works closely with analytics practitioners through student projects, professional training opportunities, networking opportunities, and large-scale symposium events that bring together hundreds of analytics practitioners to share best practices and learn new techniques and tools. The center provides a unique ecosystem for academic professors, students, and practitioners to interact and advance the state of analytics.
We close our article with a few lessons learned from our experiences in developing analytics programs and our center at UC:
1. Innovation and experimentation is necessary to succeed. Analytics is an ever-changing field in terms of tools and applications, and it is also relatively young as a field. Therefore, we have found that we must be able to adjust our curriculum rapidly—not always a strength at a university. We have also been willing to experiment with offering new classes in different formats. Not all of these have succeeded, but we have always learned, even from those that were less successful.
2. Standardization is the key to scale. One early learning as our center grew from a handful of companies to nearly 30 today is that standardization was important. We have worked hard to standardize agreements with all center members regarding issues such as data privacy concerns, intellectual property issues, and even billing. This requires significant up-front effort but has definitely helped us expand and grow. Similarly, we have tried to develop consistent processes for managing and delivering projects with our partnering companies.
3. Find outside help to take advantage of existing expertise. We have been very successful in leveraging outside resources for teaching certain topics that are not easily found in research faculty and in using outside resources to provide services that are not often within the expertise of research faculty. As an example, we have heavily utilized industry experts in areas such as data visualization and big data where we did not have in-house expertise in our existing faculty. Adding a full-time professional project manager as part of our center staff has also been a key to allowing us to increase the number of projects completed by the center and provide consistent results to our partners.
4. Modeling is not where you spend your time. One of the biggest learnings for our students is that the actual model-building portion of a project is NOT where the majority of time is spent. Problem definition and understanding the data always require the most effort and time for successful analytics in practice. Communicating results is also a key to success. This is often a challenge for students who have been conditioned through traditional coursework to focus on model building. Therefore, we have tried to adjust our curriculum by introducing additional classes in data management, data wrangling, and data visualization to complement existing model-focused classes.
In conclusion, we are thankful and proud to be recipients of the 2019 UPS George D. Smith Prize. We join an illustrious list of programs from other universities in receiving the award (Brown et al. 2015, Armacost et al. 2018, Krishnan et al. 2018, Perakis and Rosenfield 2018, Bowers et al. 2019). We also owe profound gratitude to all the former OBAIS department faculty and students. Receiving this award is truly the culmination of more than 50 years of excellence in the fields of operations research and analytics.
References
- (2019) An Introduction to Management Science: Quantitative Approaches to Decision Making, 15th ed. (Cengage, Boston).Google Scholar
- (2018) Developing operations research practitioners: United States Air Force Academy Operations Research Program. Interfaces 48(6):500–509.Link, Google Scholar
- (2019) Innovative collaboration between industry and academics: Meeting industries future talent requirements. INFORMS J. Appl. Analytics 49(6):397–459.Google Scholar
- (2015) ASP, art and science of practice: Educating military operations research practitioners. Interfaces 45(2):175–186.Link, Google Scholar
- (2007) O.R. in the classroom—get real! OR/MS Today (August 6), https://pubsonline.informs.org/do/10.1287/orms.2007.04.13/full/.Google Scholar
- (1997) Blending OR/MS, judgment, and GIS: Restructuring P&G’s supply chain. Interfaces 27(1):1–16.Google Scholar
- (2018) Business Analytics, 3rd ed. (Cengage, Boston).Google Scholar
- (1959) Introduction to Operations Research (John Wiley & Sons, New York).Google Scholar
- (2007) Competing on Analytics: The New Science of Winning (Harvard Business Review Press, Boston).Google Scholar
- (2019) Business Analytics, 3rd ed. (Pearson, Hoboken, NJ).Google Scholar
- (2016) Managing for Quality and Performance Excellence, 10th ed. (Cengage, Boston).Google Scholar
- (2009) Route design for delivery of voting machines in Hamilton County, Ohio. Interfaces 39(5):443–459.Link, Google Scholar
- (2018) Macy’s: A model driven approach to store selling space optimization. Presentation, INFORMS Analytics & Operations Research Conference, April 18, Baltimore, MD.Google Scholar
- (2019) Video-recorded interview by Danielle Calhoun for Smith Prize presentation, March 14. University of Cincinnati, Cincinnati.Google Scholar
- (2008) Blue-collar scholars. OR/MS Today (August 4), https://pubsonline.informs.org/do/10.1287/orms.2008.04.13/full/.Google Scholar
- (2018) Designing and sustaining an award-winning analytics education program: The Heinz College of Information Systems and Public Policy at Carnegie Mellon University. Interfaces 48(4):372–383.Link, Google Scholar
- (2000) Simulation Modeling and Analysis, 3rd ed. (McGraw Hill, New York).Google Scholar
- (1985) The reduced cost branch and bound algorithm for mixed integer programming. Comput. Oper. Res. 12(2):139–149.Google Scholar
- (2018) The MIT Leaders for Global Operations program. Interfaces 48(3):189–203.Link, Google Scholar
- (2013) Predictive Analytics: The Power to Predict Who Will Click, Buy, Lie, or Die (John Wiley & Sons, Hoboken, NJ).Google Scholar
- (2019) University of Cincinnati starts class with record-breaking enrollment for 7th straight year. WCPO, accessed August 26, 2019, https://www.wcpo.com/news/education/incoming-university-of-cincinnati-freshmen-excited-for-first-day-of-classes.Google Scholar
- (2019) Video-recorded interview by Danielle Calhoun for Smith Prize presentation, March 14. University of Cincinnati, Cincinnati.Google Scholar
- (2018) Twitter and Tear Gas: The Power and Fragility of Networked Protest (Yale University Press, New Haven, CT).Google Scholar
Michael J. Fry is a professor and academic director of the Center for Business Analytics in the OBAIS department at the University of Cincinnati. He is former department head and has been recognized for his teaching and research excellence. His research applies analytics to the areas of supply chain, public policy, healthcare, and so forth. He has partnered in his work with organizations such as Great American Insurance, Cincinnati Fire Department, State of Ohio Election Commission, and Cincinnati Zoo.
Jeffrey D. Camm is professor emeritus in the OBAIS department at the University of Cincinnati and associate dean of business analytics and Inmar Presidential Chair in Analytics at Wake Forest University. He served as head of the OBAIS department for 20 years and was the founding director of the Center for Business Analytics. His research is focused on applications of optimization. He has consulted for numerous corporations, including P&G, GE, Duke Energy, Road Runner Sports, and Kroger.
Glenn Wegryn is the executive director for the Center for Business Analytics at the Lindner College of Business at the University of Cincinnati and principal at Analytic Impact, LLC, a firm specializing in analytics strategy and supply chain design. He has consulted with or spoken at events at Mondelez, Chevron, Verizon, and Ecolab, among others. Previously, Glenn built an award-winning analytics organization at Procter & Gamble over a 28-year career while there.

