


An Operations Research–Based Teaching Unit for Grade 11: The ROAR Experience, Part II
Abstract
In this paper, we continue describing the project and the experimentation of Ricerca Operativa Applicazioni Reali (ROAR; in English, Real Applications of Operations Research), a three-year project for higher secondary schools, introduced. ROAR is composed of three teaching units, addressed to Grades 10, 11, and 12, respectively, having the main aim to improve students’ interest, motivation, and skills related to Science, Technology, Engineering, and Mathematics disciplines by integrating mathematics and computer science through operations research. In a previous paper, we reported on the design and implementation of the first unit, started in Spring 2021 at the scientific high school IIS Antonietti in Iseo (Brescia, Italy), in a Grade-10 class. Here, we focus on the second unit, carried out in Winter/Spring 2022 with the same students, now in a Grade-11 class. In particular, we describe objectives, prerequisites, topics and methods, the organization of the lectures, digital technologies used, and a challenging final project. Moreover, we analyze the feedback from students and teachers involved in the experimentation.
Funding: G. Colajanni and E. Taranto were partially supported by the research projects Programma Ricerca di Ateneo UNICT 2020-22 linea 2, EEEP&DLaD, and OMNIA, respectively, of the University of Catania. The research of G. Colajanni was also partially supported by the Italian Ministry of University and Research and the European Union for the PON project on Research and Innovation 2014–2020 [Grant D.M. 1062/2021]. A. Raffaele was partially supported by the Gruppo Nazionale per il Calcolo Scientifico. These supports are gratefully acknowledged.
Supplemental Material: The online appendix is available at https://doi.org/10.1287/ited.2023.0001.
1. Introduction
In spring 2021, we started an experimentation of the didactic project Ricerca Operativa Applicazioni Reali (ROAR; in English, Real Applications of Operations Research) in a high school class at IIS Antonietti in Iseo (Brescia, Italy). The ongoing project aims to increase students’ interest and motivation in science, technology, engineering, and mathematics disciplines by integrating mathematics and computer science through operations research (OR). The current implementation consists of a three-year project work fitting a percorso per le competenze trasversali e l’orientamento (path for transversal skills and orientation), an Italian innovative teaching method that has been introduced in Italian high-school programs to strengthen students’ knowledge through practical experiences (Ministero dell’Istruzione, Università e della Ricerca 2018).
We carried out the first teaching unit of ROAR (ROAR I) in a grade-10 class. Between March and May 2021, we held six lectures. In that unit, we introduced the concept of optimization problems, and we showed students how to solve them with the help of purely mathematical techniques or by exploiting specific software, such as GeoGebra (2021) and the add-in Solver of Microsoft Excel (Microsoft Corporation 2019). We described the design, implementation, and main results of ROAR I in Colajanni et al. (2023).
We presented the second teaching unit of the project (ROAR II) to the same students, then in grade 11, between January and April 2022. The main topic of ROAR II is graph theory. Starting from intuitive notions and basic definitions, we introduced some classic problems, such as the shortest path problem and the minimum spanning tree problem. We presented a few exact algorithms to solve some of these problems, and we also explained the usefulness of heuristic algorithms to solve more complex problems, such as the traveling salesman problem. As a final project, in contrast to ROAR I, each group had to face a final project, solving the same problem in a competitive climate: a vehicle routing problem in the context of home delivery of groceries. Moreover, in parallel with the ordinary lectures, we presented a series of seminars given by industry experts to discuss several OR applications in different fields.
This paper, which focuses on ROAR II, is structured as follows. In Section 2, we present, from a pedagogical point of view, the teaching methodologies adopted in ROAR II, such as competitive learning, discovery learning, and seminar presentations. In Section 3, we illustrate the unit design by discussing goals, student prerequisites, and instructor roles. In Section 4, we describe the unit implementation by reporting the positioning of ROAR II in the mathematics and informatics programs, the teaching methods and the digital technologies used, the assessment adopted, and the structure of each lecture as well as the interdisciplinary connections made. In Section 5, we report on the main results and feedback from students and teachers involved. In Section 6, we provide our final thoughts on ROAR II and some general considerations on the project. Finally, in Online Appendix A, we include the problems presented during ROAR II, and in Online Appendix B, we report the format of the vehicle routing problem instances given to the students for the final project.
2. Background
As pointed out in Colajanni et al. (2023), although OR is a branch of applied mathematics that allows showing mathematics connections with the real world, it is not typically included in most upper secondary school curricula (grades 9–12) and mainly presented at the university level. Lately, some initiatives have been developed to introduce OR to students before university level (Raffaele and Gobbi 2021). Riding on this wave, we continued carrying on the ROAR project with the experimentation of ROAR II, which is based on new educational theories and methodologies framing the development of the activities. This choice of modifying some methodological frameworks concerning ROAR I is dictated by the fact that we believe it is necessary to improve the effectiveness of learning mathematics to enhance students’ mathematical thinking ability in agreement with Amirullah (2018). Because teaching and learning constitute a single process (Brousseau 1986), the former can be considered successful if the teacher can innovate the learning process to motivate students to more actively, creatively, and systematically solve problems (Ginanjar et al. 2019).
As already mentioned, the ROAR project experimentation continues with the same class. Thus, adding new teaching methodologies designed for students with whom we have already worked allows these to achieve a conceptual understanding and to set learning objectives (Amirullah 2018).
In what follows, we describe the theories and teaching methodologies underpinning ROAR II.
2.1. Discovery Learning
Discovery learning is a learning model that makes students actively discover mathematical concepts. It is designed so that students can discover concepts and principles through their mental processes (Putri et al. 2020). Indeed, this model is conceived for developing students’ active learning by finding out and investigating by themselves so that results are long-lasting in memory and not easily forgotten (Martaida et al. 2017). The discovery learning model is a series of learning activities that emphasize students’ critical thinking process and analysis for them to achieve and find their answers to the problems asked. The essence of discovery learning is to make students play the role of the discoverer, that is, to put them in situations in which they should commit to handling a problem and finding a possible solution. In other words, one could say that it represents a kind of training for when, once in the real world, the students, future citizens, face situations on their own that were not studied at school. According to Bruner (1997), the benefits of the discovery learning process are increasing the intellectual potential, shifting values from extrinsic to intrinsic to improve long memories, and the heuristic learning of the findings. The main objective in choosing to employ this model is to maximize students’ engagement in teaching and learning activities and develop their confidence in what they discover during the learning process (Martaida et al. 2017). Several studies demonstrate the positive impact of discovery implementation. For instance, the results by Abdisa and Getinet (2012) state that discovery is more effective in improving students’ achievement, followed by demonstration methods, whereas frontal teaching is the least effective. According to Gholamian (2013), discovery learning is an efficient way to reinforce students’ creative thinking. Because the main actions of the discovery learning model are exploration, discovery, testing, conjecturing, and proving (Ferrarello et al. 2021), in ROAR II, we engaged students in tackling problems that require them to have a clear and imaginative ability to think, evaluate proofs, play with logic, and find alternatives for solutions.
2.2. Competitive vs. Collaborative Learning
Teachers have the option of structuring lectures collaboratively, cooperatively, competitively, or individually, and decisions made by teachers in structuring lectures can influence students’ interactions with others, knowledge, and attitudes (Carson 1990).
In ROAR I, group work was always based on collaborative learning. In both Colajanni et al. (2023) and Taranto et al. (2022), we deal extensively with the aspects of this methodology implemented in ROAR I. Here, we give just the following brief hints. Collaborative learning is a teaching technique in which students should work together to achieve their goals. Students can share their strengths, improve their weaker skills, and develop their interpersonal skills. In ROAR I, this methodological choice proved effective when applied to problem-solving activities. In ROAR II, most of the problem-solving activities again favored collaborative learning. In the final project ending the unit, we chose to allow students to continue working in groups, but we assigned a competition. By definition, competition results in individuals achieving different outcomes. When one person accomplishes a goal, others may be prevented from doing so (Deutsch 1949). Competitive learning can be interpersonal (between individuals) or intergroup (between groups) (Johnson et al. 1986). In ROAR II, we chose this second approach. A competition done in the absence of a normative evaluation system and not used too frequently fosters cooperation within the same group (Cohen 1994). Typically adopted in mathematical competitions, such as the International Mathematical Olympiad, competitive learning provides several benefits. Indeed, according to Thrasher (2008), besides being a challenge for teachers and students, it stimulates students’ curiosity and activity, promotes teamwork and enthusiasm, and provides opportunities to explore different types of problems not usually encountered in regular mathematics curricula. We can find the description of some competitions on OR topics in Raffaele and Gobbi (2021). These usually involved classes belonging to different schools. However, as far as we know, there are no studies in the literature investigating the impact of competitive learning in groups of students within the same classroom engaged in OR activities. This represents an innovative aspect of ROAR. In this article, we provide just a few hints and postpone to future work the investigation of the learning implications of our choices for the students.
2.3. Seminar Presentations
Knowledge acquisition can be achieved by scaffolding, that is, the construction of prior knowledge (Anghileri 2006). Often the movement is from the known to the unknown, from the concrete to the abstract. The teacher’s role in this process is to guide and facilitate learning and not just to impose on students what must happen (Haberman 1992). The teacher may give up this role to some experts external to classroom life. This may occur, for instance, when students are invited to participate in a seminar. During seminars, some people gather to discuss and learn specific techniques and topics. Usually, each presentation features several speakers who are experts in their fields.
In ROAR II, we organized a series of seminars allowing students to get an idea of some concrete working opportunities obtainable through the study of OR. On the one hand, this methodological choice allowed that the institutional figure of knowledge was not always and only covered by the class teacher or the experimenters. On the other hand, the confrontation with more experts, who bring in knowledge from fields related to OR, broadens the educational offer of the project itself.
3. Design of the Second Teaching Unit of ROAR
In this section, we describe the main objectives pursued, the prerequisites needed, and the roles to be played by the instructors in ROAR II.
3.1. Objectives
The first goal is to introduce graph theory. Once provided with the mathematical concepts of undirected and directed graphs, students are shown how they can schematize familiar concepts, such as relationships among people or road maps, and their usefulness in the discipline of OR. Famous network problems are introduced, such as the minimum spanning tree, shortest path, rural postman, and traveling salesman problems. Each problem is explained through examples close to students’ everyday life or related to industrial reality.
The second goal is to provide the concept of an optimization algorithm. For some of the presented problems, ad hoc solution algorithms are shown, such as Kruskal’s and Dijkstra’s algorithms for the minimum spanning tree and shortest path problems, respectively.
The third goal is to explain the concept of a heuristic algorithm. Before tackling some problems with us experimenters, we ask students to develop some heuristic algorithms and evaluate their efficiency. We also introduce a few examples of heuristic algorithms for the traveling salesman problem.
The fourth goal is to reinforce the skills students acquired during ROAR I, that is, mathematical modeling and the use of the Microsoft Excel add-in Solver. For some network problems, we ask the students first to build from scratch, without our help, the corresponding mathematical models and then solve them using Solver.
The fifth objective is to teach how to choose the appropriate methodology to solve a network problem from among all possible techniques or tools learned in this unit or during ROAR I. We present some variants of famous network problems, even of high complexity, to make students understand when it is preferable to resort to exact or heuristic algorithms. By doing so, we focus on the different aims of exact methods and heuristics by highlighting their strengths and weaknesses to compare the mathematical modeling and algorithmic approaches.
Similarly to ROAR I, we continue the strengthening of some soft skills. Teamwork and problem-solving skills are enhanced through group work during the lectures and the assigned homework (sixth objective). Public speaking skills are reinforced by interacting with the teachers at the end of each group work and, mostly, by carrying out the final project, for which each group of students has to present the results of the work done to tackle a challenging problem (seventh objective).
Finally, the eighth objective is to increase awareness and knowledge of OR applications in reality. By doing this, we also aim to have an impact in respect to students’ orientation and civic education.
3.2. Students’ Prerequisites
Students do not have to possess any particular prerequisites to be introduced to graph theory, the central topic of this second unit. Some of the objectives described in the previous section (i.e., the fourth and part of the fifth) require them to have already carried out ROAR I. Nonetheless, if one would like to only experiment with this second unit, it is possible to ignore them by just focusing on graph theory and the algorithmic approach.
3.3. Instructors’ Roles
As in ROAR I, we can distinguish two roles. An experimenter is the one who introduces new topics and guides students in various activities. To implement the unit, there must be at least one experimenter, who is preferably an expert in graph theory and OR. On the contrary, an observer has the main task of taking notes on the progress of the lectures as well as students’ reactions and comments, especially during group work, for research purposes. Though observers are not required to be experts on the topics of the unit, they need to be familiar with its design to offer valid support for the students and the experimenters. The presence of an observer is not strictly necessary.
4. Implementation of the Second Teaching Unit of ROAR
Composed of seven lectures, ROAR II was implemented from January to April 2022. Because of the COVID-19 pandemic, we had to hold some lectures in a mixed mode, that is, the experimenters, teachers, and most of the students were in the classroom, whereas sometimes, when forced by quarantine rules, a few students were connected remotely using the Microsoft Teams platform.
4.1. The Grade-11 Class
The grade-11 class involved in the second year of ROAR was composed of 13 males and 9 females. All of them had participated in the experimentation of ROAR I. As described in Colajanni et al. (2023), before attending the activities of ROAR, students had already participated in problem-solving activities. For instance, during ordinary lectures in previous years, they had solved problems related to real-life situations, and some of them had participated in mathematical competitions, such as the Mathematical Olympiad. Regarding digital technologies, students were already familiar with Mentimeter (2021) and Microsoft Excel, especially after ROAR I. Also, they already knew Kahoot! (2022) from other activities in previous years. According to their mathematics teacher, M. Picchi, their mathematical skills were just above the average level both in comparison with other grade-11 classes in the same school and at the national level. In general, students’ interest in mathematics and their engagement were higher than the previous year during ROAR I, whose lectures were held almost totally in the distance-learning mode imposed after the COVID-19 spread. This year, students collaborated with peers mostly in the classroom. Also, when required because of COVID-19 quarantine rules, they interacted with the students remotely connected using Microsoft Teams.
4.2. The Instructors
The instructors were the same as in ROAR I. There were two experimenters (A. Gobbi and A. Raffaele, both researchers in OR) and two observers (G. Colajanni and E. Taranto, researchers in OR and mathematics education, respectively, connected remotely for a geographical reason). Also, for one lecture only (see Section 4.8.5 for the details), a student who had just obtained a bachelor’s degree in computer engineering covered the role of the experimenter. The class had never met him before. The mathematics and physics teacher of the grade-11 class (M. Picchi) did not cover the experimenter role.
During group work activities, the main experimenters and the mathematics teacher assumed the role of observers. Thus, the total number of observers was five, as many as the number of groups the students were divided into (see Section 4.4).
4.3. Positioning in the Mathematics and Informatics Programs
ROAR II lectures were inserted during the regular school schedule of the grade-11 class.
At the beginning of the experimentation, all students had already acquired basic algebraic skills in solving different types of equations and inequalities. In particular, they were able to work with linear, quadratic, exponential, and logarithmic functions. As for previous informatics knowledge and skills, they had experience with graph theory and some basic network applications. Also, they were familiar with the concept of algorithms because they had used it to code in C++.
4.4. Teaching Methods
Regarding the main teaching methods adopted during ROAR II, most of them were the same as in ROAR I. Thus, we refer the reader to Colajanni et al. (2022, section 3.4) for more details about frontal lectures, collaborative learning, homework assignment, and authentic problems. Hereafter, we provide the details about how we implemented other teaching methods, new concerning ROAR I.
4.4.1. Competitive Learning.
As a final project, we assigned a challenge to the groups by applying competitive learning to increase students’ motivation and engagement. The context of the project was the same as the authentic problems assigned as a final project during ROAR I (see Colajanni et al. 2022, section 4.4.4). We presented the final project during lecture 6 (see Section 4.8.6) as follows.
The supermarket chain SuperAmazingMarket has decided to offer a home grocery delivery service. Each customer is located in the province of Brescia and requests a certain number of shopping bags containing some goods. Each supermarket providing the service, located in the same area, can rely on small-, medium-, and large-capacity vehicles for the delivery: the small-capacity vehicle can carry at most 30 shopping bags and the medium one at most 50, whereas the large one at most 70. Each day, each truck in each supermarket loads the shopping bags to be delivered and sets off to make the deliveries. Each vehicle can stay on the road for a maximum of three hours from the departure until the return to the same supermarket where it started. During the journey, each vehicle can pass, even more than once, next to customers (without necessarily serving them) and supermarkets (including its own but without stocking up on other bags). Once back at its supermarket, the vehicle can no longer leave. Each courier who drives a truck and delivers the shopping bags costs the company €50 per day. Also, it takes about one minute to bring a pair of bags from the vehicle to the customer’s home. During the actual delivery phase, the truck is shut down. Finally, it is estimated that the fuel for the vehicles costs €0.07 per minute.
The company SuperAmazingMarket asks for your help in trying to spend as little as possible by establishing
What vehicles from each supermarket will make the deliveries.
What path each of these vehicles must follow.
What customers each of these vehicles should serve.
In particular, the company is interested in solving the problem on three hypothetical scenarios, characterized by
A different number of customers to serve.
A different number of supermarkets.
A different number of vehicles available and their allocation to the various supermarkets.
Also, each scenario includes the number of shopping bags ordered by each customer and what roads can be traveled.
The instructions given to the students were the following.
You are five experienced operations research teams looking for job opportunities. You have read the problem of the company SuperAmazingMarket. You know that only the group that presents the best solutions will be hired. To solve the problem, you are free to use any digital technologies and to make the most of all the operations research knowledge you have acquired during these years (e.g., mathematical modeling, developing ad hoc algorithms, or variants of those you know). Results will be exposed to the company executive directors in about a month. Each team will have 20 minutes for the presentation, in which the methodology developed will have to be described in detail as well as how it was applied to solve the hypothetical scenarios provided by the company. However, to be sure that you are working in the meantime, the company:
Would like to have, within the first two weeks,
‐ At least one feasible solution of two instances (i.e., for each instance, the value of the objective function and the vehicle routes and, for each customer, which vehicle serves it).
‐ The explanation, in general terms, of the methodology, provisionally adopted, which is potentially applicable also to other instances not available to you.
Keeps up to date a shared sheet in which each team can see who has obtained the best solutions for each of the three instances.
To update the solutions, each team must contact the company, sending the new solutions found together with the explanation or pseudocode of the method used (or the improvements introduced by the last update).
We offered the following warnings:
Receiving only the new solutions without an explanation attached will not be enough to update the shared sheet.
Each team will have access to the shared sheet only after the first solution is submitted.
For the first two weeks, the company also keeps a contact center active to request information and clarifications regarding the problem, its characteristics, or the project objectives. The response is guaranteed within 48 hours of the request.
The three hypothetical different scenarios given to the students were three instances of increasing difficulty in terms of the number of customers to serve: 10 in the so-called demo instance, 15 in instance 1, and 20 in instance 2. To help groups develop and evaluate their solving methods, we provided them with the value of the optimal solution of the demo instance. Online Appendix B illustrates the format used to describe the instances.
By “contact center,” we meant that students could write to the two experimenters and one observer.
We point out that competition among groups was encouraged in two different ways. First, the shared sheet, constantly updated, was an incentive to encourage the groups to get better solutions. Second, we promised to give away a small surprise prize (consisting of a wooden puzzle game) to the best group in terms of results, quality, and presentation of the developed approach. However, we underline that the instructions did not explicitly state that groups could not collaborate.
Results and feedback received about the final project are analyzed in Section 5.
4.4.2. Discovery Learning.
In the second part of lecture 4 (see Section 4.8.4), we assigned to the students a group work related to the two theorems by Euler about Eulerian paths and cycles. In particular, we did not introduce the students in advance to the needed properties of Eulerian graphs. On the contrary, we let them tackle a series of small exercises to discover, formulate, prove their theorems, and finally solve the well-known problem of the seven bridges in Königsberg (see seven bridges in Online Appendix A).
4.4.3. Seminar Presentations.
In parallel with the lectures, we conceived and presented ROAR in Action!—a series of seminars open to all grade 11 and 12 classes of IIS Antonietti as well as external students from other institutes or interested people. The main purpose of ROAR in Action! was to discuss OR and mathematics applications in several fields. Each seminar was given by different experts. There were young researchers, a start-upper, engineers, a computer scientist and philosopher, and a graduate in history. All seminars were held on the Zoom platform with the speakers, our team, and the classes connected remotely. In particular, classes exploited laptops and the interactive board in their classrooms to interact by activating the microphone or writing questions in the Zoom chat. The purposes of ROAR in Action! were many. First was to disseminate and communicate how OR and mathematics can be used to address and solve optimization problems of different natures. Then, there was an aspect related to student orientation. Indeed, all speakers dedicated part of their presentation to illustrating their background and career path, showing students various possibilities of what could await them after school or university. Finally, some topics also covered civic education issues.
For each seminar, Table 1 reports the date, the speaker’s name, the title and main topics of the presentation, and a reference to an article on the seminar, published on MaddMaths!1
|

Table 1. Details of the ROAR in Action! Seminars
| Date | Speaker | Title | Topics | Reference |
|---|---|---|---|---|
| Feb. 01, 2022 | Marco Gussago (Libraries Office, Province of Brescia) Fabio Bazzoli (Sistema Bibliotecario Sudovest Bresciano) | The interlibrary loan service from a mathematical point of view | Routing | Raffaele (2022a) |
| Feb. 14, 2022 | Leonardo Drahorad (Amazon) | Amazon Logistics: geospatial optimization of deliveries | Facility location | Raffaele (2022b) |
| Mar. 02, 2022 | Veronica Dal Sasso (Optrail s.r.l.) | How maths helps make trains work better | Railway transportation | Raffaele (2022c) |
| Mar. 10, 2022 | Martina Fischetti (European Commission, Joint Research Centre) | Mathematics for a more sustainable future between renewable energy and transport | Sustainability Public transportation | Raffaele (2022d) |
| Mar. 18, 2022 | Veronica Asta (OPTIMeasy Srls) | Optimization of railway shunting operations in the port area | Freight transportation Scheduling | Raffaele (2022e) |
| Apr. 08, 2022 | Anna Melchiori (World Food Programme) | Optimus: fighting world hunger with optimization | Diet Maximum flow | Raffaele (2022f) |
4.5. Digital Technologies
As main digital technologies, we adopted Solver (Microsoft Corporation 2019), Mentimeter (2021), and Kahoot! (2022). Solver is an add-in program of Microsoft Excel used to solve mathematical optimization models, whereas Mentimeter allows the development of interactive live polls to actively involve the students in the activities. Because we had already used these two technologies during ROAR I, we again refer the reader to Colajanni et al. (2023, section 3.5) for more details. Hereafter, we just focus on the last technology mentioned, which was not exploited in ROAR I.
4.5.1. Kahoot!
According to Wang (2015, p. 218), Kahoot! is a “game-based student response system where the classroom is temporarily transformed into a game show,” that is, it is a learning platform that can be used to review students’ knowledge funnily and engagingly. A Kahoot! quiz is composed of a series of questions and possible answers designed by the teacher, or in our case, by the experimenters. When a quiz is started, students need to answer as quickly and correctly as possible by using their devices to get as many points as possible. A distribution chart and a scoreboard after each question enhance competition among students. Also, the presence of colorful graphics and entertaining music fosters students’ engagement. Wang and Tahir (2020) performed a literature review on 93 studies about the effects of using Kahoot!, stating that it can have a positive effect on learning and classroom dynamics; decreasing students’ anxiety; and increasing motivation, concentration, and perceived learning.
In ROAR II, we developed three Kahoot! quizzes, composed of 19, 21, and 46 questions, respectively. We performed the first two during lecture 4 (see Section 4.8.4), whereas the last one was done during lecture 5 (see Section 4.8.5). The main goal was to strengthen students’ knowledge and understanding of basic notions of graphs and the main steps of Kruskal’s and Dijkstra’s algorithms. Figure 1 illustrates a few examples of the questions presented.
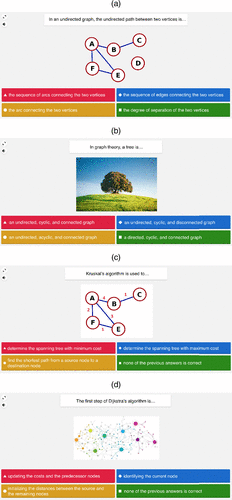
Notes. (a) On the definition of an undirected path. (b) On the definition of a tree. (c) On Kruskal’s algorithm. (d) On Dijkstra’s algorithm.
4.6. Questionnaires
Similarly to what we did at the beginning of ROAR I (see Colajanni et al. 2022, section 3.6), one week before meeting the grade-11 class in January 2022, we asked the students to fill in an anonymous questionnaire about their feelings toward mathematics and their expectations on ROAR II. Moreover, we requested the students to use the same nicknames they had adopted in the analogous questionnaires of ROAR I. This was done because we are going to perform a longitudinal study at the end of the three-year experimentation of ROAR. Another similar questionnaire was given at the end of the lectures to receive some feedback on the whole unit, the final project (see Section 4.4.1), the workshop at the University of Brescia (see Section 4.8.4), and the series of seminars called ROAR in Action! (see Section 4.4.3). We developed both questionnaires with Google Forms, and we shared the related links with the students. In Section 5.2, we show the main results.
4.7. Assessment
At the end of the teaching unit, we did not perform a summative individual assessment. Indeed, as in ROAR I (see Colajanni et al. 2022, section 3.7), we preferred to focus on collaborative learning and the development of soft skills, such as teamwork. We assessed the students’ acquisition of competencies by a final presentation on the challenge assigned to the five groups (see Section 4.4.1). This resulted in a formative and summative assessment. We considered the following four criteria: work group (in terms of collaboration and harmony), analysis and deepening of the contents (observation and reasoning), exposition (clarity, completeness, and lexicon), and knowledge and understanding (abstraction and generalization). For each aspect, each experimenter and the classroom teacher assigned to each student a score from 1 (i.e., very poor) to 10 (i.e., excellent). By computing the average, we obtained the final scores reported in Section 5.1. We point out that we did not include, as an individual aspect, the ranking of the students’ groups obtained by considering the best results on the three scenarios of the challenge. We took the ranking of the groups into account along with each group’s average total score to decide to which group to award the competition prize.
4.8. Organization of the Lectures
Hereafter follow the details of the seven lectures held in the grade-11 class at IIS Antonietti from January 17 to April 23, 2022. For each lecture, we indicate the date, an overall indicative duration, the structure (i.e., all the activities performed), the homework assigned, the teaching methods adopted, and the digital technologies used. Also, we report on the modality of each lecture, how many students were in the classroom, and how many were connected remotely (because of COVID-19 quarantine rules).
Typically, we alternated between frontal lectures and group work activities. In what follows, we use this typewriter font to write the title of a problem presented as an example or assigned as an exercise. The texts of all problems are reported in Online Appendix A. Sometimes, differently from ROAR I, we let students explore problems by themselves without explaining in advance the techniques they had to use. This fostered their creativity and problem-solving skills. In particular, we adopted this method in lecture 4, when we assigned the Grafopoli problem and the series of tasks in the Seven bridges problem, and in lecture 6, for the A trip to Milan and the Traveling Salesman problems.
4.8.1. Lecture 1.
We started this first lecture by making the students answer a Mentimeter live interactive poll to recap the main topics and features of ROAR I. Then, we introduced the basic notions of graph theory by exploiting an application close to the students’ reality, that is, social networks. In particular, Facebook and Instagram were used to discuss the concepts of undirected and directed graphs, respectively. Successively, we provided the formal definition of some basic notions of graph theory as indicated in Table 2. After a second interactive poll, we ended the lecture by assigning some homework for lecture 2.
|
Table 2. Details of Lecture 1
| Lecture 1 | January 17, 2022 |
|---|---|
| Duration | Three hours |
| Structure |
|
| Homework | A series of exercises to enforce the graph-theory notions learned: Graphs, graphs, and more graphs. |
| Teaching methods | Frontal teaching Interactive polls Homework assignment |
| Digital technologies | Mentimeter |
| Modality | 14 students, the teacher, and the experimenters were in the classroom. 8 students and the observers were connected remotely. |
4.8.2. Lecture 2.
As described in Table 3, to recap the main definitions introduced during lecture 1, we engaged students in an interactive live poll asking the following questions: What concept indicates the number of edges incident at a vertex? In an undirected graph, how do you say two edges that have a vertex in common? What do you call a sequence of edges (or arcs) linking two vertices? What type of graph has each vertex connected to all the others? In the first part of the lecture, we corrected the assigned homework, and we retrieved the text of Mineral water, a transportation problem of ROAR I (see Colajanni et al. 2022, appendix A), to show how that problem could be represented through a bipartite graph. Then, we introduced the minimum spanning tree problem on undirected graphs (see, e.g., Graham and Hell 1985) using the Optical fiber problem, a realistic situation set in Iseo, the town of students’ school. We involved students in an active discussion, asking them how they would have tackled the problem. After that, we taught them the well-known Kruskal’s algorithm to compute a spanning tree with minimum cost. In the second part of the lecture, we divided students into five groups: two groups composed of five students and three groups of four students. We underline that the composition of the groups remained the same during all successive lectures and the final project as well. We assigned to the groups a problem related to the application of Kruskal’s algorithm, which we corrected after about 45 minutes. Then, we assigned homework for lecture 3. In the conclusive live poll, we asked students to evaluate the following aspects of Kruskal’s algorithm according to their opinion: simplicity, efficiency,2 clarity, and applicability to real situations. Results are shown in Figure 2(a).
|
Table 3. Details of Lecture 2
| Lecture 2 | January 29, 2022 |
|---|---|
| Duration | Four hours |
| Structure |
|
| Homework | Representation of an example by means of bipartite graphs Finding an application of the minimum spanning tree problem Application of Kruskal’s algorithm to the Condominium water network problem. |
| Teaching methods | Frontal teaching Interactive polls Collaborative learning Homework assignment |
| Digital technologies | Mentimeter |
| Modality | 21 students, the teacher, and the experimenters were in the classroom. 1 student and the observers were connected remotely. |
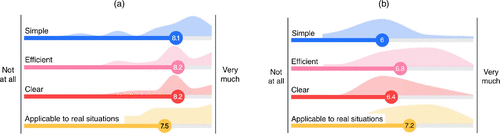
Notes. The scale used ranges from 1 (i.e., not at all) to 10 (i.e., very much). (a) Students’ evaluation of Kruskal’s algorithm. (b) Students’ evaluation of Dijkstra’s algorithm.
4.8.3. Lecture 3.
We started the third lecture using an interactive live poll to review the notions of tree and minimum spanning tree as well as the main steps of Kruskal’s algorithm, and we corrected the homework assigned. As summarized in Table 4, in the first part of the lecture, we assigned the groups a problem related to the shortest path problem (see, e.g., Chen 2003). Differently from the previous group works, we did not explain to the students what algorithm to apply, but we left them to explore the ideas and approaches that came into their minds. After 30 minutes, we taught them Dijkstra’s algorithm. In the second part of the lecture, we assigned students another group work, which required them to both apply Dijkstra’s algorithm and develop some heuristic algorithms. We gave them 60 minutes, after which we reviewed and discussed their approaches together. Then, we focused on the skill of writing a pseudocode to describe input, output, and main steps of an algorithm. We assigned some homework for the successive lecture, and similarly to what was done for Kruskal’s algorithm at the end of lecture 2, we asked students to evaluate Dijkstra’s algorithm as well in terms of simplicity, efficiency, clarity, and applicability to real situations. Results are shown in Figure 2(b).
|
Table 4. Details of Lecture 3
| Lecture 3 | February 5, 2022 |
|---|---|
| Duration | Four hours |
| Structure |
|
| Homework | Finding an application of the shortest path problem Application of Dijkstra’s algorithm to the Let’s go to the concert problem. |
| Teaching methods | Frontal teaching Interactive polls Collaborative learning Homework assignment |
| Digital technologies | Mentimeter |
| Modality | 21 students, the teacher, and the experimenters were in the classroom. 1 student and the observers were connected remotely. |
4.8.4. Lecture 4.
The fourth lecture, described in Table 5, was extraordinarily held at the University of IIS Antonietti in the form of a one-day workshop. In the beginning, the grade-11 class was welcomed by Professor Lucio Zavanella (the director of the mechanical and industrial engineering department) and by Professor Renata Mansini (full professor of operations research in the information engineering department). Professor Lucio Zavanella and Professor Renata Mansini presented several engineering courses (in particular, the OR classes) and answered a few questions from the students. Then, we started the activities, which were divided into two parts. In the morning, we first performed a Kahoot! quiz on the main notions about graphs and Kruskal’s and Dijkstra’s algorithms. Then, we assigned as a group work the mathematical modeling of the Grafopoli problem, which students had already algorithmically solved during lecture 3. In this lecture, we wanted to model the problem as the shortest path problem to retrieve and reinforce students’ modeling skills acquired during ROAR I. After 30 minutes, each group discussed the attempts they made, and we formulated the model together. Successively, we assigned a second group work requiring the application of Dijkstra’s algorithm. Similarly to the first exercise, after 30 minutes, we discussed the solutions obtained by the groups together. In the afternoon, after a one-hour lunch break, we engaged the students in another Kahoot! quiz. Then, we assigned them a third group work, inspired by Research in Action (2021), related to the two Euler’s theorems on Eulerian paths and cycles. After almost two hours, we discussed the results together. Finally, we assigned homework for the successive lecture.
|
Table 5. Details of Lecture 4
| Lecture 4 | February 11, 2022 |
|---|---|
| Duration | Six hours (three in the morning + three in the afternoon) |
| Structure |
|
| Homework | Development of a heuristic algorithm to solve Task 3 and application of Solver to solve Task 4 of the Grafopoli problem. Development of a heuristic algorithm to solve Task 4 of the Lunch break problem. |
| Teaching methods | Quizzes Collaborative learning Discovery learning Homework assignment |
| Digital technologies | Kahoot! Solver |
| Modality | All the students, the teacher, and the experimenters were in the classroom at the University of Brescia. The observers were connected remotely. |
4.8.5. Lecture 5.
The fifth lecture started with a Kahoot! quiz and the correction of the homework assigned at the end of lecture 3. To check these, we designed the following peer review activity (Dominick et al. 1997). For both the Lunch break and the Grafopoli problems, each group had to design a heuristic algorithm and describe it using a pseudocode (i.e., by specifying input, output, and main steps to execute). We provided each group with the pseudocodes of two other groups (one for Lunch break and another for Grafopoli). Then, each group had to execute (i.e., perform the operations described) and evaluate the algorithms developed by the two other groups. In particular, for each pseudocode, each group had to grade the following aspects using a scale from 1 to 10: clarity of the steps, rapidity, correctness, and efficacy. After 45 minutes, we discussed the results together and whether they had encountered any difficulties or issues in understanding or executing the other groups’ algorithms. In the second part of the lecture, a university student, who had just graduated with a master’s degree in computer engineering at the University of Brescia, talked about the rural postman problem (see, e.g., Eiselt et al. 1995). After his seminar, students had the chance to ask questions to him and the experimenters to understand the problem better. These activities are summarized in Table 6.
|
Table 6. Details of Lecture 5
| Lecture 5 | March 12, 2022 |
|---|---|
| Duration | Four hours |
| Structure |
|
| Homework | Finding an application of the rural postman problem. |
| Teaching methods | Frontal teaching Quizzes and interactive polls Collaborative learning Homework assignment |
| Digital technologies | Kahoot! Mentimeter |
| Modality | All the students, the teacher, and the experimenters were in the classroom. The observers were connected remotely. |
4.8.6. Lecture 6.
In this lecture, detailed in Table 7, we presented the traveling salesman problem (see, e.g., Dantzig et al. 1954). In the beginning, we assigned a first group work inspired by a school trip the class would have done a few weeks later to Milan, Italy. The assignment asked students to compute how to visit all given points of attraction in Milan by walking as little as possible. After 30 minutes, first, we formally introduced the problem by talking about its relevance in OR, and we defined a few heuristic algorithms. Then, we discussed the ideas developed by the groups together. A second group work focused more on modeling aspects of the problem. We asked students to formulate an integer linear programming model of a given instance. They also had to implement it and solve it using Solver. We point out that most groups correctly formulated all the constraints except for subtour elimination constraints as we expected. Anyway, one group surprised us. Indeed, by looking at the values returned by Solver, some students could understand the issue. Thus, they iteratively added new constraints to avoid some solutions until they obtained a Hamiltonian cycle. In other words, they applied a branch-and-cut algorithm without knowing it. In the last part of the lecture, we presented the final project (see Online Appendix B).
|
Table 7. Details of Lecture 6
| Lecture 6 | March 21, 2022 |
|---|---|
| Duration | Four hours |
| Structure |
|
| Homework | None. |
| Teaching methods | Frontal teaching Interactive polls Collaborative learning Project-based learning Competitive learning |
| Digital technologies | Mentimeter Solver |
| Modality | All the students, the teacher, and the experimenters were in the classroom. The observers were connected remotely. |
4.8.7. Lecture 7.
In the last lecture of the unit, summarized in Table 8, each group had 20 minutes to report on the solution approaches developed for the final project. Also, they had the chance to comment on the main difficulties and issues faced. Then, to conclude, every student filled in a final questionnaire about the whole teaching unit, the challenging final project, the workshop at the University of Brescia, and the seminars described in Section 4.4.3.
|
Table 8. Details of Lecture 7
| Lecture 7 | April 23, 2022 |
|---|---|
| Duration | Four hours |
| Structure |
|
| Homework | None |
| Teaching methods | Project-based learning Collaborative learning Competitive learning Questionnaire |
| Digital technologies | Google Form |
| Modality | 21 students, the teacher, and the experimenters were in the classroom. 1 student and the observers were connected remotely. |
4.9. Linking Implementation to Objectives
In Table 9, we summarize how the objectives of the teaching unit listed in Section 3.1 were achieved and in which lectures.
|
Table 9. Linking the Objectives of the Teaching Unit to the Implementation Described in Section 4
| Objective | How achieved | Lectures |
|---|---|---|
| 1. Introducing graph theory | Presentation of the notion of graphs, related concepts, and some network problems (i.e., the minimum spanning tree problem, the shortest path problem, the rural postman problem, and TSP) | 1–6 |
| 2. Introducing optimization algorithms | Definition of the concept of algorithm, and explanation of Kruskal’s and Dijkstra’s algorithms | 2–4 |
| 3. Introducing heuristic algorithms | Development of heuristic algorithms for TSP and variants of some network problems, and introduction to writing pseudocodes | 4–6 |
| 4. Reinforcing skills acquired during ROAR I | Assignment of problems to be solved from scratch by first formulating a mathematical model and then solving this by means of Solver | 4–6 |
| 5. Choosing or developing the right approach to solve a network problem | Authentic problems and a challenge as final project | 3–7 |
| 6. Collaborative skills | Work groups during the lectures, authentic problems, and a challenge as final project | 2–7 |
| 7. Public-speaking skills | Homework correction together and final presentations on the challenge | 2–7 |
| 8. Increasing awareness of OR applications in reality | ROAR in Action! seminars | – |
4.10. Interdisciplinary Connections
The ROAR in Action! seminars, presented in Section 4.4.3, offered the opportunity to explore transversal civic education issues, such as a fair distribution of resources and sustainable mobility. In addition, ROAR was proposed as a path for transversal skills and orientation (see Section 1). Thus, it contributed to developing some soft skills, such as the ability to effectively manage one’s own commitments by respecting schedules and deadlines, the ability to plan one’s activities with motivation and awareness, the ability to act autonomously accepting responsibility, and the ability to learn and work collaboratively with others by interacting in groups.
5. Results and Feedback
In this section, first, we report on the assessment of the group work on the final project. Then, we analyze the results and feedback from the two questionnaires students filled in. Finally, we provide some qualitative feedback on ROAR II received from other class teachers.
5.1. Results of the Group Work
At the end of the groups’ presentation on the final project, we evaluated the students’ acquisition of competencies according to the criteria described in Section 4.7. From Figure 3, which illustrates a box plot diagram for each assessed aspect, we can see how the students, on average, achieved high levels of competencies.
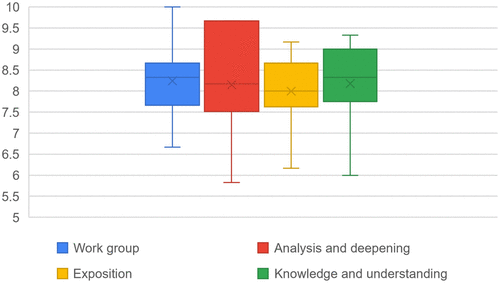
Note. The scale ranges from 1 (i.e., very poor) to 10 (i.e., excellent).
5.2. Feedback from Students
We administered two questionnaires to students: an initial questionnaire before the first lecture and a final one at the end of the unit. The former was filled out by 22 students, whereas the latter by 21 students. As mentioned before, we encouraged students to use the same anonymous nickname for both questionnaires. Thanks to these nicknames, we could identify the student who did not fill out the second questionnaire and discharge those answers so we could consistently compare the answers to both questionnaires.
Hereafter, first, we analyze the questions in the final questionnaire related to students’ preferences about topics and methodologies, Lecture 4 held at the University of Brescia, the ROAR in Action! seminars, and the final project. Then, we compare some questions from the initial and final questionnaires. To conclude this part, we include some final students’ considerations about the skills acquired through ROAR II.
5.2.1. Preferences on Topics and Methodologies.
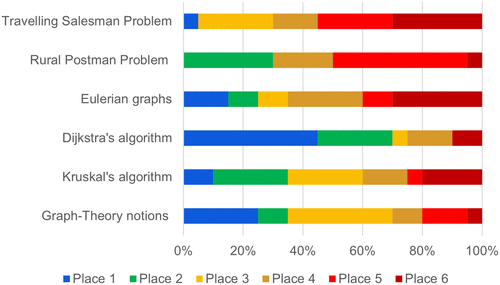
We asked students to sort the topics presented in ROAR II according to their preferences by placing their preferred topic in the first place (place 1) and their least liked topic in the last place (place 6). As shown in Figure 4, Dijkstra’s algorithm (including the mathematical model formulation of the shortest path problem) is the topic students liked the most. In particular, 45% of the students chose Dijkstra’s algorithm as their favorite, and 70% of them put it in first or second place. On the contrary, the traveling salesman problem was the topic students liked the least. Indeed, 30% of them put the traveling salesman problem in the last position and 55% of them in the last or penultimate position. Calculating the average of the positions in which these topics were put by students, we obtain 2.3 for Dijkstra’s algorithm, 2.95 for graph theory notions, 3.4 for Kruskal’s algorithm, 3.95 for both Eulerian graphs and the rural postman problem, and 4.45 for the traveling salesman problem.
In Figure 5, we also analyzed students’ responses about their understanding of the covered topics. According to students’ opinions, their favorite topic (Dijkstra’s algorithm) seems to be also the most understood. Nevertheless, we observe that 100% of the students affirmed they had understood (at all or in part) graph theory notions (i.e., representation of relationships, indirect and direct graphs, basic notions). Instead, about 43% of the students answered that they did not fully understand or understood little of the rural postman and the traveling salesman problems.
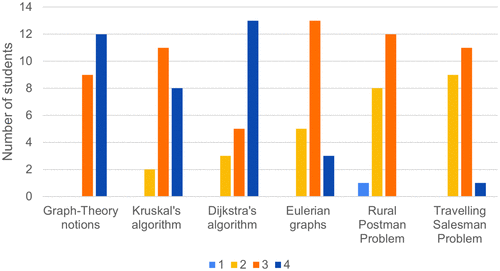
Note. The Likert scale used ranges from 1 (i.e., absolutely no) to 4 (i.e., absolutely yes).
Then, we analyzed the answers on students’ preferred teaching methods. As shown in Figure 6, the use of digital technologies is the most appreciated method. In particular, Kahoot! obtained the highest level of absolute preference and an average score of 3.75, and only one student did not at all like Kahoot! quizzes. Mentimeter gained the highest mean score of 3.8. Moreover, the group work during lectures and the collective discussions between experimenters and students were appreciated by 100% of the students. The least favorite teaching methods were the homework assignment and group work in extra school timewith a mean score of 2.4 and 2.8, respectively. In general, the appreciation of the teaching methods used also during ROAR I remained roughly constant (see Colajanni et al. 2022, section 5.2.1). The methods used for the first time in ROAR II (Kahoot!, lecture by an expert, challenge, seminar presentation) were quite or highly appreciated by more than 70% of the students.
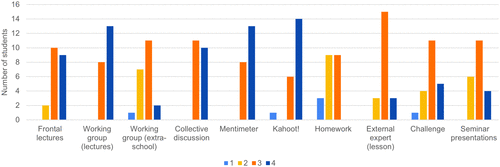
Note. The Likert scale used ranges from 1 (i.e., absolutely no) to 4 (i.e., absolutely yes).
5.2.2. Lecture 4: a One-Day Workshop at the University of Brescia.
About lecture 4 (see Section 4.8.4), we asked the students the following open question: what did this university experience leave you with? Their responses show that this was positive and pleasant, as “an experience which helped me understand what universities consist of” or “an opportunity to see what the university environment is like, where they do the lectures and the laboratories; in some ways, it also helped me to understand if this could be my path after high school or not.” One student understood that the engineering university might not be right for the student, but this is within the scope of awareness and orientation too. Not only the orientation activity was appreciated by the students but also the topics covered that day. Furthermore, students were asked whether they would repeat this experience. They all answered positively by writing that they learned new facets of mathematics, got an idea of university, and found this activity constructive and engaging.
Figure 7 shows how much students believe that the day at the University of Brescia served to guide them toward possible training courses of their interest. Whereas 57% of the students voted 3 (i.e., useful), the others’ votes were equally divided between 4 (i.e., a lot) and 2 (i.e., a few). No one considers this experience completely useless.
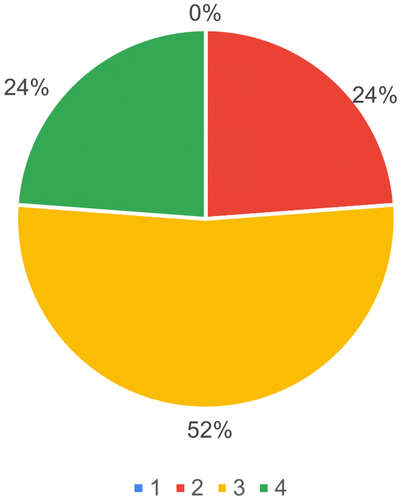
Note. The Likert scale used ranges from 1 (i.e., not at all) to 4 (i.e., a lot).
5.2.3. The ROAR in Action! Seminars.
As for the orientation seminars described in Section 4.4.3, we asked students to sort them by placing their most preferred seminar in the first place (place 1) and their least one in the last place (place 6). Figure 8 clearly shows that students’ favorite seminar was “Amazon Logistics: geospatial optimization of deliveries.” Indeed, 75% of the students ranked it in the first place, and 20% of them placed it in the second place. The seminar titled “Mathematics for a more sustainable future between renewable energy and transport” also obtained great appreciation from students. Indeed, 15% of the students and 50% of them placed it in first and second places, respectively. The Amazon Logistics seminar obtained an average score of 1.3, whereas the others got the following scores: sustainable future 2.6, maths and trains 3.55, world hunger 3.9, interlibrary loan service 4.75, and railway shunting 4.9.
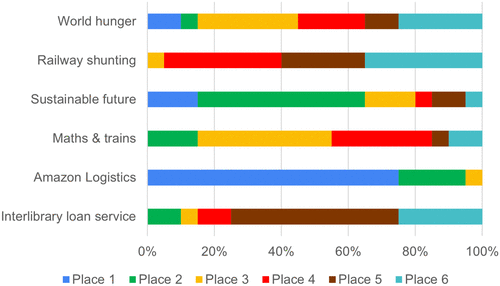
To the open question—having attended the series of seminars, which opportunities do you think it gave you?—many students answered that they had the chance to understand better how much mathematics and OR are present and useful “in innovative and engaging working realities.” Students seemed to be amazed to discover how OR can be applied to “everyday problems” but also to “more unpredictable areas, such as world hunger.”
To the question, “If you were offered the opportunity to participate in another series of seminars, do you think you would accept? Why?” students positively answered that they found them engaging. In particular, one student wrote, “I found them interesting, and I am curious in what other situations OR can be used.” However, not all of the students believe that these seminars were useful as orientation on possible training paths of interest to them (see Figure 9). Even if 38% of the students found the seminars very useful and 19% of them a lot useful, one student (5%) believed that these seminars were not useful at all, and 38% of the students found them a little useful. Thus, there is a distinction between the usefulness of seminars in promoting OR applications (in different working areas and real contexts) and their utility in helping students understand the paths they would like to pursue at the end of high school. Indeed, although some students found the seminars interesting, they also declared they are not going to continue studying applied mathematics.
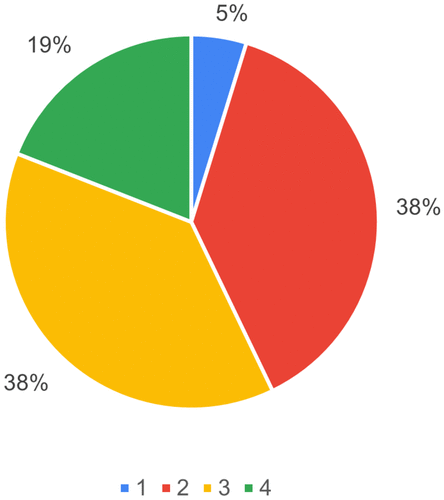
Note. The Likert scale used ranges from 1 (i.e., not at all) to 4 (i.e., a lot).
5.2.4. Group Work on the Final Project.
We asked the students to express their opinion on the following questions related to the final project of ROAR II (see Section 4.4.1): How challenging do you think the final project was? How much did you contribute to the achievement of a feasible/optimal solution for the demo instance? How much did you contribute to the achievement of a feasible/optimal solution for instance 1? How much did you contribute to the achievement of a feasible/optimal solution for instance 2? How useful was the feedback from the experimenters on the solutions to the instances you provided to continue with their resolution? How much checking the shared sheet (with the values of the objective functions obtained by the other groups on the instances) was perceived by your group as a stimulus to improve your solutions? How much did you perceive the climate of challenge among your group and other groups? We illustrate the responses of students in Figure 10, from which we can see that many students (about 71%) think the final group work was a lot challenging, and nobody (0%) thought it was not or a little challenging. On their single contribution to the resolution of the instances, we can see how they evaluated it as decreasing, whereas the difficulty of the instance increased. Indeed, for the demo instance (that is, the easiest), all students affirmed to have contributed to its resolution (about 33% a lot and 67% enough). As for instances 1 and 2, some students affirmed to have not contributed at all or very little. The feedback from the experimenters seemed to be very useful: about 52% of students affirmed that it was useful enough, whereas 33% of them found it a lot useful. The adoption of a shared sheet is very relevant. Indeed, according to 57% of the students, it represented an incentive to improve their solutions. Finally, the majority of students (about 67%) perceived the climate of challenge among groups (14% a lot, 52% enough).
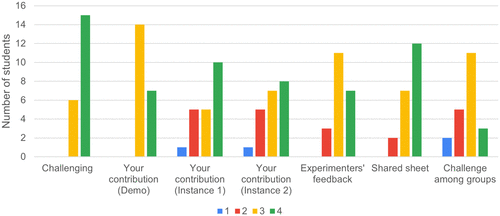
Note. The Likert scale used for each question ranges from 1 (i.e., not at all) to 4 (i.e., a lot).
5.2.5. Comparison Between the Initial and Final Questionnaires.
To evaluate a possible evolution in the impact of ROAR on students’ motivation and interest in mathematics, we asked a few questions in both the first and final questionnaires. Hereafter, we compare some of these questions. The Likert scale used in all these ranged from one (i.e., absolutely disagree) to four (i.e., absolutely agree).
Figure 11(a) shows the comparison of the responses to the statement “In my life, I will never use most of the subjects studied in mathematics.” The percentage of the students who absolutely disagreed with the statement increased from 10% to 19%. On the contrary, the students who agreed or absolutely agreed (i.e., three and four on the Likert scale used) decreased from 52% to 43%. Moreover, we underline that, in the initial questionnaire, the majority of students (52%) agreed or absolutely agreed with the statement, whereas in the final questionnaire, the majority of them (57%) disagreed or absolutely disagreed with the statement.
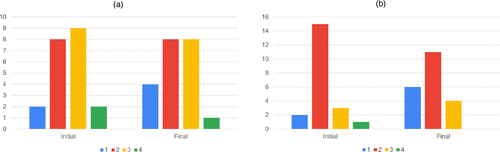
Notes. The Likert scale used ranges from 1 (i.e., absolutely disagree) to 4 (i.e., absolutely agree). (a) “In my life, I will never use most of the subjects studied in mathematics.” (b) “Math problems are very abstract and far-fetched.”
We also analyzed the students’ agreement with the statement “Math problems are very abstract and far-fetched” (see Figure 11(b)).
Despite the percentage of students who disagreed or absolutely disagreed (81%) and the percentage of students who agreed or absolutely agreed (19%) remaining unchanged between the first and second questionnaires, we note that the percentage of absolutely disagreed increased from 10% to 29%. In particular, students who initially absolutely agreed with the statement (5%) changed their opinion: 0% of students absolutely agreed with the statement at the end of the second unit. From this comparison, we can affirm that ROAR II helped students understand the importance of the use of mathematics in real situations.
5.2.6. Final Considerations.
To conclude this part dedicated to students’ feedback, we report on some final considerations captured by the second questionnaire. We asked each student to express how much the student believed to have acquired the following skills: knowing how to observe, identify, and describe relationships by using graph-theory notions (vertices, edges/arcs, indirect/direct graphs, connected graphs, subgraphs, paths, cycles, etc.; knowing how to formulate an integer linear programming mathematical model by starting from a textual description of a problem on graphs or from the graph itself; knowing how to solve some problems on graphs by using the presented algorithms and methods; knowing how to formulate a mathematical theorem through the analysis of a set of examples and counterexamples; knowing how to demonstrate a mathematical theorem through the analysis of a set of examples and counterexamples; knowing how to use information technology to write, analyze, and solve optimization problems on graphs; knowing how to evaluate the reliability and quality of the solutions obtained; knowing how to collaborate in a group in order to face and solve a challenging problem; and knowing how to publicly present the results obtained through a presentation.
From Figure 12, we can see how, for each one of the skills, students are believed to have acquired a good level, especially on collaborating in a group, to face and solve a challenging problem and on the use of graph-theory notions to observe, identify, and describe relationships. The skills in which students felt a little more lacking are formulating and proving mathematical theorems and the use of information technology to write, analyze, and solve optimization problems on graphs. This may be due to the little time spent on theorems (only a part of lecture 4) and on the use of information technology (which is instead the core part of ROAR III, the last teaching unit of ROAR).
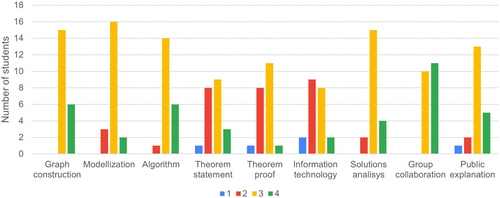
Note. The Likert scale used ranges from 1 (i.e., absolutely no) to 4 (i.e., absolutely yes).
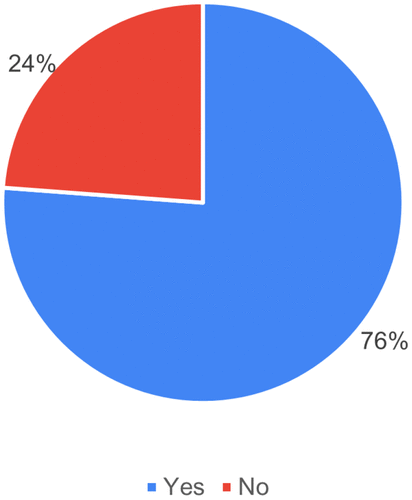
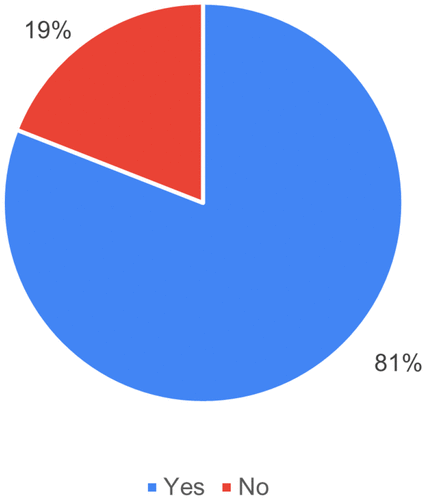
In conclusion, 76% of the students think that what they learned during ROAR II will be useful to them in the future (i.e., for their future academic course or job; see Figure 13). On the other hand, one of the students who answered negatively believes that the student is not going to use in the future what was learned because the path the student is going to pursue probably does not take OR into consideration. Furthermore, about 81% of the students believe that ROAR II changed or impacted their idea of mathematics (see Figure 14) because they have realized its several applications in real contexts (especially thanks to the seminars). One of the students wrote, “In the beginning, I did not think maths was also needed in real life.” Three of the four students who answered negatively motivated their answers by explaining that they already had this idea of mathematics. Indeed, they were already convinced that mathematics could solve many problems, such as those seen during the lectures.
5.3. Feedback from Teachers
The mathematics teacher confirms her positive opinion on ROAR declaring that it “strengthened students’ problem-solving skills. Both ROAR I and ROAR II provided the students the possibility to see mathematics in a different way.” Other teachers also gave positive feedback about the project. In particular, the English teacher said that “students were interested and involved in the activities thanks to a collaboration and sharing climate” and that “the experts had a value-enhancing attitude towards the work of all the students.” The Italian teacher appreciated the practice of starting the lectures with a structured and easy-to-propose test, which quickly and systematically recalls the notions previously explained, and the use of teamwork activities. Finally, the ICT teacher, who accompanied the students during the lecture at the University of Brescia, underlined that “it was quite helpful to the students not only because they were able to meet a few teachers of the faculty and visit some laboratories, but for the activities carried out.” In particular, she found the students positively engaged in the discovery activity presented in lecture 4 (see Section 4.8.4).
6. Conclusion and Further Work
With this paper, we continue the description of ROAR, a three-year didactic project addressed to higher secondary school students. The main aim of this project is to introduce OR, a branch of applied mathematics, to preuniversity-level students to make students understand the importance and usefulness of mathematics in real contexts.
In particular, we provide details of the second teaching unit of ROAR, carried out between January and April 2022 in a grade-11 class at IIS Antonietti in Iseo (Brescia, Italy). The main purpose of ROAR II was to introduce some graph-theory problems and a few algorithms to solve them. As in ROAR I, the unit was divided into several lectures alternating frontal teaching and group work. The new topics allowed students to strengthen their knowledge of modeling techniques, problem-solving abilities, and the use of digital technologies. ROAR II also exploited three new teaching paradigms, such as competitive learning, discovery learning, and seminar presentations. The first paradigm was applied in the final project, which asked for the resolution of a vehicle routing problem. Each group had to work on the same three instances of the problem, trying to find the best possible solutions using a heuristic method or another approach they would have preferred. The group that did a better job (in terms of the quality of the solutions and the final presentation) was awarded a symbolic prize. The second paradigm was the main methodology adopted to introduce the topic of Eulerian graphs, during a one-day workshop at the University of Brescia. The third paradigm was implemented in the ROAR in Action! series of seminars given by seven different experts.
Feedback received from both students and teachers was decidedly positive. In the self-assessment questions of the final questionnaire, on average, almost 80% of the students stated they had understood each presented topic quite or very well. The teaching methodologies used were generally appreciated. In particular, those introduced in ROAR II were quite or highly appreciated by more than 70% of the students. We also highlight that the students’ motivation was very strong. Indeed, during the breaks in the lectures, they often preferred to continue group work rather than have a break. During lecture 4 (the day at University of Brescia), after the lunch break, they returned eager to continue the activities. Finally, by comparing the answers to the initial and final questionnaires, it emerges how the covered topics helped students understand that mathematics is not so abstract and that it can play an important role in their life after the end of high school.
We are aware that the sample involved in the project is small, and the data are not statistically significant. Nevertheless, the ROAR I and ROAR II samples are composed of the same individuals as will be the sample for the third didactic unit. This allows us to evaluate the impact of the entire three-year project on the skills stimulated and acquired by the students.
As with the ROAR I material, all didactic material developed for the lectures has been made available in a public repository,3 now also accessible from the official ROAR project website (only in Italian).4 In this repository, those who wish to replicate part or all of the activities can find other ideas and materials to use in the classroom. We believe that the implementation of active learning and competitive learning is a key feature of ROAR II. Thus, we strongly suggest not overlooking it. Also, it is important to dedicate an appropriate amount of time to each activity. Anybody is free to adjust the duration and topics of each lecture according to the time available. We think two hours could be a reasonable duration for a lesson to include at least the presentation of one topic and one related group work. Finally, to further give an interdisciplinary character to the project, it would be relevant to involve other teachers, such as computer science or physics teachers.
As for future research, we are going to write a paper on the final project of this unit to evaluate the impact of competitive learning on the quality of the work done by the students. In that paper, we will also analyze the questions in the final questionnaire not discussed in this manuscript by deepening the feedback received on this second teaching unit. Moreover, the experimentation of the third and final unit of the project (i.e., ROAR III) started in the autumn of 2023 and finished in January 2023. ROAR III aimed to introduce the use of Python5 and of the PuLP library6 to solve mathematical programming problems. Similarly to what was done for ROAR I and ROAR II, we will report all details about the design, implementation, and results of this last unit in another paper.
We are grateful to Professor M. Picchi, her students, and the director of IIS Antonietti for their willingness to host the teaching experiment. Also, we sincerely thank Professor Lucio Zavanella, director of the mechanical and industrial engineering department of the University of Brescia, for the agreement with the IIS Antonietti, and Professor Renata Mansini for the welcome speech in lecture 4. Finally, thanks to Matteo Gardoncini for presenting the rural postman problem and to Veronica Asta, Fabio Bazzoli, Veronica Dal Sasso, Leonardo Drahorad, Martina Fischetti, Marco Gussago, and Anna Melchiori for holding the ROAR in Action! seminars.
1 The main Italian website for the dissemination of mathematics is https://maddmaths.simai.eu.
2 Here, we talk about efficiency according to students’ ideas on the rapidity of the algorithm, not in the sense of computational complexity, which we did not introduce to them.
5 See https://www.python.org.
References
- (2012) The effect of guided discovery on students’ physics achievement. Latin Amer. J. Phys. Ed. 6(4):530–537.Google Scholar
- (2018) Lesson study: An approach to increase the competency of out-of-field mathematics teacher in building the students conceptual understanding in learning mathematics. J. Ed. Sci. 2(2):1–13.Google Scholar
- (2006) Scaffolding practices that enhance mathematics learning. J. Math. Teaching Ed. 9(1):33–52.Crossref, Google Scholar
- (1986) Fondements et méthodes de la didactique des mathématiques. Recherchers en Didactique des Mathématiques 7(2):33–115.Google Scholar
- (1997) On Knowing Essays for the Left Hand: United States of Amerika (University Press).Google Scholar
- (1990) Cooperative learning in the home economics classroom. J. Home Econom. 82(4):31–41.Google Scholar
- (2003) Dijkstra’s shortest path algorithm. J. Formalized Math. 15(9):237–247.Google Scholar
- (1994) Restructuring the classroom: Condition for productive small groups. Rev. Ed. Res. 64(1):1–35.Crossref, Google Scholar
- (2023) An operations research–based teaching unit for grade 10: The ROAR experience, part I. INFORMS Trans. Ed. 23(2):104–120.Link, Google Scholar
- (1954) Solution of a large-scale traveling-salesman problem. J. Oper. Res. Soc. Amer. 2(4):393–410.Link, Google Scholar
- (1949) A theory of cooperation and competition. Human Relations 2(2):129–152.Crossref, Google Scholar
- (1997) Incorporating student peer review and feedback into the assessment process. Best Assessment Processes Engrg. Ed. Working Sympos.Google Scholar
- (1995) Arc routing problems, part II: The rural postman problem. Oper. Res. 43(3):399–414.Link, Google Scholar
- (2021) Technologies and laboratorial activities for a robust understanding approach: From closed to open laboratories. Yang W, Meade DB, Majewski M, eds. Electronic Proc. 26th Asian Tech. Conf. Math., 82–96.Google Scholar
GeoGebra (2021) Free mathematics software for learning and teaching. http://www.geogebra.org/.Google Scholar- (2013) Studying the effect of guided discovery learning on reinforcing the creative thinking of six grade girls students in QOM during 2012-2013 academic year. J. Appl. Sci. Agriculture 8(5):576–584.Google Scholar
- (2019) Effectiveness of learning with scientific approach in cooperative model of STAD-based type lesson study. J. Ed. Sci. 3(2):249–259.Google Scholar
- (1985) On the history of the minimum spanning tree problem. Ann. History .Comput. 7(1):43–57.Crossref, Google Scholar
- (1992) The role of the classroom teacher as a curriculum leader. NASSP Bull. 76(547):11–19.Crossref, Google Scholar
- (1986) Circle of Learning: Cooperation in the Classroom (Interaction Book Company, Edina, MN).Google Scholar
Kahoot! (2022) Game-based learning platform. Accessed August 1, 2022, https://kahoot.com.Google Scholar- (2017) The effect of discovery learning model on student’s critical thinking and cognitive ability in junior high school. IOSR J. Res. Method Ed. 7(6):1–8.Google Scholar
Mentimeter (2021) Interactive presentation software. Accessed August 1, 2022, https://www.mentimeter.com.Google ScholarMicrosoft Corporation (2019) Microsoft Excel. Accessed August 1, 2022, https://office.microsoft.com/excel.Google ScholarMinistero dell’Istruzione, Università e della Ricerca (2018) Percorsi per le Competenze Trasversali e l’Orientamento – Linee guida. Accessed September 27, 2021, https://www.miur.gov.it/documents/20182/1306025/Linee+guida+PCTO+con+allegati.pdf/3e6b5514-c5e4-71de-8103-30250f17134a?version=1.0&t=1570548388496.Google Scholar- (2020) Development of learning tools with the discovery learning model to improve the critical thinking ability of mathematics. J. Ed. Sci. 4(1):83–92.Google Scholar
- Raffaele A (2022a) ROAR IN AZIONE 1) Il prestito interbibliotecario come problema di routing. MaddMaths. Accessed August 2, 2022, https://maddmaths.simai.eu/divulgazione/roar-in-azione-prestito-interbibliotecario-problema-routing/.Google Scholar
- Raffaele A (2022b) ROAR IN AZIONE 2) Amazon logistics e i facility location problem. MaddMaths. Accessed August 2, 2022, https://maddmaths.simai.eu/divulgazione/roar-in-azione-amazon-logistics-facility-location-problem.Google Scholar
- Raffaele A (2022c) ROAR IN AZIONE 3) Come la matematica fa funzionare meglio i treni. MaddMaths. Accessed August 2, 2022, https://maddmaths.simai.eu/divulgazione/roar-in-azione-matematica-fa-funzionare-meglio-treni/.Google Scholar
- Raffaele A (2022d) ROAR IN AZIONE 4) La matematica per un futuro più sostenibile. MaddMaths. Accessed August 2, 2022, https://maddmaths.simai.eu/divulgazione/roar-in-azione-matematica-per-futuro-piu-sostenibile/.Google Scholar
- Raffaele A (2022e) ROAR IN AZIONE 5) Ottimizzazione di operazioni ferroviarie in area portuale. MaddMaths. Accessed August 2, 2022, https://maddmaths.simai.eu/divulgazione/roar-in-azione-ottimizzazione-operazioni-ferroviarie-area-portuale/.Google Scholar
- Raffaele A (2022f) ROAR IN AZIONE 6) Combattere la fame nel mondo con l’ottimizzazione. MaddMaths. Accessed August 2, 2022, https://maddmaths.simai.eu/divulgazione/roar-in-azione-combattere-fame-mondo-ottimizzazione/.Google Scholar
- (2021) Teaching operations research before university: A focus on grades 9–12. Oper. Res. Forum 2(1):13.Crossref, Google Scholar
Research in Action (2021) Quattro passi in centro. Grafi – Cammini – Percorsi. Accessed August 1, 2022, http://researchinaction.it/wp-content/uploads/2019/02/06-Quattro-passi-in-centro.pdf.Google Scholar- (2022) Fostering students’ modelling and problem-solving skills through operations research, digital technologies and collaborative learning. Internat. J. Math. Ed. Sci. Tech. 55(8):1957–1998.Crossref, Google Scholar
- (2008) The benefits of mathematics competitions. Alabama J. Math. 33:59–63.Google Scholar
- (2015) The wear out effect of a game-based student response system. Comput. Ed. 82:217–227.Crossref, Google Scholar
- (2020) The effect of using Kahoot! for learning—A literature review. Comput. Ed. 149:103818.Crossref, Google Scholar

