Distributionally Robust Observable Strategic Queues
Abstract
This paper presents an extension of Naor’s analysis on the join-or-balk problem in observable M/M/1 queues. Although all other Markovian assumptions still hold, we explore this problem assuming uncertain arrival rates under the distributionally robust settings. We first study the problem with the classical moment ambiguity set, where the support, mean, and mean-absolute deviation of the underlying distribution are known. Next, we extend the model to the data-driven setting, where decision makers only have access to a finite set of samples. We develop three optimal joining threshold strategies from the perspectives of an individual customer, a social optimizer, and a revenue maximizer such that their respective worst-case expected benefit rates are maximized. Finally, we compare our findings with Naor’s original results and the traditional sample average approximation scheme.
Funding: This research was supported by the National Science Foundation [Grants 2342505 and 2343869].
1. Introduction
Imposing tolls to regulate queueing systems was first studied by Naor (1969). He considers a single-server first come, first served (FCFS) queue with stationary Poisson arrivals at a known rate λ. Service times are independent and identically and exponentially distributed with the rate μ. Customers are assumed to be risk neutral and homogenous from an economic perspective. Each customer receives a reward of upon service completion and incurs a cost of per unit of time spent in the system (including in service). In the observable model, every arriving customer inspects the queue length and decides whether to join (reneging is not allowed) or balk (i.e., not join the queue). This strategic decision making is the key factor differentiating this model from the classic M/M/1 queueing model.
Naor (1969) derives an optimal threshold strategy n. The customer joins the queue if and only if the system length is less than n. He computes this threshold value under three different control strategies: (1) individual optimization (ne) where the customers act in isolation, aiming to maximize their own expected net benefit rate; (2) social optimization (ns) where the objective is to maximize the long-run rate at which customers accrue net benefit; and (3) revenue maximization (nr) where the agency imposes a toll on the customers joining the queue with the goal of maximizing its own revenue. The most important result by Naor (1969) is the relation , which implies that the customers tend to join the system at a higher rate when left to themselves than is socially optimal. This is because customers do not consider the negative externalities they impose on customers who arrive later. The result also implies that the revenue-maximizing firms allow fewer customers to join their system than the socially optimal case.
Many authors have expanded on the seminal work by Naor (1969); a detailed review of these game-theoretic models is presented in a recent book by Hassin and Haviv (2003). Some of the other recent works (Burnetas and Economou 2007, Economou and Kanta 2008, Guo and Hassin 2011) involve deriving threshold strategies in a classic Naor setting with server shutdowns. Although Economou and Kanta (2008) study the system with server breakdowns and repairs, Burnetas and Economou (2007) analyze the system where the server shuts off when idle and incurs a setup time to resume. A slight variant of this model is given by Guo and Hassin (2011), where the server resumes only when the queue length exceeds a given critical length. Also, Guo and Zipkin (2007) explore the effects of three different levels of delay information and identify the specific cases that do and do not require such information to improve the performance. Haviv and Oz (2016) review the properties of several existing regulation schemes and devise a new mechanism where customers are given priority based on the queue length. Afèche and Ata (2013) study the observable M/M/1 queue with heterogenous customers, with some patient and some impatient of given proportions.
All the aforementioned works explore the Naor (1969) model by assuming deterministic arrival or service rates. However, in many real-world scenarios, customers may behave differently during different periods. Hence, there is merit in building a model that performs well under uncertainty. A possible approach is to consider distributional uncertainty on the customers’ interarrival times (Bandi et al. 2015). Unfortunately, such granular data are usually inaccessible or simply not stored in practice. In addition, even if the granular data are collected, the problem is still theoretically challenging as the M/M/1 structure no longer holds. In this case, calculating the long-run expected social benefit or revenue rates would be difficult, and there is no such study in the context of strategic queues. To avoid these shortcomings, some recent studies propose to address uncertainty by taking the arrival or service rate as a random variable (Liu and Hasenbein 2019, Hassin et al. 2023). For example, they assume that the customer arrival rate is a random variable for each weekday, and the queue manager seeks a strategy that maximizes the long-run social benefits or revenue. This modeling assumption is an expedient approach to account for customer arrival variation while considering the issues of data accessibility and model complexity. Compared with granular data, historical arrival rates are much easier to obtain; most restaurants can collect the historical daily arrival rates by referring to the recorded sales quantity in their accounting books, but only a tiny portion of restaurants keep records of the exact arrival time of each customer. In addition, by assuming that the arrival rate is a fixed random variable within each time slot, the model preserves the M/M/1 structure, which enables the use of many elegant results from the paper of Naor (1969).
Papers with related assumptions as in our model include Debo and Veeraraghavan (2014), who consider a system where the arriving customers cannot completely observe the service rate and value. They assume that the server belongs to one of two known types and that the service rate and prior probability for each type are known. Liu and Hasenbein (2019) study a stochastic extension of the Naor (1969) model by relaxing the assumption of a certain arrival rate. They assume that the arrival rate is drawn from a probability distribution that is known to the decision maker. Chen and Hasenbein (2020) further extend the stochastic model to the unobservable setting. They show that the social optimizer induces a lower expected arrival rate than the revenue maximizer in this setting. Hassin et al. (2023) also investigate the unobservable stochastic model from the perspective of strategic customers and demonstrate that the model exhibits a rate-biased arrivals see time averages property. Despite their conceptual appeal, all these works require that the arrival or service rate distribution is known precisely to decision makers, which may not be realistic in practice. In this paper, we extend the classical Naor model for observable systems by relaxing these assumptions, where we assume the arrival rate is uncertain and governed by an unknown underlying distribution, whereas the service rate is deterministic.
To this end, we consider an alternate modeling paradigm called the distributionally robust optimization (DRO) (Scarf 1957, Žáčková 1966, Shapiro and Kleywegt 2002). Unlike the traditional stochastic optimization model, DRO acknowledges the lack of full distributional information on the random arrival rate. Instead, the decision maker is assumed to have access to partial information, such as the moments and structural properties of the arrival rate distribution, or some limited historical observations. In this setting, the objective is to derive optimal threshold strategies that maximize the worst-case expected benefit rate, where the worst case is taken over an ambiguity set of all distributions consistent with the available information about the true distribution. Such max-min problems have been studied since the seminal work by Scarf (1957), but they have only received more attention with the advent of modern robust optimization techniques (Bertsimas and Sim 2004, Ben-Tal et al. 2009). Since then, a substantial body of literature has been devoted to studying well-known optimization problems under uncertainty in a distributionally robust setting; see Delage and Ye (2010), Li et al. (2014), Wiesemann et al. (2014), Hanasusanto et al. (2015), Shafieezadeh-Abadeh et al. (2015), and Ardestani-Jaafari and Delage (2021). Nevertheless, the distributionally robust framework has not been considered in the context of the classical Naor observable strategic queue model. The paper fills this gap in the literature.
We first study the distributionally robust queue model with a mean-absolute deviation (MAD) ambiguity set (Postek et al. 2018), where partial information about the distribution mean and MAD are known. Next, we extend our model to the data-driven setting, where queue system managers only have access to a finite number of independent and identically distributed training samples collected from historical observations. We construct a data-driven mean-absolute deviation (DD-MAD) ambiguity set that mitigates estimation errors from the empirical moment estimators. The resulting distributionally robust model with a data-driven ambiguity set admits a semidefinite programming (SDP) reformulation for the social optimization problem and a linear programming reformulation for the revenue maximization problem. To properly determine the robustness parameters, we establish a new distribution-free confidence interval for the empirical MAD. Although such confidence intervals exist for the empirical mean and variance (Delage and Ye 2010), to the best of our knowledge, none are available for the empirical MAD. Herrey (1965) derives the confidence interval for the empirical MAD under normal distribution data, whereas other works mostly focus on median-absolute deviation; see Bonett and Seier (2003), Abu-Shawiesh et al. (2018), and Arachchige and Prendergast (2019). Using this result, we further derive finite-sample guarantees for the data-driven MAD model, in which optimal values provide high-confidence lower bounds on the expected social benefit or revenue rate. We also benchmark our data-driven MAD ambiguity set with the popular Wasserstein ambiguity set (Pflug and Wozabal 2007, Esfahani and Kuhn 2018, Esfahani et al. 2018, Gao and Kleywegt 2023), which is widely used in the data-driven setting as it can offer attractive finite-sample guarantees. The results demonstrate that our proposed data-driven MAD model shares a similar guarantee as the Wasserstein model while generating a significantly more tractable reformulation.
The main contributions of this paper can be summarized as follows.
We propose a new model to tackle the uncertain arrival rate in the Naor strategic queue problem using the emerging DRO framework. The model does not impose any specific distributional assumption; instead, it optimizes in view of the worst-case distribution within a prescribed ambiguity set. Benefitting from this robustification framework, the model alleviates the overfitting issue and yields attractive out-of-sample performance.
We prove that the revenue rate function is concave, whereas the social benefit rate function is either concave or unimodal under some mild prerequisites. We then show that these properties enable a closed-form solution for the worst-case expectation problem with an MAD ambiguity set. For the general cases, we derive an SDP reformulation for the social optimization problem and a linear programming reformulation for the revenue optimization problem.
We extend the distributionally robust model to the data-driven setting, where queue system managers only have access to a finite set of historical observations. To mitigate the adverse effect of the estimation errors from the empirical MAD, we robustify the ambiguity set by adding an extra layer of robustness to the empirical mean and MAD estimators. The data-driven MAD model admits an SDP reformulation for the social optimization problem and a linear programming reformulation for the revenue maximization problem. We then establish a distribution-free confidence interval for the empirical MAD and derive finite-sample guarantees for the distributionally robust model with a data-driven MAD ambiguity set. Compared with the Wasserstein ambiguity set, the data-driven MAD ambiguity set admits a more efficient reformulation of fixed complexity, where the number of constraints does not scale with the sample size.
The remainder of the paper is structured as follows. In Section 2, we propose the distributionally robust queue model and analyze the relationship between different thresholds under the distributionally robust setting. Section 3 presents tractable reformulations for the worst-case expectation problem with a classical MAD ambiguity set. Section 4 explores the distributionally robust model with a data-driven MAD ambiguity set and derives theoretical finite-sample guarantees. Finally, the out-of-sample performances of our distributionally robust models are assessed empirically in Section 5.
1.1. Notations
The set of all probability measures supported on Ξ is written as , where denotes the set of nonnegative Borel measures. All random variables are designated by tilde signs (e.g., ), whereas their realizations are denoted without tildes (e.g., ρ). We denote by the expectation of a cost function with respect to the random variable under distribution . We define to be the largest integer less than or equal to n and to be the p-norm of a vector . For any set Ξ, we let denote its interior. The cone of k × k positive semidefinite matrices is denoted by .
2. Distributionally Robust Strategic Queues Model
The extension of the Naor (1969) seminal queue model to the stochastic optimization setting with an uncertain arrival rate was first proposed by Liu and Hasenbein (2019), who consider an M/M/1 queue system with a random arrival rate and a deterministic service rate μ. The queue system operates under a first come, first served discipline, and the true distribution of the uncertain arrival rate is known by the system manager. Because the service rate μ is deterministic, without loss of generality, we consider the traffic intensity as the uncertain parameter throughout the remainder of the paper. The stochastic model aims to find an optimal threshold that maximizes the expected benefit rate: that is,
Here, is a general return function, which can be replaced with the social benefit rate function or the revenue rate function depending on the system manager’s objective.
In practice, the true distribution is never available to the system manager and typically has to be estimated using the empirical distribution generated from the historical observations. Although the empirical-based methods may work well on the observed data set, they often fail to achieve an acceptable out-of-sample performance because they do not consider any possible disturbances from the limited historical observations.
In this paper, we endeavor to address this fundamental shortcoming using ideas of DRO. The DRO approach does not impose any single distribution on the uncertain arrival rate. Instead, it constructs an ambiguity set containing all plausible probability distributions that are consistent with the partial information as well as historical observations. In this setting, the objective is to derive an optimal threshold strategy that maximizes the worst-case expected benefit rate, where the worst case is taken over all distributions from within this ambiguity set: that is,
Because the model optimizes the expected benefit rate in view of the worst-case distribution, it mitigates overfitting to the observed samples and helps improve the performance in out-of-sample circumstances.
In this paper, we study the distributionally robust model from the perspective of an individual customer, a social optimizer, and a revenue maximizer. We first derive the results that hold for any generic ambiguity set .
2.1. Individual Optimization
We determine a pure threshold strategy in which each arriving customer decides to join or not join the queue based on the observed queue length, independent of the strategy adopted by other customers. A newly arrived customer makes a decision (to join or not join) based on the net gain , where i is the number of people currently in the queue, and will join the queue if it is nonnegative. Note that net gain is deterministic because it is independent of the random arrival rate. Thus, the optimal joining threshold for any arriving customer is given by
This result coincides with the original result of Naor (1969) (i.e., ) because the net gain of a newly arrived customer only depends on the current queue length and the service rate, which are all deterministic. On the other hand, as an individual optimizer, the customer can ignore the rates of future arrivals because they will not affect the time to service.
2.2. Social Optimization
We next analyze the distributionally robust threshold for a social optimizer. The social benefit rate for a realization of the traffic intensity ρ and a fixed threshold n is given by
One can verify that , which indicates that the function is continuous in ρ. The distributionally robust model determines an optimal threshold that maximizes the worst-case expected social benefit rate : that is, , where
We first investigate the relationship between the optimal thresholds and .
There exists an optimal threshold of the social optimizer less than or equal to the optimal threshold of an individual customer: that is,
Proposition 1 enables decision makers to search for the best threshold from . We remark that the participation of customers is not affected by the distributionally robust setting because the queue adopts the FCFS discipline, so subsequent arrivals are immaterial after the customer has joined the queue. Thus, the socially optimal threshold is always achievable by reducing the individual threshold from ne to .
2.3. Revenue Optimization
We now consider a profit-maximizing firm that aims to maximize its expected revenue rate by imposing a toll t on every joining customer. In this setting, customers base their joining decision on this imposed toll t and evaluate the service completion only by R − t. Recall that customers join the queue if and only if the expected net gain is nonnegative. Therefore, determining an optimal toll t is equivalent to choosing a queue-length threshold n that maximizes the expected revenue rate, where
The revenue rate for a realization of the traffic intensity and a fixed threshold n is given by
One can show that , which indicates that is continuous. The distributionally robust model determines an optimal threshold that maximizes the worst-case expected revenue rate : that is, , where
Similarly, we first investigate the relationship between the optimal thresholds and .
There exists an optimal threshold of the revenue maximizer less than or equal to the optimal threshold of an individual customer: that is,
So far, we have presented the generic distributionally robust observable queue models for an individual customer, a social optimizer, and a revenue maximizer. However, we have not specified the ambiguity set for the social and revenue optimization problems. In the following sections, we will investigate different types of ambiguity sets and derive their tractable reformulations.
3. Distributionally Robust Strategic Queues with an MAD Ambiguity Set
We study the DRO model with an MAD ambiguity set. Suppose the support , mean m, and MAD d of the random parameter are known to the decision makers. Then, we can construct an ambiguity set containing all possible distributions that are consistent with the partial information, defined as
We develop efficient solution schemes to find the optimal threshold strategies for a social optimizer and a revenue maximizer, given by and , respectively, such that the worst-case expected benefit rates are maximized. In order to derive tractable reformulations for the distributionally robust models, we assume and , where is the largest possible mean-absolute deviation attained by any distribution with the given support and mean.
3.1. Social Optimization
To determine an optimal joining threshold for a social optimizer, we compute the worst-case expected social benefit rate for every satisfying and choose an such that . To this end, we show how to compute the worst-case expected social benefit rate for a fixed n. Suppose the distribution mean and MAD of are precisely known; then, the worst-case expected social benefit rate is given by the optimal value of the moment problem
The semi-infinite linear optimization Problem (8) is hard to solve because it searches for the best decision from an infinite-dimensional space of probability measures. To derive a tractable reformulation, we focus on the dual problem. We first define and derive the dual problem as
Notice that is a two-piece piecewise affine function majorized by . We know that if is a piecewise affine function or a concave function, the semi-infinite constraint will reduce to a linear constraint because we only need to check the satisfaction of the constraint at points , and b. However, the social benefit rate function is neither concave nor piecewise affine, making the problem difficult. To solve this optimization problem, we first investigate the properties of the social benefit rate function . For clarity of exposition, we relegate some of the proofs to Appendix B.
The social benefit rate function has the following properties if .
is strictly concave for .
is either concave increasing or unimodal for .
The sign of the second derivative changes at most once over .
From Lemma 1, we know that the social benefit rate function has some appealing properties. Specifically, the function is either concave increasing or unimodal on the nonnegative axis, and when it is unimodal, the function changes from a concave function to a convex function at some point. The next lemma further asserts that the complementary slackness property holds for the primal and dual problems, which will later help us determine the worst-case distribution.
The optimal values of the primal-dual pair (8) and (9) coincide, and their optimal solutions and , respectively, satisfy the complementary slackness condition
The proofs of the lemmas are relegated to Appendix B. Combining Lemmas 1 and 2, we are ready to show that Problem (8) can be solved analytically under certain conditions. Specifically, we divide this problem into three cases and derive an explicit expression of the worst-case distribution for each case.
Assume and . Let be the tangent point on fn for the line that passes through . For any , we have one of the following three cases.
If , then the extremal distribution that solves (4) is a three-point distribution supported on , with corresponding probabilities
If and , then the extremal distribution is a three-point distribution supported on , with probabilities
If and , then the extremal distribution is a two-point distribution supported on , with probabilities
Figure 1 depicts the optimal two-piece piecewise affine function described in Proposition 3. We remark that the tangent point in Figure 1(b) can be determined efficiently by the bisection method. Specifically, we set as the initial search interval for the algorithm. In each iteration, we compute the derivative at the midpoint , and we check whether it is the tangent point by calculating the difference between and . If the difference is small enough, we terminate the algorithm; otherwise, we set if the difference is positive or set if the difference is negative, and then, we go back to the first step with the updated interval .
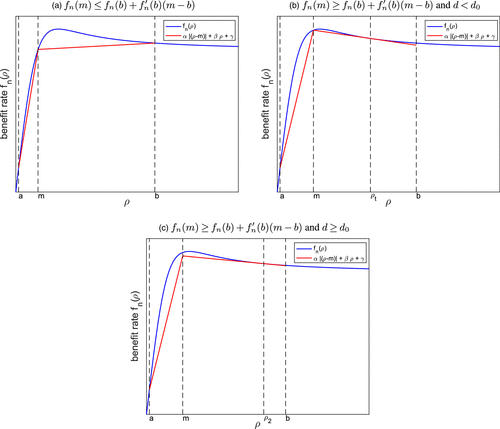
Notes. In panel (a), the optimal piecewise affine function is determined by points (a, fn(a)), (m, fn(m)), and (b, fn(b)). In panel (b), the parameters satisfy and . Thus, the optimal two-piece piecewise affine function touches at , and , where is the tangent point. In panel (c), still holds, whereas . In this case, the extremal distribution degenerates to a two-point distribution. (a) . (b) and . (c) and .
We remark that the use of the MAD ambiguity set and its geometric interpretation is motivated by a recent work by van Eekelen et al. (2022), who analyze the worst-case performance of the GI/G/1 queue (Bhat 2008) under mean-dispersion constraints. The authors demonstrate that measuring the dispersion by MAD, instead of variance, significantly simplifies the analysis and enables a closed-form solution for the extremal distribution whenever the loss function is convex. Unfortunately, our problem is different as the social benefit rate function is neither convex nor concave. Nevertheless, by establishing some useful properties of the social benefit rate function and exploiting its geometric interpretation in the dual Problem (9), we are able to explicitly express the extremal distribution when and . Using this result, we can compute the worst-case expected social benefit rate efficiently.
Assume and . Let be the tangent point on for the line that passes through . For any , we have the following three cases.
If , then
If and , then
If and , then
Theorem 1 enables us to solve the worst-case expectation problem analytically under certain conditions. However, for the more general case, we are unable to solve it in a closed form. In the following theorem, we show that the worst-case expectation problem admits a semidefinite programming reformulation that can be solved in polynomial time using standard off-the-shelf solvers, such as SDPT3 (Toh et al. 1999) and MOSEK (ApS 2022).
For any , the worst-case expected social benefit rate coincides with the optimal value of the following semidefinite program:
The proof of this theorem relies on the following lemma, which expresses a univariate polynomial inequality in terms of semidefinite constraints.
(
Recall that the dual of for supported on the interval is given by (see Problem (9))
We can deal with the semi-infinite constraint separately for the cases and :
Substituting the definition of in (3) and applying algebraic reductions yield the following polynomial inequalities:
The inequalities are of the form for and for , where and represent the coefficients of the respective polynomial inequalities. We now invoke the result of Lemma 3 with to express the inequalities in (11) as semidefinite constraints. The resulting semidefinite problem is equivalent to the original problem, which completes the proof. □
In this subsection, we present two results. Theorem 1 provides a closed-form solution under certain prerequisites, whereas Theorem 2 derives an SDP reformulation for the general cases. It is worth noting that Theorem 1 requires the parameters to satisfy . By Proposition 1, there exists an optimal threshold less than or equal to (i.e., ). Thus, for a strategic queue with mean arrival rate , Theorem 1 can be applied to compute the worst-case expected social benefit rate for the first cases. This greatly speeds up the time to solve (4) because we only need to solve an SDP once for the remaining case . On the other hand, for a strategic queue with mean arrival rate m > 1, we cannot invoke Theorem 1 anymore, and we need to solve an SDP for each n satisfying .
3.2. Revenue Optimization
To determine an optimal joining threshold for a revenue maximizer, we compute the worst-case expected revenue rate for every , and we choose an such that . To this end, we show how to compute the worst-case expected revenue for each n. Suppose the mean and MAD of the random parameter are known; then, the worst-case expected revenue rate is given by the following optimization problem:
To derive a tractable reformulation, we first investigate the property of the revenue rate function .
The revenue rate function is concave for .
Equipped with Lemma 4, we now show that the worst-case expectation Problem (12) admits a closed-form solution.
For any , the worst-case expected revenue rate can be derived as
To prove this theorem, we invoke a classical result that characterizes the worst-case distribution from the MAD ambiguity set for a concave loss function.
(
From Lemma 4, the revenue rate function is concave. Therefore, applying Lemma 5 yields the result. □
Theorem 3 provides practical managerial insight for the decision maker. Observe that the extremal distribution is usually a discrete distribution supported on the mean and the lower and upper bounds of the support. Hence, instead of optimizing over the empirical distribution, the DRO scheme simplifies the problem into three cases: when the traffic intensity is extremely small (), extremely large (), or as expected (). The weight for each scenario is determined by the MAD, which reflects the variation level of samples. This result aligns well with human intuition. To design a robust queue-regulating strategy, the decision maker may intuitively think about “how the queue behaves when the traffic intensity is extremely large, small, or as usual” and “what is the probability of these scenarios happening.” The closed-form solution provides an answer to these questions. For example, the quantities answer the question “What are the probabilities of these scenarios happening?,” whereas the quantities answer the question “How does the queue behave when the traffic intensity is extremely large, small, or as expected?”
4. Extension to Data-Driven Problems
In this section, we apply the MAD ambiguity set to data-driven optimization problems. As we observed in the previous section, distributionally robust models with a moment ambiguity set necessitate decision makers to have access to exact values of the mean m or MAD d of the true unknown distribution, which may not be realistic in practice. A common approach is to construct such moment ambiguity sets by plugging in the point estimators generated from the historical samples. However, it is rarely the case that one can be entirely confident in these empirical estimators. For example, when the sample size is small, these empirical estimators might be far away from the true values; furthermore, some estimators, such as the empirical MAD, are even biased. In order to mitigate the adverse effects of the estimation errors, we design a data-driven MAD ambiguity set that contains the true underlying distribution with high confidence.
Unlike the setting in the previous section, here we assume that the queue system manager only has access to N independent and identically distributed samples of the traffic intensity given by , where . In addition, we assume that decision makers have some prior knowledge or an educated estimate of the distribution support. Suppose the true mean and MAD of the underlying distribution are unknown and with high probabilities, belong to two confidence intervals and constructed using the samples. Then, the proposed data-driven distributionally robust model is formulated as
One can verify that the results of Propositions 1 and 2 still hold, and we can obtain the optimal value of (14) by solving for each satisfying and select the one with the largest objective value.
We now derive the reformulations for the worst-case expected social benefit and revenue rates. To this end, we define the worst-case expected social benefit rate with the data-driven MAD ambiguity set by
The next theorem presents the reformulation of the worst-case expected social benefit rate. Some of the proofs of the results in this section are relegated to Appendix C.
For any , the worst-case expected social benefit rate coincides with the optimal value of the following semidefinite program:
Note that when dl = du and ml = mu, setting and recovers the dual Problem (9) in the view of the primitive MAD ambiguity set, which corresponds to the case when we have absolute trust on the mean and MAD estimators.
The next theorem presents the reformulation of the worst-case expected revenue rate.
For any , the worst-case expected revenue rate is equal to the optimal value of the following linear problem:
Theorems 4 and 5 provide tractable reformulations for the social and revenue optimization problems. An advantage of the proposed data-driven model is that it can offer attractive finite-sample guarantees. Compared with the original MAD ambiguity set that imposes unique mean and MAD, the data-driven MAD ambiguity set allows these parameters to vary within the confidence intervals. In this way, we can assure that the set contains the true underlying distribution with a high probability, which immediately generates out-of-sample performance guarantees for the solution.
Let be a set of N samples generated independently at random from and denote the optimal value of (14). Define and as the empirical mean and MAD obtained from samples . By setting
The error of the empirical MAD estimate is given by
We upper bound both terms inside the max operator. The first term is bounded by
Because both of these two terms have the same upper bound, we have
As is an unbiased estimator, we can invoke the Hoeffding inequality to directly derive a confidence interval for the second term. However, the empirical MAD is biased (i.e., ), making the Hoeffding inequality not applicable. To derive a confidence interval for this term, we rewrite it as
We further upper bound the two terms inside the max operator. For the first term, we have
For the second term, applying the reverse triangle inequality yields
Thus, we have
Because both of these two terms are unbiased, we can apply the Hoeffding inequality and obtain
By applying the union bound and setting , we arrive at the desired confidence intervals that the true mean m and MAD d satisfy
The theorem establishes that with judicious choices of the confidence interval lengths, the optimal value of the data-driven DRO model provides a high-confidence lower bound on the expected benefit rate of the robust solution under the true underlying distribution .
An avid reader may be interested in employing the popular Wasserstein DRO model in the data-driven setting. Indeed, the model has been widely adopted because it can generate asymptotically consistent solutions and offer similarly attractive finite-sample guarantees. Unfortunately, the reformulation of this data-driven DRO model involves semidefinite constraints, which make the problem computationally intensive. For readers who are interested in the use of the Wasserstein ambiguity set, we provide a detailed discussion in Appendix B.
5. Numerical Experiments
In this section, we present the numerical experiments and examine the performance of different DRO policies. All optimization problems are implemented in MATLAB and solved by SDPT3 (Toh et al. 1999) via the YALMIP interface (Lofberg 2004). The experiments are run on a 2.2-GHz Intel Core i7 CPU laptop with 8 GB RAM.
We assess the out-of-sample performance of the data-driven policies for a social optimizer and a revenue maximizer through a fair out-of-sample experiment. We assume we have access to N independent samples of the traffic intensity drawn from the true underlying distribution , and we construct four ambiguity sets: an empirical MAD ambiguity set, an empirical variance ambiguity set, a DD-MAD ambiguity set, and a Wasserstein ambiguity set. The empirical MAD ambiguity set is defined in (7), where we directly substitute the empirical mean and MAD for m and d, respectively. The empirical variance model is another popular moment model that constructs its ambiguity set based on the empirical mean and variance (i.e., ). Because its formulation and derivation parallel those of the empirical MAD model, we omit its discussion for brevity. The DD-MAD ambiguity set is defined in (15), where rather than carelessly plugging in the empirical estimators, we construct a confidence interval around the empirical mean and MAD. The Wasserstein ambiguity set (Esfahani and Kuhn 2018, Gao and Kleywegt 2023) is a popular data-driven ambiguity set. However, its complexity scales with the number of samples, making the problem computationally intensive with large sample sizes. We derive the reformulation of the Wasserstein model in Appendix D. Once we constructed the different ambiguity sets, we then proceed to compute the distributionally robust thresholds that maximize the respective worst-case expected benefit rates. Finally, we compare the three solutions in a fair out-of-sample experiment relative to the sample average approximation (SAA) method, which naively assumes that the empirical distribution generated from the N samples is the true underlying distribution. The SAA method also represents the stochastic model (Liu and Hasenbein 2019) under the empirical distribution.
We conduct the out-of-sample trials for data sets containing independent samples. We assume the arrival rate is generated by , where . In addition, we assume the experienced decision maker has an educated guess for the distribution support as . In each trial, we draw N independent training samples and obtain from . We then compute the optimal thresholds , nv,, and for the MAD, variance, DD-MAD, and Wasserstein DRO models, respectively. We also compute the SAA threshold by solving the sample average approximation model. Based on the scaling rates derived in Theorem 6 and Esfahani and Kuhn (2018, theorem 3.4), the size of the confidence intervals in (14) is set to be , and the Wasserstein radius is set to be , where C1 and C2 are chosen from the set using a procedure. Specifically, we partition the in-sample data into folds and repeat the following procedure for each fold; the ith fold is taken as a validation data set, and the remaining k − 1 folds are merged to be a subtraining set. We repeat this process for each fold and choose the interval length that performs best in average. The reason why we do not directly plug in the theoretical values from Theorem 6 is that the bound holds for any underlying distributions, which can be overly conservative in practice. Finally, the out-of-sample expected benefit/revenue rate for each of the strategies is then estimated at high accuracy using 10,000 test samples from .
Figure 2 depicts the out-of-sample performances of a social optimizer and a revenue optimizer under different DRO policies with R = 10, C = 1, and μ = 1. The expected values and 95 percentiles are computed from 50 independent trials. The y axis represents the improvements of the DRO policies relative to the SAA policy, whereas the x axis denotes the sample size. In the social optimization problem, the curve of the Wasserstein model terminates at n = 6 because the solver fails to converge when the sample size reaches eight. Meanwhile, the Wasserstein model dominates the SAA model uniformly across all sample sizes in the revenue maximization problem, whereas the MAD, variance, and DD-MAD models outperform the SAA model for small to medium sample sizes. This is because the Wasserstein ambiguity set converges to the true distribution as the number of samples grows, whereas the moment ambiguity sets fail to converge to the true distribution. We also find that the MAD model performs poorly when the sample size is small because the empirical MAD constitutes a biased estimator with significant estimation errors. On the other hand, the DD-MAD model—by optimizing in view of the most adverse mean and MAD—mitigates the detrimental effects of poor empirical estimations and generates high-quality policies. Moreover, we notice that the empirical MAD and variance models yield similar scores, suggesting that measuring dispersion by MAD or variance does not influence the performance of the model. Finally, we observe that the advantages of the DRO policies relative to the SAA method are generally more substantial in terms of the 95th percentiles of improvements. This underlines a major advantage of incorporating the DRO scheme as it reduces the likelihood of realizing inferior performance in the out-of-sample tests.
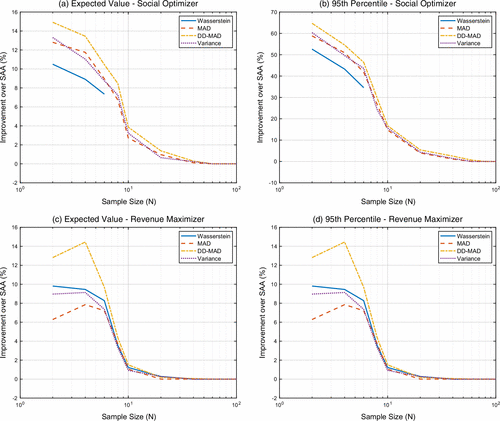
Table 1 reports the computation time of different models with the sample sizes varying from 2 to 100. We set the length of the confidence intervals and the radius of the Wasserstein ball to 0.1. In this experiment, the running time limit of SDPT3 is set to 600 seconds, and the number of iterations is set to 5,000. All computational times are averaged over 10 trials.
|

Table 1. Running Time (in Seconds) of Different Methods
| Model name | Sample size N | |||||
|---|---|---|---|---|---|---|
| 2 | 5 | 10 | 25 | 50 | 100 | |
| Social | ||||||
| MAD | 18.63 | 17.44 | 19.28 | 18.15 | 19.62 | 20.31 |
| DD-MAD | 31.46 | 32.58 | 30.19 | 33.64 | 32.84 | 31.52 |
| Wasserstein | 39.26 | 78.53 | — | — | — | — |
| Variance | 29.11 | 30.62 | 29.94 | 31.47 | 30.53 | 30.72 |
| Revenue | ||||||
| MAD | 0.05 | 0.04 | 0.04 | 0.05 | 0.06 | 0.06 |
| DD-MAD | 1.48 | 1.52 | 1.66 | 1.92 | 1.73 | 1.70 |
| Wasserstein | 1.69 | 1.92 | 2.41 | 2.63 | 2.95 | 4.68 |
| Variance | 31.42 | 30.73 | 31.61 | 31.55 | 31.79 | 32.80 |
Note. The — symbol indicates that the model fails to converge in the maximal iteration/time.
The results in Table 1 indicate that the computational times of the MAD, variance, and DD-MAD models are size invariant because the number of constraints is independent of the number of samples. For the social optimization problem, the Wasserstein model is applicable to small-size instances. However, it encounters computational difficulties for moderate-size problem instances; when the sample size reaches 10, the SDP solver fails to converge within the time/iteration limit. Benefiting from the closed-form solution, the MAD model is more efficient than the variance and DD-MAD models in both the social and revenue optimization problems. For the revenue optimization problem, the DD-MAD and Wasserstein models admit a linear programming (LP) reformulation, whereas the variance model still leads to an SDP reformulation. This underlines a major advantage of using MAD at the moment ambiguity set as it can significantly improve the model’s efficiency.
The DD-MAD model is still size invariant, and its linear programming reformulation yields a much shorter computational time than the SDP reformulation for the social optimization problem. In addition, the Wasserstein model can be solved efficiently even for large sample sizes, benefiting from the linear programming reformulation.
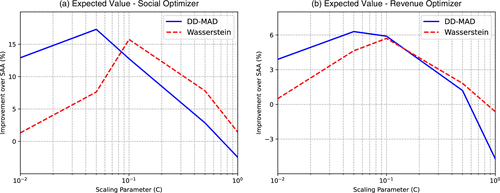
Finally, we report the performance of the DRO models under different scaling parameters C in Figure 3. The expected improvements are computed with n = 5 samples from 50 independent trials. We observe that both models have large variations in performance with different scaling parameters. The Wasserstein and DD-MAD models yield unimodal curves in both the social and revenue optimization problems, implying a trade-off between performance and conservatism. Intuitively, including robustness can improve the out-of-sample performance, whereas being too conservative may also adversely affect the results. To achieve the best performance, one could set the size of the ambiguity set or confidence interval to the best radius. Unfortunately, we do not have access to this information. Although one can plug in the theoretical values obtained from concentration inequalities, these values are usually too conservative. In practice, decision makers can rely on a crossvalidation or bootstrap procedure to obtain a suitable size for the ambiguity set (Gotoh et al. 2021, Bates et al. 2023). From the figure, we further observe that the two models perform quite differently when the scaling parameter C is small; the DD-MAD model achieves significant improvement, whereas the Wasserstein model only yields a slight improvement. The reason is that the Wasserstein ambiguity set is centered on the empirical distribution. When the scaling parameter is small, all the distributions within this ambiguity set are close to the empirical distribution. Thus, it generates similar results to SAA and cannot achieve a large improvement. Conversely, the DD-MAD model converges to the empirical MAD model when C = 0. As illustrated in the first set of experiments, the MAD model outperforms the SAA method for small sample sizes. Hence, the DD-MAD method yields a substantial improvement when the scaling parameter is small.
6. Conclusion
This paper developed an extension of the Naor (1969) strategic queue model with uncertain arrival rates using the DRO framework. We showed that under the DRO setting, the optimal threshold of an individual optimizer coincides with the original result of Naor (1969), and there exist optimal thresholds of the social and revenue optimizers not larger than the optimal individual threshold. We then proved that the revenue rate function is concave, whereas the social benefit rate function is concave or unimodal under some mild conditions. These nice properties lead to a closed-form solution for the revenue maximization problem and an analytical solution for the social optimization problem.
Next, we considered the data-driven optimization setting, where decision makers only have access to limited historical samples. We proposed a data-driven MAD model by introducing an extra layer of robustness to the primitive MAD ambiguity set. As the model mitigates the detrimental estimation errors from the empirical mean and MAD, it achieves attractive performance in out-of-sample tests. We derived an SDP reformulation for the social optimization problem and a linear programming reformulation for the revenue maximization problem. We further established finite-sample guarantees for the data-driven model, which provide valuable guidance for choosing the robustness parameters in practice. Our experimental results demonstrate that a system manager who disregards ambiguities in the arrival rate distribution as well as errors from the empirical parameter estimations may incur large out-of-sample costs. Future work includes extending the DRO scheme to the unobservable strategic queues, where newly arrived customers cannot observe the current length of the queue system.
Appendix A. Proofs of Section 2
It is established in Naor (1969, equation 30) that for any deterministic arrival rate λ and service rate μ, the optimal threshold from the perspective of a public goods regulator will be less than or equal to the optimal threshold of an individual customer. Suppose that every optimal threshold that maximizes the worst-case expected social benefit rate is strictly greater than the optimal threshold of an individual customer (i.e., for all ). Then, based on our previous statement, for any fixed ρ and any optimal , we have , where is the corresponding optimal social threshold under the deterministic setting. Because is discretely unimodal for any fixed ρ (Naor 1969, p. 20), the relationship of the benefit rate can consequently be derived as
Using this relationship, one can further establish that for any ambiguity set ,
Conversely, by the definition of , we also have . This implies that . Therefore, is also an optimal threshold of the social optimization problem, which contradicts our previous assumption. This completes the proof. □
The proof parallels that of Proposition 1—we omit it for brevity. □
Appendix B. Proofs of Section 3
The first and second derivatives of the social benefit rate function are continuous.
To show the continuity of the first and second derivatives of , we will show that
First, we perform the transformation for the term when . Note that , and the denominator is equal to . We can consequently rewrite the first term as
Next, we prove the equivalence of the remaining part when . Similarly, by the fact that , we can rewrite this part as
When ρ = 1, , which coincides with . Therefore, is equal to (B.1). One can verify that the first and second derivatives of (B.1) are continuous; hence, also has these properties. □
The function is strictly concave and monotone increasing on .
When , the first derivative of is
Define the numerator as . The first derivative of is given by Note that when is negative and that when is positive. Therefore, the function is decreasing on (0, 1) and increasing on . Meanwhile, by the fact that , we know that the numerator is positive on . Because the denominator is positive, the first derivative is positive on . Thus, we conclude that is increasing on .
Next, we show that the second derivative of is negative. We have
Because the term is positive on and is negative on , we simply need to determine the sign of . For convenience, define
Note that and , whereas . Therefore, if is increasing on , the second derivative will be negative on . To show this, we take the first derivative of and obtain
Taking specific values into this function, we can obtain , and . Similarly, if is decreasing on and increasing on , then will be positive on . To verify this, we can take the second derivative of , which gives
One can verify that is negative on and positive on . Thus, we have established that is negative on and is concave on . □
For any , the function is concave on .
For any , one can verify that is continuous and second-order differentiable on . Thus, is concave if and only if its second derivative
If this function is nonpositive for all , then we can establish that the second derivative is nonpositive for all .
Consider a fixed . Defining as the product of and yields
We show that is nonpositive for . Observe that goes to negative infinity as and equals to zero at ρ = 1. Thus, it is sufficient to show that is increasing on for every fixed v. Taking the derivative with respect to ρ and dividing it by yields
Similarly, one can verify that this expression goes to positive infinity as and is equal to zero at ρ = 1. Therefore, to show that is positive on (0, 1), it is sufficient to show that is decreasing on (0, 1). Again, taking the derivative with respect to ρ and dividing it by , we get
This expression again vanishes at ρ = 1 and goes to negative infinity as . Thus, it is sufficient to show that it is increasing on (0, 1). Taking the derivative with respect to ρ and multiplying with yield
At ρ = 0, is equal to v + 1, which is greater than zero, and vanishes at ρ = 1. Taking the derivative with respect to ρ and dividing by , we have
One can verify that when is always nonpositive, which completes our proof. □
Using the lemmas, we are ready to show that when , the social benefit rate function is strictly concave on . For , we can rewrite as
From Lemma B.2 and Lemma B.3, we know that is strictly concave and that is concave. Therefore, is the sum of a strictly concave function and a concave function, which is strictly concave for . □
When n = 1, one can verify that is a concave increasing function for . We now proceed to show that the function is unimodal for . A sufficient condition for to be unimodal is , and has a unique solution. Taking the derivative of yields
Showing that has exactly one positive root directly is nontrival. However, it is equivalent to showing that has exactly three positive roots. One can verify that this new term can be written explicitly as . We then reformulate the root equation to a polynomial form:
The left-hand side of the equation is a single-variable polynomial, and one can verify that it has three sign changes. Based on Descartes’ rule of signs, the number of positive roots is at most three. By the fact that and must has at least one root. Because the term has two roots, we know that this polynomial has at least three roots. Therefore, this polynomial has exactly three roots, and has exactly one root. This shows that is a unimodal function. □
The second derivative of is
Showing that only has one root is equivalent to showing that has exactly four roots. One can check that coincides with Similar to the previous proof, we transform the root equation to a polynomial form:
One can verify that this polynomial has four sign changes. Based on Descartes’ rule of signs, the number of positive roots is four or two. Because the term already has three roots, has exactly one root, which also implies that the sign of changes at most once. □
We first show that strong duality holds, and both the primal and dual optimal solutions are attained, which is a sufficient condition for complementary slackness. To show this, we need to prove that both the primal and dual problems have interior points.
Showing the existence of interior points of the primal problem is equivalent to finding a point that resides in the interior of the convex cone
Therefore, is an interior point of , and strong duality holds (i.e., the optimal values of the primal and dual problems coincide). Moreover, because there exists an interior point of the primal problem and because the common optimal value is finite, we have that the dual optimal solution is also attained (Shapiro 2001, proposition 3.4). Noticing that the support is compact, whereas the social benefit rate function and the moment functions ρ and are continuous, we can invoke Shapiro (2001, corollary 3.1) to establish that the primal optimal solution is attained.
In summary, we have strong duality and the attainment of both the primal and dual optimal solutions, which imply that complementary slackness holds (Shapiro 2001, proposition 2.1). □
We know that the revenue rate function is continuous for . Therefore, employing Lemma B.2 yields the desired result. □
The dual Problem (9) can be equivalently written as
First, we illustrate the case when . The constraint of the dual problem indicates that majorizes . One can verify that the two-piece piecewise affine function with the largest expected value is the one that touches at three points: , and b; see Figure 1(a) for an illustrative example. By complementary slackness in Lemma 2, the optimal distribution can only assign positive mass to these three points, which yields the following system of linear equations:
Solving this system of linear equations leads to the first result in Proposition 3.
Next, we prove the two cases when . If , we claim that the extremal distribution that solves (8) is a three-point distribution. To see this, we know that complementary slackness holds from Lemma 2, which means that the extremal distribution is supported on points where the dual constraint is binding. Because the two-piece piecewise affine function can touch on at most three points under constraint
Solving this system of linear equations leads to the second result in Proposition 3.
We now establish that if , the extremal distribution is a two-point distribution. Similarly, by the fact that the extremal distribution is a discrete distribution supported on at most three points, we just need to show that there does not exist a one-point or three-point extremal distribution that solves (8). We can exclude the possibility of one-point distribution easily because its mean-absolute deviation is zero. As we described previously, the extremal three-point distribution is supported on , and b, and the largest mean-absolute deviation that can be achieved within this support is given by . Because , the extremal distribution can only be a two-point distribution. One of the support points is given by , whereas the other one is determined by the value of d, which yields the following linear equations:
Solving this system of equations, we obtain the optimal solution explicitly as
This completes the proof. □
Appendix C. Proofs of Section 4
Problem (14) can be equivalently written as
Dualizing this optimization problem yields
Applying algebraic reductions and invoking Lemma 3 lead to the desired reformulation. The derivation straightforwardly follows that of Theorem 1, and we omit for brevity. □
The dual problem is given by
Because the revenue rate function is concave for , the semi-infinite constraints are satisfied if and only if each constraint is satisfied at points , which completes the proof. □
Appendix D. Distributionally Robust Model with a Wasserstein Ambiguity Set
In this section, we study the DRO model with a Wasserstein ambiguity set (Esfahani and Kuhn 2018, Gao and Kleywegt 2023). We develop solution schemes to find the optimal threshold strategies for a social optimizer and a revenue maximizer given by and , respectively, such that the worst-case expected benefit rates are maximized. Here, the worst case is taken over the Wasserstein ambiguity set containing all probability distributions (discrete or continuous) sufficiently close to the discrete empirical distribution, where the closeness between two distributions is measured in terms of the Wasserstein metric (Esfahani et al. 2018).
(
The Wasserstein distance can be viewed as the (rth root of the) minimum cost for moving the distribution to , where the cost of moving a unit mass from to amounts to . The joint distribution of and is, therefore, naturally interpreted as a mass transportation plan (Esfahani et al. 2018). Similarly to the data-driven setting in Section 4, we assume that we have observed a finite set of N independent realizations given by , where . Using the observations, we define the empirical distribution as the discrete uniform distribution on the samples.
In this paper, we consider the Wasserstein ambiguity set defined as
We derive the optimal threshold strategies and for a social optimizer and a revenue maximizer, respectively. As stated in Section 2, the optimal joining threshold for an individual customer is independent of the arrival rate, and we have from (2).
D.1. Social Optimizer
The objective of a social optimizer is to obtain an optimal joining threshold that maximizes the worst-case expected benefit: that is, , where
The worst-case expectation is computed over all distributions in the Wasserstein ambiguity set with the support set .
For any and , the worst-case expectation coincides with the optimal objective value of the following semidefinite program:
The distributionally robust model with the ambiguity set (D.1) can be equivalently written as
Its strong dual problem is given by Esfahani and Kuhn (2018, theorem 4.2):
We can deal with each constraint separately for the cases and , and consequently, we have
Substituting the definition of in (3) and applying algebraic reductions yield the following polynomial inequalities for each :
The inequalities are of the form for and for , where yi and zi represent the coefficients of the respective polynomial inequalities. We next invoke the result of Lemma 3 for every to express the inequalities in (D.3) as semidefinite constraints. This leads to the desired semidefinite program, which completes the proof. □
To determine an optimal joining threshold, we compute the worst-case expected benefit rate for every , , using the result of Theorem D.1, and then, we select the best threshold .
D.2. Revenue Maximizer
The objective of a revenue maximizer is to find an optimal threshold that maximizes the worst-case expected revenue rate of a firm (i.e., , where the worst-case expectation is computed over all the distributions in the Wasserstein ambiguity set defined by (D.1) with support set ). The worst-case expected profit rate is given by
For any , the worst-case expectation coincides with the optimal objective value of the following linear program:
The strong dual problem of is given by
Because the revenue rate function is concave for , the semi-infinite constraints are satisfied if and only if each constraint is satisfied at three points . Consequently, we have
To determine an optimal joining threshold , we compute the worst-case expected profit rate for every using the result of Theorem D.2, and we select .
References
- (2018) Confidence intervals based on absolute deviation for population mean of a positively skewed distribution. Internat. J. Comput. Theoret. Statist. 5(1):1–13.Google Scholar
- (2013) Bayesian dynamic pricing in queueing systems with unknown delay cost characteristics. Manufacturing Service Oper. Management 15(2):292–304.Link, Google Scholar
ApS (2022) MOSEK optimizer API for Python Version 9.2.49. Accessed April 13, 2022, https://docs.mosek.com/9.2/pythonapi/index.html.Google Scholar- (2019) Confidence intervals for median absolute deviations. Preprint, submitted November 1, https://arxiv.org/abs/1910.00229.Google Scholar
- (2021) Linearized robust counterparts of two-stage robust optimization problems with applications in operations management. INFORM J. Comput. 33(3):1138–1161.Google Scholar
- (2015) Robust queueing theory. Oper. Res. 63(3):676–700.Link, Google Scholar
- (2023) Cross-validation: What does it estimate and how well does it do it? J. Amer. Statist. Assoc., ePub ahead of print May 15, https://doi.org/10.1080/01621459.2023.2197686.Google Scholar
- (1972) More bounds on the expectation of a convex function of a random variable. J. Appl. Probab. 9(4):803–812.Google Scholar
- (2009) Robust Optimization, vol. 28 (Princeton University Press, Princeton, NJ).Google Scholar
- (2005) Optimal inequalities in probability theory: A convex optimization approach. SIAM J. Optim. 15(3):780–804.Google Scholar
- (2004) The price of robustness. Oper. Res. 52(1):35–53.Link, Google Scholar
- Bhat UN (2008) The general queue G/G/1 and approximations. An Introduction to Queueing Theory: Modeling and Analysis in Applications (Birkhäuser, Boston), 169–183.Google Scholar
- (2003) Confidence intervals for mean absolute deviations. Amer. Statist. 57(4):233–236.Google Scholar
- (2007) Equilibrium customer strategies in a single server Markovian queue with setup times. Queueing Systems 56(3–4):213–228.Google Scholar
- (2020) Knowledge, congestion, and economics: Parameter uncertainty in Naor’s model. Queueing Systems 96(1):83–99.Google Scholar
- (2014) Equilibrium in queues under unknown service times and service value. Oper. Res. 62(1):38–57.Link, Google Scholar
- (2010) Distributionally robust optimization under moment uncertainty with application to data-driven problems. Oper. Res. 58(3):595–612.Link, Google Scholar
- (2008) Equilibrium balking strategies in the observable single-server queue with breakdowns and repairs. Oper. Res. Lett. 36(6):696–699.Google Scholar
- (2018) Data-driven distributionally robust optimization using the Wasserstein metric: Performance guarantees and tractable reformulations. Math. Programming 171(2018):115–166.Google Scholar
- (2018) Data-driven inverse optimization with imperfect information. Math. Programming 167(1):191–234.Google Scholar
- (2023) Distributionally robust stochastic optimization with Wasserstein distance. Math. Oper. Res. 48(2):603–655.Link, Google Scholar
- (2021) Calibration of distributionally robust empirical optimization models. Oper. Res. 69(5):1630–1650.Link, Google Scholar
- (2011) Strategic behavior and social optimization in Markovian vacation queues. Oper. Res. 59(4):986–997.Link, Google Scholar
- (2007) Analysis and comparison of queues with different levels of delay information. Management Sci. 53(6):962–970.Link, Google Scholar
- (2015) Distributionally robust multi-item newsvendor problems with multimodal demand distributions. Math. Programming 152(1–2):1–32.Google Scholar
- (2003) To Queue or Not to Queue: Equilibrium Behavior in Queueing Systems, vol. 59 (Springer Science & Business Media, New York).Google Scholar
- (2023) Strategic behavior in queues with arrival rate uncertainty. Eur. J. Oper. Res. 309(1):217–224.Google Scholar
- (2016) Regulating an observable M/M/1 queue. Oper. Res. Lett. 44(2):196–198.Google Scholar
- (1965) Confidence intervals based on the mean absolute deviation of a normal sample. J. Amer. Statist. Assoc. 60(309):257–269.Google Scholar
- (2014) Distributionally robust mixed integer linear programs: Persistency models with applications. Eur. J. Oper. Res. 233(3):459–473.Google Scholar
- (2019) Naor’s model with heterogeneous customers and arrival rate uncertainty. Oper. Res. Lett. 47(6):594–600.Google Scholar
- (2004) Yalmip: A toolbox for modeling and optimization in MATLAB. 2004 IEEE Internat. Conf. Robotics Automation IEEE Catalog Number 04CH37508 (IEEE, Piscataway, NJ), 284–289.Google Scholar
- (1969) The regulation of queue size by levying tolls. Econometrica 37(1):15–24.Google Scholar
- (2007) Ambiguity in portfolio selection. Quant. Finance 7(4):435–442.Google Scholar
- (2018) Robust optimization with ambiguous stochastic constraints under mean and dispersion information. Oper. Res. 66(3):814–833.Link, Google Scholar
- (1957) A min-max solution of an inventory problem. Technical report, RAND Corporation, Santa Monica, CA.Google Scholar
- (2015) Distributionally robust logistic regression. Adv. Neural Inform. Processing Systems 1(2015):1576–1584.Google Scholar
- (2001)
On duality theory of conic linear problems . Goberna MÁ, López MA, eds. Semi-Infinite Programming, Nonconvex Optimization and Its Applications, vol. 57 (Springer, Boston), 135–165.Google Scholar - (2002) Minimax analysis of stochastic problems. Optim. Methods Software 17(3):523–542.Google Scholar
- (1999) SDPT3—A MATLAB software package for semidefinite programming, version 1.3. Optim. Methods Software 11(1–4):545–581.Google Scholar
- (2022) MAD dispersion measure makes extremal queue analysis simple. INFORMS J. Comput. 34(3):1681–1692.Link, Google Scholar
- (2014) Distributionally robust convex optimization. Oper. Res. 62(6):1358–1376.Link, Google Scholar
- (1966) On minimax solutions of stochastic linear programming problems. Časopis Pro Pěstování Matematiky 91(4):423–430.Google Scholar