How Are Students Learning in a Business Statistics Course? Evidence from Both Direct and Indirect Assessment
Abstract
This paper studies how both direct and indirect assessment outcomes can determine how students are learning different concepts in business statistics. We explore connections between the outcomes from the two assessment approaches and how different student characteristics and background factors impact these two methods of assessment. The results based on a sample of 64 students enrolled in an undergraduate business statistics course at a large public university designated as a minority-serving institution show some similarities and some differences among the two types of assessment outcomes and the insights they provide about overall student learning in the course. Furthermore, factors like gender and background grade point average are seen to impact both direct and indirect assessment results, whereas others such as the type of business concentration and student status only impact one type of assessment. Finally, we show that some indirect assessment outcomes can predict direct assessment outcomes while controlling for demographic and other background variables.
1. Introduction
Data have become the most powerful tool for businesses today. Use of data has become so pervasive that one hardly comes across a sector or field today where data are not used. Business statistics is a course that teaches students in the business discipline how to analyze data arising from a business problem by using appropriate statistical methods and interpreting the findings for effective decision making. Business statistics courses are considered core courses for most undergraduate and graduate business program in the nation. However, such a course is often perceived as challenging for many students, especially those who come from nontechnical fields to pursue a business degree, which results in this course becoming a “bottleneck” course. Bottleneck courses are those courses that are failed by a large proportion on students (20% or more in most cases), and because of this, they pose huge barriers to graduation and retention (Mitra and Beenen 2019). Colleges and universities are thus under tremendous pressure to introduce measures for improving student retention (Crisp et al. 2018). It is thus extremely important to understand what challenges students face in business statistics courses today and identify factors that contribute to students’ failure in such courses. This can be accomplished with the help of “assessment.”
Assessment is an integral part of instruction, and it determines whether the student learning goals of a course or a program are met while at the same time drive decisions regarding pedagogical changes and curriculum advancement to improve student success and retention. Assessment methods include both direct and indirect approaches to capturing student outcomes from different perspectives (Menhart 2011). Direct assessment methods refer to measures that provide evidence of student learning or achievement by direct examination of students’ skills or competency via tests, assignments, projects, quizzes, and so on. Indirect assessment methods, conversely, measure student attitudes and perceptions about their own learning and can be accomplished via student satisfaction surveys or exit surveys or focus group interviews that can be administered in classes at the end of an academic term. Although direct assessment measures are more commonly used because they are more intuitive and can be embedded in a course easily, indirect methods often capture rich data that can complement or corroborate the information obtained via direct measures and establish an overall picture of the level of student learning in a course (Rogers 2020) and hence are becoming popular.
Given the need to understand how students perform in a business statistics course in a comprehensive manner, this paper investigates the role of both direct and indirect assessment in evaluating how well a diverse group of students at a minority serving institution located in the western United States learn different statistical concepts. Moreover, we also study whether the information obtained from both assessment sources match or if there are some discrepancies between them, and how this can potentially inform pedagogical changes. Finally, we also study which external factors (demographic and academic background) contribute to both types of assessment outcomes and explore whether some of the indirect assessment outcomes can predict direct assessment outcomes.
The rest of the paper is organized as follows. Section 2 presents an overview of the existing literature related to student success and assessment outcomes in business statistics courses. Section 3 introduces our data, followed by an outline of our research goals and methods in Section 4. Results are included in Section 5, and we conclude with a discussion and practical implications in Section 6.
2. Background and Literature Review
There exists much research on the study of factors that contribute to student performance in college courses and even bottleneck courses (Herndon and Moore 2002, Brower and Ketterhagen 2004). These factors can range from demographics to academic background and preparation (Mitra and Goldstein 2015). Such studies are extremely important to boost student success in colleges as that directly impacts their postcollege life like careers, income, and community engagement.
Statistics courses are part of most disciplines today in colleges and universities, and virtually every college student is required to take at least one statistics and/or quantitative analysis-based research methodology course (Mundfrom et al. 1998). These courses are generally perceived to be challenging for students and have been associated with low levels of achievement caused by increased anxiety and lower self-efficacy (Onwuegbuzie and Seaman 1995, May 2009). In fact, Onwuegbuzie (2000) found that statistics anxiety, along with achievement expectation, played a central role in predicting performance in statistics courses. For this, a deep understanding of student performance and factors impacting performance is essential. Lester (2016) observed that performance in a psychological statistics course was associated with gender (females performed better) and basic foundational mathematical skills such as algebra, based on a sample of 93 undergraduate students.
Business students are required to enroll in a statistics course during most undergraduate degree programs at U.S. colleges and universities, and such courses are meant to help prepare them to use statistical methods in analyzing data for making effective business decisions. However, many of these students often do not have the quantitative and technical foundation required to succeed in a statistics course, which involves complex quantitative analysis and problem-solving via software applications (such as, Microsoft Excel, Minitab, SPSS); hence, the challenges are more pronounced in business statistics courses. In fact, students who hold unfavorable beliefs with prior achievement in mathematics have faced difficulties in statistics courses (Tomasetto et al. 2009). Cohn (1972) found that grade point average (GPA) and mathematical ability positively impacted performance of 43 graduate students in an economic statistics course. Rochelle and Dotterweich (2007) discovered that performance in business statistics courses was positively correlated with class attendance, previous performance in mathematics courses such as algebra and calculus, and overall GPA. Since the advent of online courses in the last couple of decades, research has also focused on exploring differences in student outcomes between different course learning environments. Lawrence and Singhania (2004) observed that the performance of business statistics students in online course formats was significantly poorer than those in traditional face-to-face course formats. Haughton and Kelly (2015), conversely, found that there were no significant differences in final grades and course satisfaction between traditional and online sections of a business statistics course. Mitra and Beenen (2019) showed that motivational factors, goal orientations, and learning styles of students not only impacted their performance in different course formats but also drove the course format self-selection process.
To mitigate the large failure and dropout rates associated with business statistics courses (Gainen 1995), colleges and universities are adopting initiatives to boost success in these courses. Mitra and Goldstein (2015) determined factors that affected student performance in a business statistics course and used those results to suggest appropriate early detection and intervention techniques to help at-risk students early on with additional support to increase their chances of passing the course at the end of the semester. Mitra and Goldstein (2018) further showed that academic support services like supplemental instruction (or SI) greatly contributed to the success of students enrolled in a business statistics course and more so for at-risk students based on their overall academic background and performance on a prerequisite mathematics course. These are important steps toward improving student outcomes in challenging courses such as business statistics that have produced positive results. However, there is more to be done, and one way to form an in-depth understanding about where students are struggling in courses and how to address those challenges is via assessment techniques.
Assessment is the systematic basis for making inferences about the learning and development of students in terms of achieving prespecified learning goals (Erwin 1991), and it provides insights into potential programmatic changes for the purpose of improving student outcomes. With technological advances and instructors experimenting with innovative pedagogical activities to increase student motivation and engagement in business statistics courses, it is all the more important to continually evaluate them so that they serve their designated purpose of enhancing student learning, success, and retention in traditionally difficult courses. Assessment methods can be broadly classified into two categories: (i) direct and (ii) indirect. Direct assessment methods make use of direct evidence of student learning and performance from various work they submit such as assignments, exams, papers, and so on. Indirect assessment, conversely, collects student perspectives about their own learning on different aspects such as self-perceived understanding of course materials, self-perceived attainment of the course learning objectives, satisfaction with the course experience, and so on. Although most of the research on assessment for statistics education has been restricted to K-12 education (Garfield and Gal 1999, Garfield and Chance 2000) thus far, it is equally important in higher education. Onwuegbuzie and Leech (2003) discussed areas to consider for assessment in statistics courses and problems with usual assessment practices for college-level statistics courses. Weland (2020) created and introduced a problem-based learning intervention method to study its impact on student learning and satisfaction via both direct and indirect assessment measures.
Although there exists a large amount of literature on factors affecting student success in business statistics courses, the application of assessment techniques in these courses is not very extensively studied today. In particular, the role of both direct and indirect assessment outcomes in the context of how students learn different statistical concepts and how those findings could inform course changes is unclear. Moreover, do the findings from these two types of assessment techniques depict a similar picture regarding student learning or do they provide inconsistent, yet complementary, information that can further enrich understanding? This paper thus aims to fill this gap by presenting detailed analysis of both direct and indirect assessment outcomes related to a business statistics course taught at a four-year minority-serving public university. We further interpret these findings and formulate how these results may inform potential pedagogical changes with a view to improving student outcomes in the future.
3. Data
The data for this study were collected from multiple sources. An assessment activity was administered in two sections of an undergraduate business statistics course that enrolled 81 students and were taught by the same instructor. This activity consisted of a total of 10 multiple-choice questions, two from each of the five key topics in statistics, namely, descriptive statistics, normal distribution, interval estimation, hypothesis testing, and regression. The questions were primarily computational and involved problem-solving along with a few conceptual ones (same level of difficulty as with all exams for this course) and were integrated with the final examination for the course at the end of a semester, which was implemented via the Moodle learning management system (LMS) used by our campus as an online quiz that is automatically graded. The exam was held on campus in a computer laboratory and was proctored by the instructor. This assessment exercise was aligned with the three primary course learning objectives, which were as follows:
Demonstrate ability to identify the appropriate statistical technique to apply to a business problem
Demonstrate ability to implement the appropriate statistical technique to solve a business problem
Interpret the results from the statistical analysis correctly for effective business decision making
The assessment questionnaire was tested and validated prior to administration to ensure reliability. This was done using a pilot implementation on a sample of students and via reviews performed by several other faculty members who teach the course.
Indirect assessment data were obtained via an online survey (with institutional review board approval HSR# 18-19-596) administered to the same students in the business statistics courses that participated in the direct assessment process. The survey included questions that were meant to understand students’ self-perceptions about their overall learning in their course and in terms of achieving the course learning goals, topics that they found the most challenging (among the five that were included in the direct assessment questionnaire), their overall interest and motivation in the course, and their self-assessment regarding their preparedness for the next set of courses in their curriculum that have the business statistics course as a prerequisite course. Additionally, information regarding students’ demographic and academic background were collected in the survey. Students’ names and university identification numbers (called CWIDs) were used to link the survey data with the direct assessment scores to facilitate the analysis.
Of a total of 81 students enrolled in the two sections of the business statistics course during the semester in which this project was conducted, six had dropped before the end of the semester. Of these 75 students, 68 students participated in the indirect assessment survey. Four of these 68 students did not fully complete the survey and had missing responses for more than 50% of the questions. These data records were deleted, thus yielding a response rate of 85.3% (64 of 75). Participation was completely voluntary, and no incentives were provided.
4. Research Goals and Methods
The overall research goal is to form an in-depth understanding of how students are learning different statistical concepts in a business statistics course via both direct and indirect assessment measures. Our specific research questions that we aim to address are outlined here:
Do direct and indirect assessment outcomes match and lead to the same conclusions about student learning and performance in the business statistics course? If not, what are the main differences between the two sets of outcomes?
How do direct and indirect assessment outcomes differ and across different student subpopulations as defined by students’ academic and demographic background?
What are the similarities and dissimilarities across the two set of assessment outcomes?
Can indirect assessment outcomes predict direct assessment outcomes?
How do the above findings help inform and improve the formal assessment outcomes for the course in future via pedagogical changes?
The data are analyzed with statistical methods and models. Descriptive statistics are used to generate summary measures of the background variables and both types of assessment outcomes. Inferential statistics like hypothesis tests and analysis of variance (ANOVA) are then used to explore the statistical significance of differences across the different assessment outcomes and across different student subpopulations. Finally, a multiple linear regression model is used to determine which, if any, of the indirect assessment outcomes impact the direct assessment outcomes while controlling for background factors. All analyses were performed using SPSS statistical software, Version 26 (SPSS IBM).
5. Results
Table 1 summarizes the descriptive statistics for the main demographic and academic background of the students who participated in the study. As we can see, the sample was dominated by female students (65.6%) and Asian/Asian American students (46.5%). Moreover, nearly 44% of students were first-generation college students, meaning that they were the first in their family to attend college, and a majority of students (64.1%) work outside of school for between 10 and 30 hours per week. Finally, our data consisted of students from five different business disciplines: accounting, finance, marketing, management, and economics, with approximately 46% of students belonging to accounting and finance.
|

Table 1. Descriptive Statistics for the Demographic and Academic Background Variables Included in Our Study
| Frequencies (%) | |
|---|---|
| Gender | |
| Male | 34.4% |
| Female | 65.6% |
| Ethnicity | |
| Caucasian/White | 23.5% |
| Hispanic or Latino | 25.6% |
| Asian | 46.5% |
| Hawaiian or Pacific Islander | 0% |
| African American | 1.1% |
| American Indian or Alaska Native | 0% |
| Multiethnic | 3.3% |
| First-generation status | |
| Yes | 43.8% |
| No | 56.2% |
| Transfer status | |
| Yes | 61.2% |
| No | 38.8% |
| Business concentration choice (top) | |
| Accounting | 25.4% |
| Finance | 20.7% |
| Marketing | 19.9% |
| Management | 16.2% |
| Economics | 8.1% |
| Student status/school year | |
| Sophomore | 5.1% |
| Junior | 75.4% |
| Senior | 15.8% |
| Graduate/post-baccalaureate | 3.7% |
| Work hours outside of school | |
| Not working | 15.6% |
| 1–9 h/wk | 7.8% |
| 10–19 h/wk | 31.3% |
| 20–29 h/wk | 32.8% |
| >30 h/wk | 12.5% |
| Primary language | |
| English | 81.3% |
| Non-English | 18.7% |
Notes. Age was a mean of 23.1 years with a standard deviation of 4.91 years. GPA was a mean of 3.19, with a standard deviation of 0.51. The number of units enrolled in during a semester was a mean of 12.5 with a standard dd deviation of 3.1.
5.1. Direct and Indirect Assessment Outcomes
The average direct assessment score obtained from the students in our data set was 77.34% (with a standard deviation (SD) of 16.01%), and the proportion of correct responses obtained overall was 76.6%. Based on these numbers, the student learning goals of the course were deemed to be “met” (criterion of success was 70% correct answers or more as is mandated by our college for assessment in all undergraduate business courses). These results were further broken down by the five topics. The percentages of correct answers received for each of these topics are shown in Table 2. As can be seen, students performed best on the questions related to hypothesis testing and worst on those related to normal distribution. Similarly, students were asked to indicate which topic(s) they found to be the most challenging in the course in the indirect assessment survey. The percentages of students who found each topic difficult also appear in Table 2. The most difficult topic as perceived by students is hypothesis testing, followed by regression. The least difficult topic was perceived to be descriptive statistics followed by normal distribution.
|
Table 2. Topic-Wise Direct and Indirect Assessment Results
| Topics | Direct assessment (% of correct responses) | Indirect assessment (% of students who found a topic difficult) |
|---|---|---|
| Descriptive statistics | 75.46% | 11.45% |
| Normal distribution | 66.39% | 15.66% |
| Interval estimation | 72.43% | 29.61% |
| Hypothesis tests | 82.99% | 48.53% |
| Regression | 79.80% | 37.24% |
The previous findings thus show that the statistical topic of descriptive statistics is generally found to be relatively less challenging by students, and they perform well on that as well (hence direct and indirect assessment results match). Similarly, for the topic of interval estimation, direct and indirect assessment results both fall somewhat in the middle and therefore are more or less aligned. However, for the other three topics, there seem to be mismatch among the outcomes from the two sets of assessment measures. For example, students believe that hypothesis testing is a difficult statistical topic to master (indirect); however, their performance on problems from that topic received the highest scores (direct). Conversely, normal distribution was perceived as a relatively easier topic (indirect), whereas lowest scores were obtained on those questions (direct). Last, students received the second highest percentage of correct answers on the topic of regression, whereas indirect assessment results clearly show that it is one of the most challenging topics to students.
All the previous findings are interesting from an assessment perspective, and they suggest that students often underestimate or overestimate the level of difficulty of a course topic and their own understanding of course materials, particularly for courses with a high level of difficulty. Moreover, students also are likely to spend more time on topics that they perceive to be difficult (e.g., more reading and problem-solving), often leading to good results. Conversely, they tend to spend less time studying topics that they find relatively easier, like normal distribution, thus being less prepared and performing more poorly. Besides, there are several other factors that this phenomenon can be attributed to, such as student academic background and preparation (e.g., foundational mathematical skills), amount of time and effort devoted to the course outside of lecture (e.g., many students work full time and have family commitments that put a constraint on their study time), and the way in which the topic was taught in class by the instructor, among others. To explain the last factor more, we believe that if an instructor explains a topic more in depth with many examples and more problem-solving, students develop a better understanding and may erroneously perceive that topic as “easy” despite the topic being actually quite difficult and complex. We suspect that this may be what happened with the topic of normal distribution.
Some additional indirect assessment results are included in Tables 3–6. Fifteen percent of students are not confident about their understanding of the different statistical topics covered in the course, and 10%–13% of students are not confident about their achievement of at least one or more of the learning outcomes of the course. About 15% students are not satisfied with their overall learning in the course and the development of critical thinking skills. This shows that majority of students, according to the indirect assessment outcomes, were confident and satisfied with their overall learning and experience in the business statistics course.
|
Table 3. Student Self-Perceived Confidence in the Understanding of the Topics in Business Statistics
| Response | Percentage |
|---|---|
| Very confident | 14.29% |
| Confident | 25.40% |
| Neutral | 41.27% |
| Not very confident | 17.46% |
| Not at all confident | 3.17% |
|
Table 4. Student Self-Perceived Confidence (% of Student Responses) in Attaining the Different Learning Objectives in the Business Statistics Course
| Identifying the appropriate statistical method to solve a business problem | Applying a selected statistical method to solve a business problem | Interpreting the results to perform business decision-making | |
|---|---|---|---|
| Very confident | 9.57% | 21.42% | 13.22% |
| Confident | 37.65% | 40.28% | 36.39% |
| Neutral | 41.44% | 28.77% | 37.47% |
| Not very confident | 8.11% | 8.45% | 10.05% |
| Not at all confident | 3.23% | 1.08% | 2.87% |
|
Table 5. Student Self-Perceived Confidence in Their Preparedness for the Next Set of Courses (for Which Business Statistics Is a Prerequisite)
| Response | Percentage |
|---|---|
| Very confident | 18.22% |
| Confident | 23.96% |
| Neutral | 42.41% |
| Not very confident | 13.63% |
| Not at all confident | 1.78% |
|
Table 6. Student Self-Perceived Satisfaction About Their Overall Learning and Developing Critical Thinking and Problem-Solving Skills
| Response | Percentage |
|---|---|
| Very satisfied | 13.29% |
| Satisfied | 6.79% |
| Somewhat satisfied | 42.17% |
| Neutral | 22.83% |
| Somewhat dissatisfied | 9.10% |
| Dissatisfied | 0.61% |
| Very dissatisfied | 5.21% |
5.2. Predicting Direct Assessment Outcomes
A least squares regression model was used to determine whether indirect assessment outcomes can predict direct assessment outcomes while controlling for the various demographic and academic background variables included in the study. The latter will also help identify potential background variables that have a significant impact on the assessment results.
The dependent variable in the model was the assessment score percentage. We used four variables to represent indirect assessment outcomes in the model. These include students’ self-perceived confidence in their understanding the different concepts and topics on business statistics, students’ self-perceived confidence in their preparedness for the next set of courses for which this course acts as a prerequisite (both measured on a five-point Likert scale of 1, not at all confident, to 5, very confident), students’ confidence in attaining the learning outcomes of the course (same five-point Likert scale as the previous two variables) averaged across the three items to account for the strong correlation among them, and students’ overall satisfaction in their overall learning in the course and acquiring the important skills of critical thinking and problem-solving in the process (measured on a seven-point Likert scale of 1, very dissatisfied, to 7, very satisfied). All these variables were converted to the numerical values for use in the regression model. Regarding the control background variables, a few were removed via model selection (work hours, number of units enrolled in, primary language, business concentration) as they had minimal effect on the dependent variable. Of the rest, the categorical variables (ethnicity, gender, first-generation status, transfer status, student status) were converted to dummy variables, whereas the numerical ones (age, gender) were used as is.
The regression model results appear in Table 7. The model ANOVA had p < 0.0001, and the R2 value was 0.673, indicating a reasonable fit for the model. The variance inflation factors (VIFs) were checked for all the independent variables, and they were found to be less than four; hence, multicollinearity issues were not present.
|
Table 7. Multiple Linear Regression Model for Predicting Direct Assessment Scores for a Business Statistics Course
| B | SE(B) | t | p | |
|---|---|---|---|---|
| Gendera | −9.70 | 4.10 | −2.36 | 0.023** |
| Age | 0.30 | 0.47 | 0.64 | 0.53 |
| Ethnicity: Hispanicb | −16.38 | 13.03 | −1.26 | 0.21 |
| Ethnicity: Asian/PIb | −7.04 | 12.35 | −0.57 | 0.57 |
| Ethnicity: Whiteb | −5.54 | 12.93 | −0.43 | 0.67 |
| Ethnicity: Multib | −2.03 | 15.32 | −0.13 | 0.89 |
| First-generation status | −10.39 | 3.77 | −2.76 | 0.009** |
| Transfer status | 4.62 | 4.03 | 1.14 | 0.26 |
| GPA | 9.80 | 3.93 | 2.49 | 0.017** |
| Student status: Freshmanc | 17.27 | 11.57 | 1.49 | 0.14 |
| Student status: Sophomorec | 3.65 | 11.47 | 0.32 | 0.75 |
| Student status: Juniorc | 1.62 | 8.75 | 0.19 | 0.85 |
| Course learning confidence | 5.51 | 3.19 | 1.72 | 0.092* |
| Confidence for next courses | 0.85 | 0.68 | 0.32 | 0.75 |
| Confidence about SLOs | −0.43 | 3.23 | −0.13 | 0.90 |
| Course satisfaction | 4.23 | 1.72 | 2.45 | 0.018** |
Notes. SE(B) is standard error for B coefficient. t represents the t test statistics used for testing the coefficients in the model. R2 = 0.673. Overall model AVOVA, p < 0.0001, n = 64.
aFemale category used as baseline for gender.
bBlack category used as baseline for ethnicity.
cSenior used as baseline for student status.
*p < 0.10; **p < 0.05; ***p < 0.01.
Of the indirect assessment outcomes used, overall course satisfaction had the most significant impact on the direct assessment scores, implying that greater levels of satisfaction with learning and course experience led to higher test scores. Similarly, higher confidence in their understanding of the business statistical concepts was slightly associated with higher scores (significant at the 10% level). The other two variables representing indirect assessment outcomes were not observed to significantly impact direct assessment scores. Of the background variables, gender, first-generation status, and background GPA were significant and the direction of these relationships are same as earlier; females and first-generation students had lower assessment scores, whereas academically stronger students with higher GPA at the start of the semester performed better on the assessment test than those with lower GPAs.
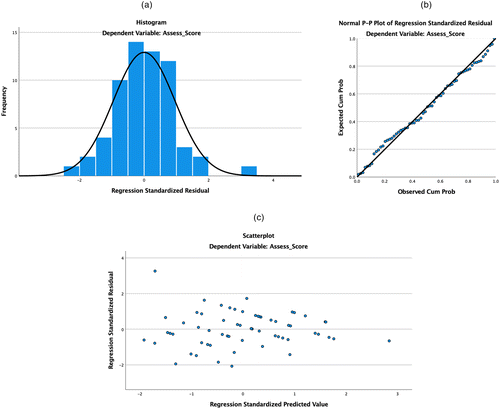
Table 8 shows the reduced regression model with only the significant predictors from the initial model: gender, GPA, first-generational status, confidence in learning, and course satisfaction (all of them significant at the 5% level of significance). The model reported an R2 value of 0.669, which was not significantly different from the previous model (as indicated by the nested model F test statistic, p = 0.53). Figure 1 shows some diagnostic plots based on the residual analyses from this model that clearly show that the underlying assumptions of the regression model are reasonably satisfied in this case.
|
Table 8. Final Multiple Linear Regression Model for Predicting Direct Assessment Scores
| B | SE(B) | t | p | |
|---|---|---|---|---|
| Gendera | −0.497 | 0.221 | −2.249 | 0.028* |
| First-generation status | −7.24 | 0.200 | −3.614 | <0.0001** |
| GPA | 0.681 | 0.242 | 2.815 | 0.007** |
| Course learning confidence | 0.403 | 0.151 | 2.661 | 0.010** |
| Course satisfaction | 0.234 | 0.110 | 2.125 | 0.038* |
Notes. SE(B) is standard error for B coefficient. t represents the t test statistics used for testing the coefficients in the model. R2 = 0.669. Overall model AVOVA, p < 0.0001, n = 64.
aFemale category used as baseline for gender.
*p < 0.05; **p < 0.01.
6. Conclusions, Practical Implications, and Discussions
This study explores in depth how students learn in a business statistics course at a large public university serving predominantly minority students via both direct and indirect assessment measures. Direct assessment outcomes test student knowledge of the different statistical concepts covered in the course via an exam-type questionnaire, whereas indirect assessment outcomes evaluate students’ own perceptions about their overall learning experience in the course via an online survey instrument. Hence, these are viewed as different, yet complementary, approaches to obtaining a comprehensive understanding of student learning in any course as one is based on direct competency and knowledge gain (direct assessment), whereas the other is based on the self-perceptions of the students themselves (indirect assessment).
Our sample data demonstrated that there were both similarities and dissimilarities in the findings from the two methods of assessment in terms of the most challenging topic and association with background factors. The topics of hypothesis testing and regression models were generally perceived by students as difficult to master; however, they performed reasonably well on those topics in the direct assessment test. Conversely, normal distribution is a topic that is usually well understood by students as the indirect assessment results clearly show, although student scores were the lowest on the exercises from that topic on the assessment exam. As discussed earlier, students indeed often overestimate or underestimate their knowledge and abilities in some areas, and there are several external factors that also can potentially contribute to this phenomenon. Regardless, this is very interesting from an assessment viewpoint and offers important pointers for pedagogical improvement in the areas that are challenging (from both assessment perspectives) via additional example videos created by the instructors, supplementary resources like external videos (YouTube, Khan Academy), tutorials and applets, more in-class opportunities for practicing problems on the difficult topics, and in-depth review materials prior to exams. Some of the latter were suggested by students in their comments on open-ended questions included in the indirect assessment survey instrument. Moreover, academic support services like tutoring and SI can provide students with additional means of reinforcing the learning from class lectures. SI, in particular, had proved beneficial in improving student outcomes in business statistics courses in the past (Mitra and Goldstein 2018), so this resource can be considerably expanded to reach even more students for a greater impact.
The impact of demographic and other background factors on the two sets of assessment outcomes may also provide interesting insights; however, we did not have adequate data to assess that accurately for our data set. It is typically expected that students with stronger academic background will produce both higher direct and indirect assessment scores, but there are external factors that impact performance as well. For instance, about 40% of all students mentioned on the survey that external commitments (home and work) seriously impede their progress in college as we saw that nearly 46% were working more than 20 hours per week on a job or multiple jobs outside of campus while being enrolled in college. They not only often work at multiple jobs but also have family responsibilities and commitments that act as potential barriers to performance and success in college. However, this “work” variable was not found to be statistically significant and hence was not included in the regression model. Similarly, a large portion of our student population belongs to underrepresented groups (ethnic minorities, first-generation students, and students belonging to low socio-economic stratum who often require financial aid to pursue higher studies) who also struggle with difficulties related to balancing their home-work-school life, lack of academic and emotional preparedness for college, and low academic self-concept that typically correlates with greater probabilities of nonretention and failure. Some practical implications and potential directions for improving student outcomes from this aspect involves working with the institution’s Diversity Initiatives & Resource Centers to develop programming that target underserved and nontraditional students specifically to help them find an anchor in the institution and feel comfortable seeking help. We can also promote student culture clubs in freshman orientation and create opportunities to help these students find a suitable student club that they can join and get engaged with the institution early on. This can potentially enhance the sense of belonging and help these students build their support group that can further impact retention and success.
The findings from the regression model indicates that student perception about their own learning and understanding of the statistical concepts and satisfaction are strongly associated with direct assessment scores. This establishes a strong association between direct and indirect assessment outcomes and shows that it is extremely crucial for instructors to provide a good learning environment for students to feel confident, motivated, and satisfied with their course experience that can in turn lead to improved performance. For example, active learning tools (like discussion boards for peer-to-peer interactions, group activities like working on case studies via the application of statistical methods) can be incorporated to increase student engagement and create a sense of community that is known to foster student performance and success in traditionally difficult courses.
Thus, in conclusion, assessment should form an integral part of instruction and learning in every statistics class and the in-depth insights obtained from the different assessment approaches should indicate steps that may be taken by administrators and instructors at any institution of higher education to improve student learning and outcomes. It works as an iterative process that continually provides feedback about student learning that in turn dictates curricular changes that need to be re-evaluated for value and impact.
6.1. Limitations of the Study
The main limitation of the study is the sample size. Although we had a reasonable number of observations for determining statistical significance, more data will be useful in generalizing the results to a larger population of undergraduate students beyond our current data set. Our results are furthermore primarily tailored to a student population dominated by nontraditional students such as those belonging to ethnic minority groups or first-generation students because that is the student population served by our institution. Finally, the direct assessment questionnaire only included two questions per statistical topic (constrained by course specifications and assessment requirements), which may have prevented us from reaching stronger conclusions based on those results. We wish to expand this exercise more in the future for a more in-depth research study.
6.2. Future Work
Our future work consists of extending this study by collecting additional data so that our results can be generalized more beyond our data set. We also wish to include other student characteristics in the study, such as motivational, cognitive, and behavioral factors, to evaluate their impact on direct and indirect assessment scores for a business statistics course. Furthermore, data on some additional variables can also be collected such as the nature and level of students’ external commitments (apart from work) and number of times they repeat this course, which can potentially impact assessment outcomes. Finally, this study will inform future research into assessment methods for similar quantitative and traditionally difficult courses to improve student outcomes overall, especially for underserved or nontraditional student groups.
I thank the instructors who participated in the assessment process and the students who filled out survey.
References
- (2004) Is there an inherent mismatch between how black and white students expect to succeed in college and what their colleges expect from them? J. Soc. Issues 60(1):95–116.Crossref, Google Scholar
- (1972) Students’ characteristics and performance in economic statistics. J. Edu. Bus. 3(2):106–111.Google Scholar
- (2018) Predicting graduation rates at 4-year broad access institutions using a Bayesian modeling approach. Res. Higher Edu. 59(2):133–155.Crossref, Google Scholar
- (1991) Assessing Student Learning and Development: A Guide to the Principles, Goals, and Methods of Determining College Outcomes, 1st ed. (Jossey-Bass, San Francisco).Google Scholar
- (1995)
Barriers to success in quantitative gatekeeper courses . Gainen J, Williamson EW, eds. Fostering Student Success in Quantitative Gateway Courses (Jossey-Bass, San Francisco), 5–14.Crossref, Google Scholar - (2000) Assessment in statistics education: Issues and challenges. Math. Thinking Learn. 2(1–2):99–125.Crossref, Google Scholar
- (1999) Assessment and statistics education: Current challenges and directions. Internat. Statist. Rev. 67(1):1–12.Crossref, Google Scholar
- (2015) Student performance in an introductory business statistics course: Does delivery mode matter? J. Edu. Bus. 90(1):31–43.Crossref, Google Scholar
- (2002) African American factors for student success: Implications for families and counselors. Family J. (Alexandria, Virginia) 10(3):322–327.Crossref, Google Scholar
- (2004) A study of teaching and testing strategies for a required statistics course for undergraduate business students. J. Edu. Bus. 79(6):333–338.Crossref, Google Scholar
- (2016) Predicting success in psychological statistics courses. Psych. Rep. 118(3):772–777.Crossref, Google Scholar
- (2009)
Mathematics self-efficacy and anxiety questionnaire . PhD dissertation, Philosophy Department, University of Georgia, Athens, GA.Google Scholar - (2011) Direct vs. indirect assessment methodologies. Proc. Midwest Section Conf. of the Amer. Soc. for Engrg. Edu., University of Arkansas, Fayetteville, AR.Google Scholar
- (2019) A comparative study of learning styles and motivational factors in traditional and online sections of a business course. INFORMS Trans. Edu. 20(1):1–15.Link, Google Scholar
- (2015) Designing early detection and intervention techniques via predictive statistical models: A case study on improving student performance in a business statistics course. Comm. Statist. Case Stud. Data Anal. Appl. 1(1):9–21.Google Scholar
- (2018) Impact of supplemental instruction on business courses: A statistical study. INFORMS Trans. Edu. 18(2):89–101.Link, Google Scholar
- (1998) Introductory graduate research courses: An examination of the knowledge base. Proc. Annual Meeting of the Amer. Edu. Res. Assoc., San Diego.Google Scholar
- (2000) Attitudes toward statistics assessments. Assessment Evaluation Higher Edu. 25:321–339.Crossref, Google Scholar
- (2003) Assessment in statistics courses: More than a tool for evaluation. Assessment Evaluation Higher Edu. 28(2):115–127.Crossref, Google Scholar
- (1995) The effect of time and anxiety on statistics achievement. J. Experiment. Psych. 63:115–124.Google Scholar
- (2007) Student success in business statistics. J. Econom. Finance Edu. 6(1):19–24.Google Scholar
- (2020) Direct and indirect assessments. Retrieved July 8, 2021, https://www.abet.org/wp-content/uploads/2020/09/Direct-and-Indirect-09.09.2020.pdf.Google Scholar
SPSS IBM Accessed June 20, 2021, https://www.ibm.com/analytics/spss-statistics-software.Google Scholar- (2009) Effect of task presentation on students’ performances in statistics courses. J. Soc. Psych. Edu. 12:191–211.Crossref, Google Scholar
- (2020) Project-based learning in social statistics: Direct and indirect assessment of student learning outcomes. Proc. Duquesne Undergraduate Research and Scholarship Sympos. Retrieved July 7, 2021, https://dsc.duq.edu/urss/2020/proceedings/10/.Google Scholar