


The Impact of Gender Information on Hiring Decisions Based on Self-Set Performance Targets
Abstract
Gender-anonymous hiring practices have been widely advocated as a means to reduce labor market inequalities, such as the gender wage gap and the underrepresentation of women in leadership. However, their effectiveness remains debated. This paper studies an experimental labor market where employee candidates set their own performance targets for a real-effort task and employers hire based on these self-set targets. In many professional settings, such targets serve as performance indicators and influence hiring and promotion decisions. In an online experiment with 4,674 participants, we vary in a 2 × 2 design (1) whether employers know the candidates’ genders and (2) the severity of the payoff consequences if the hired employee misses their target. This allows us to examine the interaction effects of gender anonymity in hiring and the performance target’s payoff relevance. We find that given equal ability, women set lower targets than men. Higher targets increase the likelihood of being hired, whereas a larger expected target-performance gap reduces hiring chances, particularly when missing the target has severe consequences for the employer. Importantly, our findings suggest that gender-anonymous applications may have unintended consequences. When gender is revealed, employers appear to adjust for gender differences in target setting, expecting a smaller target-performance gap for women than for men. As a result, women are more likely to be hired and receive higher payoffs when their gender is known. These results indicate that gender-anonymous hiring may backfire for women by preventing employers from accounting for behavioral gender differences (e.g., in self-promotion), ultimately reducing women’s hiring prospects.
This paper was accepted by Dorothea Kübler, behavioral economics and decision analysis.
Funding: This work was supported by the Deutsche Forschungsgemeinschaft (DFG, German Research Foundation) under Germany’s Excellence Strategy [Grant EXC 2126/1–390838866].
Supplemental Material: The online appendix and data files are available at https://doi.org/10.1287/mnsc.2024.07050.
1. Introduction
The last decades have shown continuous efforts toward greater gender equality in many countries. Its relevance in the global political agenda is highlighted by the inclusion of gender equality as one of the Sustainable Development Goals of the United Nations. Yet, despite these efforts, persistent gender inequalities remain, particularly in labor markets. For instance, in 2021, the gender wage gap stood at 10.6% in the European Union and 16.9% in the United States (Organisation for Economic Co-operation and Development 2023). Women held just 18% of senior executive roles in the European Union in 2019 (Eurostat 2020) and only 11.8% of executive-level (C-suite) positions across the companies in the S&P (Standard and Poor’s) Global Total Market Index in the United States in 2023 (Chiang et al. 2024). At the current pace of progress, the World Economic Forum estimates that it will take 151 years to close the global gender gap in economic participation and opportunity (World Economic Forum 2022, p. 5).
These disparities stem from a range of factors on both the employer and employee sides. On the employer side, experimental evidence shows that gender-related stereotypes may contribute to a bias against women in hiring decisions (Reuben et al. 2014). This is corroborated by evidence showing that women are chosen less often given equal qualifications (Barron et al. 2025). Coffman et al. (2021) attribute this to beliefs about women’s lower average performance, and field experiments reveal that women are rated less favorably than men for identical CVs (curricula vitae) submitted for a laboratory manager position (Moss-Racusin et al. 2012). Similarly, Kübler et al. (2018) find substantial discrimination against female applicants for apprenticeships in a vignette study with a nationally representative sample of firms. This discrimination is particularly pronounced in male-dominated industries.
On the employee side, gender differences in attitudes and behavior may reduce women’s chances of obtaining leadership roles, recognition, or promotions (see Eckel et al. 2021 for a recent survey article). Prominent examples are gender differences in risk attitudes, competitiveness (both at the extensive margin (see, e.g., Niederle and Vesterlund 2007) and the intensive margin (see Saccardo et al. 2018)), and social preferences (see Croson and Gneezy 2009 for an overview). Particularly relevant to hiring and promotion processes could be gender differences in confidence and self-assessment; women tend to set more modest (performance) goals (Reuben et al. 2012, Dalton et al. 2015, Brookins et al. 2017, Brandts et al. 2021); assess their skills, achievements, and ambitions more conservatively (both in absolute and relative terms) (e.g., Brandts et al. 2015, Ludwig et al. 2017, Samek 2019, Coffman et al. 2024, Exley and Nielsen 2024); and engage less in self-promotion (Exley and Kessler 2022, Chang et al. 2025).1
One proposed solution to reduce discrimination and bias in hiring is to anonymize applications by removing gender-identifying information. This approach has been adopted or promoted in various sectors and countries. For example, France passed a law in 2006 (but failed to decree how employers should put it into action) and then made it mandatory for large companies in 2014 to accept anonymous CVs, but they abandoned the policy again in 2015 because of practical and legal challenges (Behaghel et al. 2015; see also Abdul Latif Jameel Poverty Action Lab 2018). A well-known early case of anonymization comes from U.S. symphony orchestras, which introduced blind auditions in the 1970s and 1980s (Goldin and Rouse 2000). In the United Kingdom, the BBC introduced anonymized recruitment in the mid-2010s as part of its diversity strategy. Similarly, the British Universities and Colleges Admissions Service began anonymizing university admission applications in several universities in 2015 (Jordan 2017). In the same year, several organizations and firms in the United Kingdom pledged to recruit on a name-blind basis to address discrimination (including applicants to the civil service, Teach First, HSBC (The Hongkong and Shanghai Banking Corporation), Deloitte, Virgin Money, KPMG (Klynveld Peat Marwick Goerdeler), BBC (the British Broadcasting Corporation), NHS (the National Health Service), learndirect, and local governments) (see UK Government 2015). Although such practices are mandated in few jurisdictions, they are recommended by governments and equality bodies in countries like the United Kingdom (Chartered Institute of Personnel and Development 2022), Sweden (Linderborg 2005), Germany (Antidiskriminierungsstelle des Bundes 2014), Austria, and the Netherlands—usually on a voluntary basis. Anonymous applications are further encouraged by nongovernmental organizations in many countries and voluntarily used by various companies. The hiring platform BeApplied.com puts the idea of anonymous applications into practice by removing names, genders, and educational backgrounds from applications—an approach that the platform claims will eliminate unconscious bias.
However, empirical evaluations of anonymous application procedures yield mixed results. Some studies report reductions in discrimination (e.g., against women in orchestra applications (Goldin and Rouse 2000), against ethnic minorities in the Netherlands (Bøg and Kranendonk 2011) and Germany (Krause et al. 2012a), and against both women and ethnic minorities in Sweden (Åslund and Skans 2012)). Others find no improvement or even adverse effects, such as in applications for postdoctorate positions (Krause et al. 2012b), for female musicians in semifinals (Goldin and Rouse 2000), for ethnic minorities in France (Behaghel et al. 2015), for women applying to the city of Helsinki (Kanninen et al. 2023), and for women in certain German companies (Krause et al. 2012a). So far, the identification of the factors driving success and failure of anonymous applications is limited by self-selection as firms especially engaged in diversity may self-select into such new programs (Behaghel et al. 2015). A notable exception is a study in Helsinki, where anonymous applications were exogenously imposed (Kanninen et al. 2023).
In this paper, we examine the impact of gender-anonymous applications using a controlled online experiment with 4,674 participants. We model a common hiring situation in which employee candidates “advertise” themselves by announcing a job-specific performance target (for a real-effort task: the Stroop task). Employers then choose whom to hire based on these self-set performance targets. This setup follows the observation of Exley and Kessler (2022) that people often have to communicate self-evaluations of their performance to others: for example, in applications, interviews, and performance reviews. The opportunity to self-promote can thus influence their hiring, promotion, or pay.
In a 2 × 2 design, we vary (1) whether the employer knows the candidates’ genders and (2) whether the employer’s payoff depends on the hired employee reaching their target. This design allows us to causally identify the effects of gender anonymity on the employee side (e.g., target setting and self-promotion) and the hiring decision on the employer side. By studying the employer’s payoff consequences of hiring an employee (i.e., whether the performance target merely serves as a signal of the employee’s ability versus whether the employee’s actual performance not reaching the target has severe payoff consequences for the employer) (see, e.g., Chen et al. 2022 for a discussion of such thresholds with severe consequences in chief executive officer compensation contracts), we can draw conclusions for two typical situations in the labor market. Although previous research has studied target setting with different consequences for the person setting the target, to the best of our knowledge, no previous paper has studied the impact of differing consequences of reaching the target for the employer and thus, no previous paper has incorporated this difference into the hiring process.
Our results show that women set lower performance targets than men, even when controlling for their ability. This holds regardless of whether gender is disclosed and whether missing the target affects employer payoffs. Setting higher targets generally improves the chances of being hired; self-promotion pays. Yet, when employers expect a large gap between stated and actual performance, this reduces the likelihood of being hired, in particular when missing the target has severe payoff consequences for the employer.
Crucially, we find that gender-anonymous applications can backfire; although intended to promote women, anonymous applications actually result in women being 8% less likely to be hired and receiving approximately 14% lower payoffs relative to nonanonymous conditions. Analyzing possible reasons for this, we find that employers expect more self-promotion and thus, a larger target-performance gap from men than from women. When gender is disclosed, employers adjust their expectations accordingly—leading to relatively better outcomes for women. This holds true both when the target serves purely as a signal and when reaching the target has far-reaching consequences for the employer. Our findings challenge assumptions about the effectiveness of gender-anonymous applications. Rather than necessarily improving hiring decisions, anonymous applications may preclude employers from accounting for gender-specific behaviors, such as differences in self-promotion, and (women-favoring) gender stereotypes, with unintended negative consequences. Conversely, revealing gender enables employers to interpret information on the employee more nuancedly. We argue that anonymization policies should be applied selectively rather than mandated across the board.
The remainder of this paper is structured as follows. In Section 2, we present the experimental design and treatments, detail our method for disclosing gender, and describe the procedures. In Section 3, we develop the hypotheses, and we present and discuss our results in Section 4. Section 5 concludes.
2. Experimental Design
2.1. The Experimental Setup
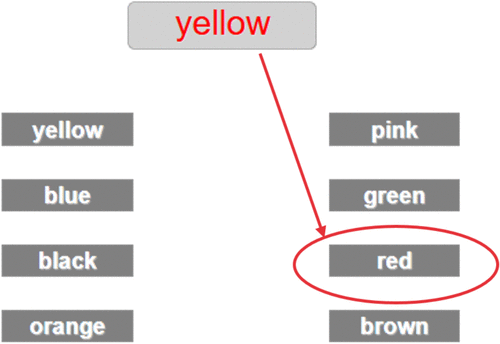
To address our research questions, we design an experimental labor market with 4,674 participants on Prolific. At the beginning of the experiment, one of two roles, employees and employers, is randomly assigned to each participant and kept fixed throughout the experiment. Employees work on a real-effort task. We selected the Stroop task (Stroop 1935) as the real-effort task based on a preparatory study in which we pretested several tasks (including a number-adding task and a counting-zeros task; see AsPredicted 75996) with the goal to identify a task that is comparatively gender neutral in respect to performance, and additionally generates a considerable performance variance, even in shorter time spans. The Stroop task had by far the highest variability in performance while exhibiting no gender difference in performance (neither in our preparatory study nor in the first round of the experiment of this study (p = 0.9836, Mann–Whitney U test)). In our version of the Stroop task as illustrated in Figure 1, participants are shown eight buttons and one of eight possible words. The possible words are color names (red, blue, green, yellow, orange, brown, pink, and black), and each color name has a corresponding button. Participants’ task is to click on the button corresponding to the font color of the word (“red” in Figure 1).
In part 1 of the experiment, which is identical across all experimental treatments, employees work on the Stroop task for two rounds with 40 seconds each to familiarize themselves with the task. Participants receive 10 points per color correctly identified within the 40 seconds. At the end of the experiment, one of the two rounds in part 1 is randomly chosen to be payoff relevant.
In part 2, the main part of the experiment, employees report a self-set performance target before once more working on the Stroop task for 40 seconds.2 They know that the target will be communicated to an employer alongside the target of another employee and, depending on the treatment, their gender. In this respect, our design is similar to that of Dargnies et al. (2026) but with one key difference: employers do not observe employees’ past performance but only their self-reported targets.3 Using self-reported targets captures the demand side of the hiring process and mirrors the fact that managers in the real world often have to base decisions about hiring, promotions, bonuses, or project assignment on self-assessment (e.g., Exley and Kessler 2022, Trautmann et al. 2024). Employees are further aware that their payoff for this part will depend on whether they are hired by the employer. If they are hired, they receive a piece rate of 30 points per correctly identified color, and if they are not hired, they receive a much lower piece rate of 5 points. Employees thus know that their targets are nonbinding and mainly used to signal ability to the employer (i.e., they can be used for self-promotion in the spirit of Exley and Kessler 2022).
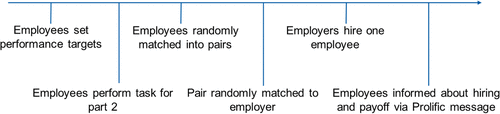
Participants are matched into groups of three consisting of two employees and one employer. The employers receive information about the self-set performance targets of both employees and, depending on the treatment, the employees’ gender. Employers then choose one of the two employees, with their own payoff depending on the chosen employee’s performance in part 2. Note that employees have already performed the task at this point, but their actual performance is not disclosed to the employer until after the hiring decision is made. Depending on the treatment, the employer’s payoff may also depend on the hired employee’s target. To maximize comparability across treatments, each employer always receives the targets of one female employee and one male employee (in all treatments). However, in the treatment where gender is not revealed, employers are unaware of this gender composition. Before seeing the employees’ self-set performance targets, employers have the opportunity to familiarize themselves with the Stroop task by trying it for 20 seconds. This brief experience helps them form an impression of what constitutes a realistic performance level. The timeline is illustrated in Figure 2.
2.2. Treatments
We employ a 2 × 2 between-subject design with treatment variation across two dimensions. On the one hand, we vary whether the employees’ gender is revealed to the employer. On the other hand, we vary whether the employer’s payoff depends on the chosen employee reaching their target. An overview of treatments and sample sizes is shown in Table 1, and the treatment variations are explained in more detail below.
|

Table 1. Treatment Overview
| Employees’ gender | Payoff for employer | |
|---|---|---|
| Piece rate | Target bonus | |
| Hidden | Piece rate hidden (n = 1,170) | Target bonus hidden (n = 1,170) |
| Revealed | Piece rate revealed (n = 1,191) | Target bonus revealed (n = 1,143) |
2.2.1. Treatments: “Hidden.”
In these treatments, employers are unaware of the employees’ gender. Employees are simply referred to as Player K and Player L.
2.2.2. Treatments: “Revealed.”
Following Bapna and Ganco (2021), we convey gender by using first names. In the gender-revealed treatments, employees are randomly allocated one of three first names based on their gender, and they are identified by these names by employers in the experiment. Employers are aware that these are allocated names and correspond to employees’ gender because we tell employers that the two employees will be assigned first names that correspond with their gender to ensure anonymity (see the instructions in Online Appendix A.1.3.3 for the exact wording). Our goal was to use three male names and three female names in the gender-revealed treatments that were similar in characteristics other than gender. For this, we used the database by Grundmann et al. (2025), who provide systematic evaluations of 20 popular names (10 male names and 10 female names) across a wide range of characteristics. We identified the names that were rated as most typical (or most average) in all characteristics for the respective gender among the 10 highly popular male and female names used in that study (see Online Appendix B.2 for details). Based on this, we used Matthew, James, or Thomas for male employees and Julia, Sarah, or Katherine for female employees.
2.2.3. Treatments: “Piece Rate.”
In the piece-rate treatments, employers receive a piece rate of 30 points for each color correctly identified by the chosen employee in the Stroop task.
2.2.4. Treatments: “Target Bonus.”
In the target bonus treatments, employers receive a piece rate of five points for each color correctly identified by the chosen employee in the Stroop task. In addition, employers receive a bonus if the hired employee reaches their target. The bonus amounts to 25 points times the stated target if the target is reached or exceeded. Otherwise, the bonus is zero.
These two treatments resemble two important situations for the employer. In piece rate, the employee’s self-set target is not directly payoff relevant but only serves as a signal of ability. In target bonus, however, it is essential for the employer that the employee meets the target because failure to meet the target can be very costly for the employer. This mirrors, for example, situations in which overambitious targets can lead to an overallocation of resources (Royal and Tasoff 2017, Russo and Schoemaker 2018) or result in failure to meet external targets and commitments (Russo and Schoemaker 1992, 2018; Dunning et al. 2004). One could also think of situations where a supposedly capable employee receives more responsibility or more important duties that can result in more costly consequences for the employer.
The payoffs for piece rate and target bonus are calibrated such that the employer’s payoff is identical in case the employees state the exact number of colors that they will correctly identify as their targets. In this case, an employer in target bonus receives 25 times the target plus 5 times the performance, and because target equals performance, the resulting payoff is identical to that in piece rate, namely 30 times the performance. Recall that in all treatments, the hired employee receives a piece rate of 30 points per correctly identified color, whereas the nonhired employee receives a piece rate of 5 points.
2.3. Expectations and Questionnaires
2.3.1. Role-Specific Expectations and Questions.
2.3.1.1. Employees.
After setting their performance target, employees were asked the following.
To state their expectation regarding the target and actual performance of the other employee (of unknown gender) they would be matched with. This was incentivized such that the employee would receive 50 additional points for each of their answers that was correct or one below or above the correct answer.4
To state their expectation regarding the performance of men and women in previous sessions. These questions were also incentivized with 50 additional points for each answer that was correct or one below or above the correct answer.
After that, employees were asked to state on a scale from 0 (not at all important) to 10 (extremely important) how important it was to them that (a) their target was realistic and (b) they would be selected by the employer.
They were further asked for their expectation regarding the criteria that the employer would use when selecting an employee.5
2.3.1.2. Employers.
After selecting an employee but before being informed about the employee’s performance in part 2, employers were asked the following.
To state the performance that they expected from each of the two employee candidates. This was incentivized such that the employer would receive 50 additional points for each of their answers that was correct or one below or above the correct answer.
To state what they thought was most important to each player when setting their target.6
Employers were further asked whether they expected women or men to identify more colors correctly in the task on a scale from 0 (women) to 10 (men).
They were also asked which was the most important criterion that they used when selecting a player.7
In addition to these role-specific expectations and questions, participants filled in two further questionnaires that were identical for employees and employers and are described in more detail below.
2.3.2. Questionnaires for Employees and Employers.
All participants answered a postexperimental questionnaire to elicit gender norms on different types of behavior in the game (such as setting an extremely high target). For each type of behavior, participants were asked to rate how morally appropriate they themselves considered this behavior and how morally appropriate they thought others would consider that behavior on a scale from 0 (extremely morally inappropriate) to 10 (extremely morally appropriate).8 We further elicited personal characteristics (such as risk attitudes, competitiveness, ambitiousness, etc.). Further descriptions and screenshots of the questionnaires can be found in Online Appendix A.2.
2.4. Procedures
The experiment was programmed and conducted in the software LIONESS Laboratory (Giamattei et al. 2020) using 4,674 participants from the United Kingdom on the platform Prolific. We applied filters on Prolific on age (range: 18–40),9 gender, English as the first language, and country of residence. Further, all participants who had previously participated in a related study were excluded. For employees, we additionally excluded Prolific users who had indicated to be color blind, which was also known to employers. All participants received a fixed participation fee and a variable bonus, which depended on the decisions and performances in the experiment and on whether their beliefs in the incentivized belief-elicitation questions were correct. For feasibility, we collected data for employees and employers sequentially, first collecting the employee data separately for each gender and then collecting the employer data. Employees were informed that they would receive their payoff in the following days accompanied by a message to inform them whether they had been hired by the employer and whether their beliefs had been correct. We split up the experiment into two large sessions. The first took place from October 20, 2022 to November 22, 2022, and the second took place from November 22, 2022 to December 15, 2022. Within each session, we randomized the order of treatments and conditions, and within each treatment and condition, we randomized whether the data were first collected for male subjects or for female subjects. We collected the data in blocks of 200 subjects because we had found in pretests that this was a feasible number to collect in about one day. All data collection took place on workdays between 8 a.m. and 9.30 p.m. UK time.
For each treatment, we first collected the data for employees of one gender, and on the next workday, we collected the data for employees of the other gender. We then randomly matched the employees into pairs such that there was one male employee and one female employee in each pair, and we randomized the order of pairs. On the following workday, we collected data for employers (half of observations per gender after each other).10 Each pair of employees was matched to an employer to form a triple.
Altogether, we aimed at collecting 400 triples per treatment (i.e., 400 female employees and 400 male employees plus 400 employers (200 males and 200 females)) for a total of 1,200 participants per treatment and 4,800 participants overall. We ended up with at least 95% of our target in all treatments. We provide balance tests for the employees in Online Appendix C.2.4. The tests show that our sample is well balanced across the four treatments. In most pre-existing participant characteristics that we obtained from Prolific (age, student status, employment status, nationality, and ethnicity), there are no to minor differences between subsamples. The share of both employed participants and white participants is slightly lower in the target bonus than in the piece-rate treatments (with a difference of roughly three percentage points each). None of the differences are statistically significant between the gender-hidden and gender-revealed conditions. There are also very few differences in characteristics that we elicited during our experiment (performance in round 1 of the Stroop task, self-reported willingness to take risks, ambitiousness, competitiveness, tendency to regret when a better outcome could have been achieved, and eagerness to reach self-set goals in life). Participants in the gender-revealed condition had a slightly better initial performance in the Stroop task (they solved 0.37 tasks more) than participants in the gender-hidden condition. Participants in target bonus indicated to be less ambitious than participants in piece rate (but they answered this question at the end of the experiment, so the experience during the experiment may have influenced this self-reported measure). All other differences are statistically insignificant.
3. Hypotheses
In the following section, we develop our hypotheses, which we preregistered on AsPredicted (108248). We preregistered a total of 11 hypotheses. In Online Appendix C.1, we show the results for the preregistered hypotheses that we do not discuss in the main body of the paper.
We expect employees to set lower performance targets in the target bonus treatments than in the piece-rate treatments. In both treatments, employees have an incentive to be chosen. However, the optimal strategy to do so is likely to differ between treatments given the diverging incentives for employers. In the piece-rate treatments, employers have an incentive to choose the highest-performing employee, which may induce employees to set high targets to signal high ability. Employers in the target bonus treatments, however, have an incentive to choose the employee who will most realistically reach their target, and only if they expect both to do so will they choose the employee with the higher target. It is thus rational for employees to set their target such that it will be considered realistic by employers, which may induce employees to set lower targets compared with the piece-rate treatments. In addition, other-regarding preferences, such as altruistic concerns (Andreoni 1990) or guilt aversion (Charness and Dufwenberg 2006), may contribute to setting lower and more realistic targets in the target bonus treatments as employers will suffer if the target is not reached. We thus formulate the following hypothesis.
Employees set lower targets in the target bonus treatments compared with the piece-rate treatments.
We further expect gender effects in self-set targets. In line with previous literature in similar settings (Reuben et al. 2014, Dalton et al. 2015, Brookins et al. 2017, Brandts et al. 2021) and in the self-promotion literature (Exley and Kessler 2022, Chang et al. 2025), we expect women to set lower performance targets than men in all treatments.
Women set lower targets than men across all treatments.
We further expect men to overstate their targets in relation to their actual performance more strongly than women (i.e., to have a larger target-performance gap). Brandts et al. (2021), for example, find overconfidence for both genders but more so for men in cheap-talk goal setting, whereas Brookins et al. (2017) find that 74% of women as opposed to 52% of men reach their goals. We expect this effect to prevail in all treatments.
The target-performance gap is larger for men than for women in all treatments.
We next turn to our predictions regarding the effect of gender information and women’s chances of being hired conditional on gender being revealed. The effect could go in two directions. Either revealing gender could lead to discrimination against women, as shown, for example, by Reuben et al. (2014), or employers may expect greater overconfidence and self-promotion among men and thus expect more realistic targets from women, increasing—ceteris paribus—women’s chances of being hired. The effect could go in both directions, and which effect outweighs the other is an empirical question. We thus formulate two hypotheses. Hypothesis 4(a) expects discrimination against women and thus a negative influence of revealing gender on women’s chances of being hired. Hypothesis 4(b) hypothesizes that employers expect less self-promotion from women than from men and correct for this difference when gender is revealed, and thus there is a positive influence of revealing gender for women.
The likelihood for female employees of being hired is lower in the gender-revealed treatments than in the gender-hidden treatments.
The likelihood for female employees of being hired is higher in the gender-revealed treatments than in the gender-hidden treatments.
A potential reason for Hypothesis 4(b), if it turns out to be true, relates to the target-performance gap that employers expect. Based on the literature on gender differences in overconfidence (see, for example, Niederle and Vesterlund 2007 or Croson and Gneezy 2009) and on self-promotion (Exley and Kessler 2022, Chang et al. 2025), we hypothesize that employers expect differences between women and men in the extent to which they overstate their targets in relation to their actual performance. We thus hypothesize the following.
Employers expect a smaller target-performance gap for female employees compared with male employees in the gender-revealed treatments.
4. Results
4.1. Employees: Target Setting
We start by presenting results for the employee side to analyze target setting based on our treatment variations and gender. Figure 3 illustrates targets separately by gender and treatment (piece rate versus target bonus).11
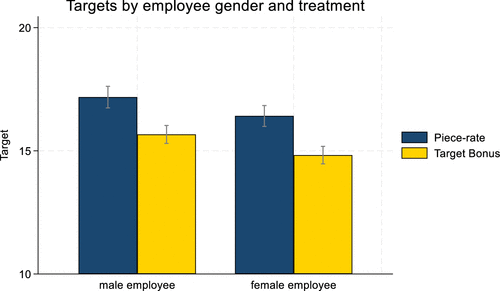
Notes. Mean self-set targets of male employees (left bars) and female employees (right bars) in the treatments piece rate (blue) and target bonus (yellow). Capped ranges indicate 95% confidence intervals. Employees set lower performance targets in the target bonus treatments compared with the piece-rate treatments, and women set lower performance targets than men across treatments.
4.1.1. Treatment Differences in Target Setting: Piece Rate vs. Target Bonus.
We first look at treatment effects in target setting using the nonparametric Mann–Whitney U test (MWU, as preregistered). Hypothesis 1 states that employees set lower targets in target bonus than in piece rate. Figure 3 shows that this is the case for both genders. The mean absolute target in piece rate equals 16.8, and it is significantly higher (by about 0.3 standard deviations) than in target bonus with 15.2 (MWU, p < 0.001). This effect is prevalent for male and female employees both when gender is revealed and when it is not. We can thus conclude in Result 1 that employees take the differing strategic incentives into account and set lower targets in target bonus along the lines of Hypothesis 1.
Employees set lower performance targets in the target bonus treatments compared with the piece-rate treatments.
4.1.2. Gender Differences in Self-Set Targets.
We next turn to gender effects in self-set targets. Hypothesis 2 states that women set lower performance targets than men in all treatments. Figure 3 confirms that women set significantly lower targets than men (by about 0.14 standard deviations) in both treatments (16.4 versus 17.2, respectively, MWU, p = 0.01 in piece rate and 14.8 versus 15.7, respectively, MWU, p = 0.001 in target bonus).
Women set lower performance targets than men.
4.1.3. Gender Differences in the Target-Performance Gap.
Hypothesis 3 predicts that the target-performance gap will be larger for men than for women in all treatments. To draw conclusions on Hypothesis 3, we compare the targets with the actual performances in round 3, which is the main round. Across all treatments, men report a target of 16.4 in round 3 and solve 20.7 colors correctly, thus setting targets that are below their actual performance. Women, on the other hand, report a target of 15.6 and solve 19.8 colors correctly in round 3, also setting targets that are below their actual performance. We measure the target-performance gap by subtracting an employee’s performance in the main round from their stated target, which is in line with our preregistration. Although the variable target-performance gap is significantly lower than zero for men and women (Wilcoxon signed-rank test, p < 0.001 for both tests; i.e., both genders set targets below their performance), there are no significant differences in the target-performance gap between the genders (MWU, p = 0.540). We thus find no support for Hypothesis 3.12
The target-performance gap is not larger for men than for women.
4.1.4. Regression Results.
In a next step, we provide parametric estimations in Table 2 to complement the nonparametric analysis and to take further control variables into account. We regress the self-set target on a dummy indicating whether gender was revealed, a dummy indicating the treatment target bonus, an interaction of gender revealed and target bonus, the employee’s ability (i.e., the employee’s maximum performance in part 1 in order to control for person-specific differences), and a dummy for whether the employee is female. In line with our nonparametric tests, the main effect for target bonus is negative and significant, indicating that employees set lower targets in the target bonus treatments. The main effect for gender revealed and the interaction effect are statistically insignificant. The coefficient for ability is significant and positive. Thus, unsurprisingly, employees with higher ability set higher targets. The coefficient for female is negative. The regression results, therefore, support our findings from before that given equal ability, women set lower performance targets than men (Table 2).13
|
Table 2. Ordinary Least Squares Regression Results for Employees (Dependent Variable: Target)
| Dependent variable: Target independent variables: | (1) Target |
|---|---|
| Gender revealed | −0.20 |
| (0.26) | |
| Target bonus | −1.77*** |
| (0.23) | |
| Gender revealed × Target bonus | 0.30 |
| (0.34) | |
| Ability | 0.68*** |
| (0.019) | |
| Female | −0.45*** |
| (0.17) | |
| _cons | 3.19*** |
| (0.43) | |
| Observations | 3,116 |
| R2 | 0.319 |
Notes. Ordinary Least Squares (OLS) regressions. Robust standard errors are in parentheses. Although revealing gender does not affect self-set targets, participants set lower targets in target bonus. Employees with a higher ability set higher targets, and female employees set lower targets than male employees given equal ability.
*p < 0.10; **p < 0.05; ***p < 0.01.
4.2. Employers: Hiring Decisions
We now turn to the employer side and analyze employer behavior with respect to variations in gender information and incentives. We start off by looking at how the target, employers’ expectations regarding employees’ performance, and the incentives for employers affect employers’ hiring decisions. In the second step, we will look at the effects of gender and gender information on being hired.
4.2.1. Hiring Decisions.
To analyze hiring decisions, we run conditional fixed-effects logit regressions with group-level fixed effects. This allows us to include data for both employees to examine which characteristics of employees within a group make them more likely to be hired, while accounting for the fact that observations within a group are not independent of each other and that some variables are exact mirror images of one another (if one employee is hired, the other is not; if one is female, the other is male, etc.). Table 3 shows the regression results. The dependent variable is a binary variable indicating whether an employee was hired by the employer.
|
Table 3. Conditional Fixed-Effects Logit Regressions (Dependent Variable: Hired)
| Dependent variable: Hired independent variables: | (1) |
|---|---|
| Hired | |
| Target | 0.21*** |
| (0.026) | |
| Expected target-performance gap | −0.29*** |
| (0.032) | |
| Target bonus × Target | −0.065* |
| (0.039) | |
| Target bonus × Expected target-performance gap | −0.18*** |
| (0.054) | |
| Observations | 3,116 |
| Pseudo-R2 | 0.197 |
Notes. The dependent variable is a binary variable indicating whether an employee was hired by the employer. Conditional fixed-effects logit regressions with group-level fixed effects are used to account for dependencies within groups. Given that the treatment does not vary within a group, it can only be included as an interaction term with variables that do vary within a group. Standard errors are in parentheses. Setting a higher target increases the chance of being hired when holding constant the target-performance gap expected by the employer, whereas a higher expected target-performance gap reduces chances of being hired. The positive effect of the target is less pronounced in target bonus, whereas the negative effect of the expected target-performance gap is stronger in target bonus.
*p<0.10; **p < 0.05; ***p < 0.01.
When employers decide which employee to hire, the only information that is common to all treatments is each employee’s self-set target. Nevertheless, it is likely that employers not only take their employees’ targets into consideration but also form expectations about employees’ ability and whether they will reach their targets. In line with our preregistration, we define the target-performance gap expected by the employer as the employee’s target minus the employer’s expectation regarding the employee’s performance in the main round. The regression shows that setting a higher target significantly increases the chance of being hired when holding the expected target-performance gap constant. The expected target-performance gap itself has a significant negative coefficient; thus, the larger employers believe an employee’s target-performance gap to be, the less likely they are to hire this employee. We additionally examine whether employers’ hiring strategy depends on the exact incentives set out in the piece-rate and target bonus treatments by including interactions of both the target and the expected target-performance gap with a dummy for the target bonus treatments. Given that the treatment does not vary within a group, we can only include it within an interaction term. The coefficient on the interaction term between the target and target bonus treatments is −0.065 (i.e., negative and substantially smaller in absolute terms than the coefficient on target (0.21) and significantly different from 0 at a 10% level). Taken together, the coefficients imply that the positive effect of the target on hiring is smaller in the target bonus treatments compared with the piece-rate treatments but that it is still present. The second interaction variable is significantly negative. In the target bonus treatments, the negative effect of the expected target-performance gap on being hired is thus more pronounced compared with the piece-rate treatments. Thus, employers are more cautious when their own payoff is dependent on the chosen employee reaching their target.14
A higher target increases the chance of being hired when holding the expected target-performance gap constant, whereas the expected target-performance gap itself has a negative influence.
The positive effect of the target on hiring is smaller in target bonus than in piece rate, whereas in target bonus, the negative effect of the expected target-performance gap on being hired is more pronounced than in piece rate.
4.2.2. Hiring Effects of Hiding vs. Revealing Gender.
In the following, we analyze the effect of gender and gender information on being hired and assess the question of whether hiding gender information is beneficial for women (and men) or not. In line with our preregistration, we test this nonparametrically. In Figure 4, we compare female employees’ chances of being hired in the gender hidden condition and the gender-revealed condition. In contrast to Hypothesis 4(a) and in line with Hypothesis 4(b), the likelihood for women of being hired is about 8% higher in the gender-revealed treatments than in gender-hidden treatments (one-sided Fisher exact test, p = 0.040). It increases by 4.1 percentage points (from 55.1% to 59.2%) in piece rate and by 5 percentage points (from 55.4% to 60.4%) in target bonus.
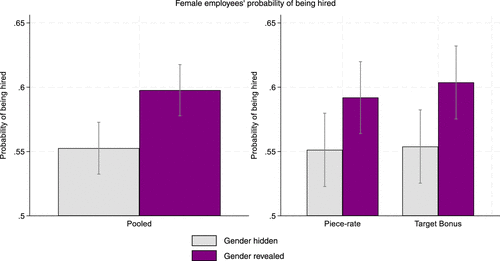
Notes. Female employees’ probability of being hired when gender is hidden (gray) or revealed (purple) pooled across treatments (left panel) and separately for treatments piece rate and target bonus (right panel). Capped ranges indicate 95% confidence intervals. The likelihood for female employees of being hired is higher in the gender-revealed treatments than in the gender-hidden treatments.
The likelihood for female employees of being hired is higher in the gender-revealed treatments than in the gender-hidden treatments.
4.2.3. Payoff Consequences of Hiding vs. Revealing Gender.
Revealing gender is more beneficial for women than it is harmful for men, while leaving employers’ payoffs unaffected. Female employees on average receive a payoff of 355.0 points in the gender-hidden treatments and a significantly larger payoff of 403.0 points in the gender-revealed treatments (MWU, p < 0.001). Male employees, however, receive a payoff of 301.9 points in the gender-revealed treatments, which is significantly smaller than their payoff of 333.9 points in gender-hidden treatments (MWU, p = 0.0095). The increase in payoffs for female employees (48.0 points or approximately 14%) is larger than the decrease for male employees (32.0 points or approximately 10%). For women, this effect is predominantly driven by the target bonus treatments, in which they receive significantly higher payoffs in the gender-revealed condition compared with the gender-hidden condition (MWU, p < 0.001). The difference in payoffs between gender revealed and gender hidden is, however, also marginally significant in the piece-rate treatments (MWU, p = 0.095). Men receive significantly lower payoffs in the gender-revealed treatments compared with the gender-hidden treatments in the piece-rate treatments (MWU, p = 0.047) and marginally significantly less in the target bonus treatments (MWU, p = 0.094).
For employers, payoffs are slightly higher in gender revealed (514.9) compared with gender hidden (506.4), but this difference is not significant (MWU, p = 0.357)—neither in the piece-rate treatments (MWU, p = 0.551) nor in the target bonus treatments (MWU, p = 0.135). Also the likelihood that an employer hires the better-performing employee is not significantly different between gender hidden and gender revealed (Fisher exact test, p = 0.149). There is, however, a significant difference between piece rate and target bonus. Employers are significantly more likely to hire the better-performing employee in piece rate than in target bonus (Fisher exact test, p < 0.0001). In target bonus, employers rather seem to care about which employee they expect to have set the most realistic target than about mere performance, which is rational given the payoff structure. Thus, from the perspective of improving women’s labor market chances and outcomes, anonymous applications seem to be counterproductive in this setting (see also Figure C.2.3.1 in Online Appendix C.2.3).
Women have higher payoffs when the gender is revealed.
4.2.4. Expected Target-Performance Gap.
In order to understand under what circumstances anonymous applications can be counterproductive, it is important to evaluate the reasons for the preferential hiring of women when gender is revealed to be able to extrapolate our results to other settings. Many studies have shown that women are generally less confident than men and are less likely to boast about their performance. We thus hypothesize in Hypothesis 5 that employers would be aware of this and therefore, expect a smaller target-performance gap for female employees than for male employees. In line with Hypothesis 5, we find that employers expect a significantly smaller target-performance gap from women than from men (1.49 for men versus 0.98 for women, MWU, p = 0.010). This effect is completely driven by female employers (2.01 for men versus 0.90 for women, MWU, p = 0.003), whereas the difference expected by male employers is not significant (0.99 versus 1.06, MWU, p = 0.521).
Employers expect a smaller target-performance gap from female employees compared with male employees in the gender-revealed treatments.
Gender differences in the expected target-performance gap—although actually being incorrect (see Result 3)—seem a plausible explanation for the preferential hiring of women in the gender-revealed treatments. If employers expect a smaller target-performance gap from women, they may prefer to hire women in order to reduce the payoff risk. But, does this fully explain the choice of women? In the regressions in Table 4, we explore this possibility. We focus on the gender-revealed condition because this is the only condition where employers can take the employee gender into account. The dependent variable is a binary variable indicating whether an employee was hired by the employer, like in Table 3. To examine whether the preferential hiring of women is present in both treatments and because different explanations might be in place, we run the regressions separately for piece rate and target bonus.
|
Table 4. Conditional Fixed-Effects Logit Regressions for the Gender-Revealed Condition (Dependent Variable: Hired)
| Dependent variable: Hired independent variables: | (1) | (2) | (3) |
|---|---|---|---|
| Gender revealed | Piece rate revealed | Target bonus revealed | |
| Target | 0.15*** | 0.20*** | 0.082** |
| (0.026) | (0.037) | (0.039) | |
| Expected target-performance gap | −0.30*** | −0.28*** | −0.37*** |
| (0.034) | (0.046) | (0.056) | |
| Female | 0.37*** | 0.35*** | 0.47*** |
| (0.080) | (0.11) | (0.13) | |
| Observations | 1,556 | 794 | 762 |
| Pseudo-R² | 0.160 | 0.119 | 0.302 |
Notes. The dependent variable is the binary variable indicating whether an employee was hired by the employer. Conditional fixed-effects logit regressions with group-level fixed effects are used to account for dependencies within groups. Standard errors are in parentheses. Female employees are more likely to be hired than male employees in the gender-revealed condition.
*p < 0.10; **p < 0.05; ***p < 0.01.
As independent variables in both regressions, we include the target, the target-performance gap expected by the employer, and a dummy indicating whether the employee is female. In line with our analysis above, the regressions show that the target has a significantly positive impact on the probability of being hired, which is stronger in piece rate than in target bonus (but not significantly). The expected target-performance gap has a significantly negative impact, which is more pronounced in target bonus than in piece rate (again, not significantly). Being female has a significantly positive impact on being hired, confirming that women are more likely to be hired than men in the gender-revealed condition. The larger coefficient for female in target bonus also suggests that women are even more preferred in treatment target bonus than in piece rate (also not significantly, Wald test).
The fact that the coefficient for female is significantly positive even when we control for the expected target-performance gap indicates that differences in the target-performance gap expected from male and female employees cannot fully explain why women are more likely to be hired.
4.3. Additional Follow-Up Survey for Employers
To gain further insights into the reasons for the preferential hiring of women, we reinvited our employers from the gender-revealed condition to participate in an additional exploratory follow-up survey (AsPredicted 130388). The additional survey collected employers’ attitudes on gender equality (two questions), expected gender differences in performance (two questions), and expected gender differences in risk behavior and overconfidence (three questions) as possible explanations for their hiring decisions. Most questions were adopted from the World Values Survey, and one question was adopted from the General Social Survey. We slightly modified the possible answers so that they were all measured on the same scale. We further elicited for each of these questions (except for the last question on the Stroop task) a descriptive social norm by asking employers to select the response that they think was chosen most frequently by other participants in the survey within a certain time frame, which we incentivized following Krupka and Weber (2013) with the possibility to earn an additional bonus of £0.50.
Specifically, we measured employers’ attitudes toward gender equality by asking whether employers are for or against preferential hiring and promotion of women on a scale from 0 (strongly in favor) to 10 (strongly against) and whether they think women or men should have more right to a job when jobs are scarce on a scale from 0 (women) to 10 (men). To measure expected gender differences in performance, we asked whether they think women or men make better business executives from 0 (women better) to 10 (men better). We also elicited an incentivized measure of expected performance differences in the Stroop task. For this measure, we provided participants with the average performance of women in the third round of the Stroop task in the gender-revealed treatments (20.5) and asked for their expectation regarding the average performance of men (for which they received an additional bonus of £0.50 if their expectation was correct). We further measured the employers’ expectations regarding gender differences in behavior (risk attitudes, overconfidence, and overstatement) by asking whether employers expect women or men to be (i) more willing to take risks, (ii) more overconfident, and (iii) more willing to say that they can do better than they can (overstatement), all on a scale from 0 (women far more) to 10 (men far more).
4.3.1. Results from the Follow-Up Survey.
In total, 541 (70%) of our initial 778 employers in the gender-revealed condition participated in our follow-up survey. Because there was some attrition, we first examine whether these employers are a representative subsample of our initial employers or whether there is significant selection bias. Participation was quite equally distributed between the target bonus and piece-rate treatments and gender. We collected data for 132 male employers and 144 female employers in piece rate revealed and 131 male employers and 134 female employers in target bonus revealed. Table C.2.2.2 in Online Appendix C.2.2 compares those employers who did not complete the follow-up survey with those who did for all observables that we have from the initial study (i.e., for both subsamples). The subsamples turned out to be balanced so that we can consider those who completed the additional survey a representative subsample of the initial sample.
In Table 5, we rerun the regressions from Table 4 for the subsample that completed the survey (columns (1) and (2) in Table 5). The coefficients and significance levels are very similar to those in Table 4, particularly in treatment piece rate.
|
Table 5. Conditional Fixed-Effects Logit Regressions for the Subsample That Completed the Survey Separately for Piece Rate and Target Bonus (Dependent Variable: Hired)
| Dependent variable: Hired independent variables: | (1) | (2) | (3) | (4) |
|---|---|---|---|---|
| Piece rate | Target bonus | Piece rate | Target bonus | |
| Target | 0.19*** | 0.034 | 0.19*** | 0.036 |
| (0.043) | (0.044) | (0.043) | (0.044) | |
| Expected target-performance gap | −0.24*** | −0.29*** | −0.24*** | −0.30*** |
| (0.051) | (0.063) | (0.051) | (0.064) | |
| Female | 0.36*** | 0.35** | 0.12 | 0.44** |
| (0.13) | (0.15) | (0.18) | (0.20) | |
| Female × Female employer | 0.47* | −0.19 | ||
| (0.26) | (0.30) | |||
| Observations | 552 | 530 | 552 | 530 |
| Pseudo-R2 | 0.104 | 0.239 | 0.113 | 0.240 |
Notes. The dependent variable is a binary variable indicating whether an employee was hired by the employer. Conditional fixed-effects logit regressions with group-level fixed effects are used to account for dependencies within groups. Given that the employer gender does not vary within a group, it can only be included as an interaction term with a variable that does vary within a group. Standard errors are in parentheses. In piece rate, the presence of a female employer increases women’s probability of being hired (column (3)), and controlling for the employer gender turns the coefficient Female smaller and insignificant. The employer’s gender explains the preferential hiring of women in piece rate (column (3)) but not in target bonus (column (4)).
*p < 0.10; **p < 0.05; ***p < 0.01.
Table 6 shows the responses to all survey questions (answers ranged from 0 to 10). Because previous studies found an in-group bias in hiring decisions and in how men and women rate men’s and women’s performances (Chan and Wang 2018, Kübler et al. 2018, Coffman et al. 2021, Fischbacher et al. 2024), we display the responses separately for female and male employers. Across the board, female employers rate women more favorably than male employers do. They are more supportive of affirmative action and giving scarce jobs to women, they have higher beliefs in women’s performance as business executives and in the Stroop task, and they believe that men are more likely to be overconfident and overstating than women.
|
Table 6. Average Survey Answers by Male and Female Employers (on a Scale from 0 to 10)
| Survey items: | Employer | Difference, significance of difference | |
|---|---|---|---|
| Female | Male | ||
| Attitudes on gender equality | |||
| In favor of affirmative action | 4.9 | 4.2 | 0.6*** |
| Women should receive scarce jobs | 5.2 | 4.8 | 0.4*** |
| Expected gender differences in performance | |||
| Women better business executives | 5.6 | 4.6 | 1.0*** |
| Women better in Stroop | 2.3 | 1.7 | 0.6*** |
| Expected gender differences in behavior | |||
| Men more risk-taking | 6.9 | 7.2 | −0.3 |
| Men more overconfident | 7.5 | 7.0 | 0.5*** |
| Men more overstating | 7.1 | 6.6 | 0.5*** |
Note. Significances of differences were according to Mann–Whitney tests.
*p < 0.10; **p < 0.05; ***p < 0.01.
4.3.2. Preferential Hiring of Women.
Can the employer’s gender hence explain the preferential hiring of women? We test this in columns (3) and (4) in Table 5. In treatment piece rate, the presence of a female employer marginally significantly increases women’s probability of being hired (significant at the 10% level). When controlling for the employer’s gender, the coefficient capturing whether the employee is female becomes much smaller and insignificant. Thus, the employer’s gender appears to explain the preferential hiring of women. In target bonus, on the other hand, the employer’s gender does not explain the preferential hiring of women. If anything, the negative (but insignificant) coefficient would suggest that female employers are less likely to hire women than male employers in target bonus.
To further explore whether the gender-related beliefs and attitudes from our additional survey explain the preferential hiring of women, we add the items from our survey to the regressions. In Table C.2.2.3 in Online Appendix C.2.2, we show the regressions separately by treatment. For treatment piece rate, we examine whether we can substitute the survey items for the female employer control variable and if the survey items do the same job of explaining the preferential hiring of women (column (1) in Table C.2.2.3 in Online Appendix C.2.2). None of the items alone can explain the preferential hiring of women, nor can they do so together.15 These results imply that in treatment piece rate, female employers, who also hold more favorable beliefs and attitudes toward women, are responsible for the preferential hiring of women.16 At the same time, we cannot narrow down the effect to specific attitudes or fully explain it with all of the attitudes included in our survey. It seems not only that female employers differ from male employers in the opinions and attitudes included in our survey but that it must be an ensemble of multiple attitudes—or taste-based discrimination in favor of in-group employees as found by Casoria et al. (2022)—that are more pronounced among female employers.
In treatment target bonus, on the other hand, the preferential hiring of women is unrelated to the employer’s gender, as we have seen in Table 5. With stricter rules on target achievement in place and because the positive coefficient of the target in Table 5 is smaller in target bonus and the negative coefficient of the expected target-performance gap is larger in absolute terms, possible explanations for the preferential hiring of women relate to the employer’s risk aversion and the fear that the target could be too high. In Table C.2.2.3 in Online Appendix C.2.2, we show that an interaction term of the employer’s risk aversion with the expected target-performance gap of each employee is highly significant and negative (column (3) in Table C.2.2.3 in Online Appendix C.2.2), implying that the negative effect of the expected target-performance gap on the probability of being hired increases with the employer’s risk aversion. The coefficient of an interaction of female employer with the expected target-performance gap is also significantly negative (column (4) in Table C.2.2.3 in Online Appendix C.2.2), implying that female employers place more weight on the expected target-performance gap so that the negative effect of the expected target-performance gap is even higher when the employer is female. The coefficient for female gradually decreases in both statistical and economic significance over these regressions, and it turns even smaller and loses its statistical significance when we additionally control for interactions of the female dummy with the employer’s expectation that men are more risk-taking than women and with the employer’s risk aversion (column (5) in Table C.2.2.3 in Online Appendix C.2.2). A joint Wald test also confirms that the sum of the coefficient for female and all interactions with the female dummy is not significantly different from zero. Taken together, the results suggest that risk preferences and beliefs drive the preferential hiring of women in target bonus.
Female employers rate women more favorably than male employers do.
In piece rate, female employers are the drivers of the preferential hiring of women. In target bonus, the preferential hiring of women is driven by risk preferences and beliefs and is unrelated to the employer’s gender.
4.4. Robustness Check: Replication with a Different Real-Effort Task
One might conjecture that our findings are task specific, given that our participants (both employers and employees) perceived women to be better at the Stroop task than men. Established gender differences in competitiveness and discrimination research have often relied on the seminal design by Niederle and Vesterlund (2007) using a number-adding task, which is typically perceived as male connotated. Previous studies indicate that gender differences in behavior can depend on the nature of the task and associated stereotypes. These studies show that the typical gender gap in competitiveness (e.g., Günther et al. 2010, Shurchkov 2012, Flory et al. 2015, Grosse et al. 2015) or self-promotion (e.g., Exley and Kessler 2022) emerges when a math task (masculine connotated) is used but not when a verbal task (female connotated) is employed. Similarly, other research finds that discrimination in hiring processes can depend on the gender connotation of tasks or jobs (e.g., Moss-Racusin et al. 2012, Reuben et al. 2014, Yavorsky 2019, Coffman et al. 2021, Eckel et al. 2021).
To address potential concerns about task specificity, we replicated our experiment using a number-adding task in the style of Niederle and Vesterlund (2007)—a male-connotated task upon which many findings on gender differences in the existing literature are based. The replication included only piece-rate treatments and varied whether gender was hidden or revealed, maintaining the same targeted sample size of 400 employers and 800 employees per condition (50% male/female). The replication was preregistered on AsPredicted (214915), and results are presented in Online Appendix C.3.
The findings are consistent with those obtained using the Stroop task. Male employees set significantly higher targets than female employees (Figure C.3.1 in Online Appendix C.3), even when controlling for ability (Table C.3.2 in Online Appendix C.3). The target-performance gap is not significantly different between male and female employees (Table C.3.3 in Online Appendix C.3). The likelihood for female employees of being hired is significantly higher in the gender-revealed condition than in the gender-hidden condition (Figure C.3.4 in Online Appendix C.3), and employers expect a smaller target-performance gap from female employees compared with male employees in the gender-revealed condition. Notably, the regression coefficients closely align with those obtained using the Stroop task (Tables C.3.2 and C.3.5 in Online Appendix C.3). Thus, we conclude that the observed effects occur in the male-connotated task as well as the female-connotated task. This speaks against pure statistical discrimination: that is, the findings do not seem to be driven by gender-related performance stereotypes but rather by preferences.
5. Conclusion
We present an experiment in which employee candidates self-report performance targets, which are displayed to employers who then hire one of two employee candidates for a task. Treatments vary along two dimensions: whether employees’ gender information is revealed and whether targets serve only as performance signals or have payoff relevance for the employer. Our experimental data show that women set lower targets than men, even when controlling for ability in the task (Result 2). Although higher targets generally increase employees’ chances of being hired, when holding an employer’s expectations about a potential target-performance gap constant, the employer’s expected target-performance gap itself has a negative influence on hiring (Result 4(a)). Remarkably, women are less likely to be hired when gender is hidden than when it is revealed (Result 5), also resulting in lower payoffs for women when their gender is hidden (Result 6). One reason is that employers expect a smaller target-performance gap from female employees compared with male employees (Result 7)—a stereotype that is incorrect as actual gaps do not differ by gender (Result 3). This stereotype is more pronounced among female employers than male employers. Female employers (who at the same time hold more favorable attitudes toward gender equality and rate women more favorably in many ways) are largely responsible for the preferential hiring of women in the piece-rate treatment. In the target bonus treatment (where the employer faces severe consequences if the employee does not meet the performance target), the preferential hiring of women seems to be related to risk attitudes and the belief that women are more prudent (Results 8(a) and 8(b)).
The finding that women set lower targets than men when controlling for ability aligns with previous research showing that women are less likely to self-promote than men (Exley and Kessler 2022, Chang et al. 2025). We contribute to this literature by demonstrating that employers may account for gender differences in self-promotion when gender is observable but cannot do so under anonymized conditions. Our findings on revealing gender complement Fornwagner et al. (2022), who find that revealing agents’ gender increases tournament entry rates when principals decide on behalf of agents whether they perform a task under piece-rate or tournament incentives. Although Fornwagner et al. (2022) do not fully explain the underlying mechanism, their results suggest that principals’ decisions are influenced by their own risk preferences, competitiveness, and confidence in agents’ performance. Our results also align with Dargnies et al. (2026) in that employers are more likely to select women when gender is revealed. In their setting, this appears to be driven by women exhibiting steeper learning curves. This mechanism does not apply in our design, where employers do not observe actual past performance. Instead, our evidence suggests that employers expect a smaller target-performance gap from female employees than from male employees (which actually reflects inaccurate statistical discrimination) (see Bohren et al. 2025). At the same time, our findings cannot be fully explained by beliefs and suggest that employers may also have a preference for hiring women. The convergence in outcomes between our study and Dargnies et al. (2026), despite different designs and underlying mechanisms, is noteworthy.
Taken together, our results suggest that anonymous applications, which probably have their merits in some settings, may in fact harm women’s chances of being hired in other settings. They may help in settings where women face negative stereotypes or blatant, likely taste-based discrimination, such as in the case of orchestras around the world in the twentieth century, as highlighted by Goldin and Rouse (2000). However, they may backfire in contexts where stereotypes and beliefs favor women: for example, when employers expect women to perform better on average, to be more prudent, or to be more realistic in their self-assessments (i.e., cases of possibly inaccurate statistical discrimination to phrase it in the words of Bohren et al. 2025). Evidence for such stereotypes has, for example, been documented by Cappelen et al. (2025) in a large U.S. general population sample; participants in their study more often believe that men fall behind because of lack of effort compared with women both in the controlled work environment of a large-scale choice experiment and in the real-world labor market and education. Even absent such stereotypes, anonymous applications may harm women when there are behavioral gender differences that work to women’s disadvantage (for example, if women set lower goals, promote themselves less, or are more likely to understate their skills or performance). Under such circumstances, revealing gender may help employers to take these behavioral differences into account and interpret application content more fairly.
Note that our results apply specifically to gender anonymity. Effects may differ for ethnicity-anonymous applications (as suggested, for example, by Kanninen et al. 2023). Examining anonymous applications with a focus on ethnicity could thus be an interesting avenue for future research—even though our results resonate with evidence on ban-the-box policies in the United States, where removing information on criminal records from applications can unintentionally harm demographic groups that include more ex-offenders (e.g., Agan and Starr 2018, Doleac and Hansen 2020).
Taken together, our findings speak in favor of using a system in which disclosing one’s gender in applications is voluntary—although Kanninen et al. (2023) provide suggestive evidence that making anonymous applications an opt-in policy for managers may not be the ideal solution either. Future research could specifically examine the effects of such an opt-in system, analyzing whether women and men differ in their propensity to reveal their gender,17 how this impacts self-reported information in the hiring process, and perhaps most importantly, how employers react to self-disclosed gender information. The results could also speak for not generally imposing anonymous applications but for instead encouraging voluntary self-blinding whenever hiring managers deem it necessary because the information could bias or distort their evaluations, as suggested by Fath et al. (2023). Future research could investigate whether such self-blinding works in our setting and whether using algorithms instead of human hiring managers could be a better solution.
The authors are grateful to Thomas Le Barbanchon, Kai Barron, Christine Exley, Ulf Rinne, Christina Elisabeth Rott, Abdolkarim Sadrieh, Sebastian Schweighofer-Kodritsch, and four anonymous reviewers as well as participants of the 2nd Passau Economics (ECON) workshop, the annual meeting of the German Association for Experimental Economic Research 2024, and the 2nd Workshop on Gender in Adaptive Design 2024 for their valuable feedback and comments. The authors thank Manuel Helten for his assistance in running the replication with the number-adding task.
1 See also Fornwagner et al. (2022), who challenge these widely assumed gender differences in behavior by showing that neither gender nor sex drive any significant behavioral differences.
2 Employees were asked to state how many colors they think they will enter correctly within 40 seconds. Employees were informed about all payoff consequences and were reminded of their performances in part 1. For the exact phrasing, see the instructions in Online Appendix A.1.2.3. Note that we used the word “goal” in the instructions and the preregistration. In the business context of our paper, we will speak of target (instead of goal) as the more common term in this context.
3 This distinction has important implications. Our design enables self-promotion (see Exley and Kessler 2022) and allows employers to form beliefs about potential gender differences in performance and self-promotion (and thus, about target-performance gaps). In contrast, Dargnies et al. (2026) provide employers with actual performance data across rounds, allowing them to form expectations about gendered learning curves. Other (less relevant) differences are that their design also includes an algorithm that can be chosen to make hiring decisions and that their incentive structure differs from ours. Furthermore, although we vary whether gender is revealed, Dargnies et al. (2026) always reveal gender and instead, vary whether the algorithm can use that information. Finally, they use different tasks in rounds 1 and 2 and a combined task in round 3, whereas we use the same task throughout. Taken together, although both designs speak to gender dynamics in hiring, they are meant to answer different research questions, and they highlight different mechanisms. Our design focuses on how employers react to gender information and self-promotion, whereas their design captures responses to observed learning and performance differences. We discuss implications of these differences in Section 5.
4 Employees were informed about the outcome of their incentivized expectations as well the hiring decision via a Prolific message afterward. We provide more details in Section 2.4 and Online Appendix A.2.3.
5 Possible answers were as follows (multiple answers were allowed): the player with the highest target, the player with the most realistic target, the player with the lowest target, any player at random, and do not know.
6 Possible answers were as follows (only one answer was allowed): the employee wanted to set a target that they could reach, the employee wanted to be selected, the employee did not really think about what they were doing, and do not know.
7 Possible answers were as follows (only one answer was allowed): the player with the highest target, the player with the most realistic target, the player with the lowest target, and a player at random.
8 Unfortunately, because of a programming error, the personal opinion was overwritten for employers such that we only have their ratings for how they think others would rate the behavior. For the employees, the two ratings are strongly and significantly correlated (Pearson correlation coefficient = 0.756, p < 0.001) such that we are confident to not have lost too much information. We deviate from the standard Krupka and Weber (2013) question by using the term morally appropriate instead of socially appropriate to avoid confusion between the terms “social” for personal opinions and “social norms”.
9 We chose this range for two reasons. First, this is the age range within which most important career choices are made, and thus, it seems appropriate to study people within this range. Second, in an earlier study, we found that performance in the Stroop task becomes worse with age, especially over the age of 40.
10 In case this was not possible (e.g., because of collection taking longer for one gender), data were collected at the earliest possible next workday.
11 To control for the subject-specific performance effects, we normalized the targets by dividing the participant’s target through their ability (i.e., their maximum performance in part 1). The corresponding Figure C.2.1.1 can be found in Online Appendix C.2.1. Because there are no big differences between the results for the absolute and normalized targets, we use absolute targets in the following if not stated otherwise, and we control for the ability in regressions using employee data on target setting.
12 The fact that both men and women do not set targets too high but rather, too low comes as a surprise but is in line with Trautmann et al. (2024). A question that may come to mind is whether employees realized that the self-set target was relevant for being hired and that the employer would be likely to select the employee with the higher target (if it seemed realistic). Figure C.2.1.3 in Online Appendix C.2.1 plots employees’ targets conditional on their expectation regarding the other employee’s target. It shows that employees try to set their target slightly above the other employee’s target unless they expect the other employee’s target to be very high (above 20). They also set lower targets in target bonus than in piece rate (i.e., they seem to take into account that employers might be more cautious in target bonus).
13 In Table C.2.1.2 in Online Appendix C.2.1, we show that these findings are robust to controlling for other employee characteristics, such as their age, their risk preferences, their competitiveness, how important it is to them to reach their goals in life, and how much regret they would feel if they could have achieved a better outcome by deciding differently, and further expectations and perceptions of the game, such as their expectations regarding the other employee’s target and performance, how important it is for them to set a realistic target, how important it is for them to be chosen, how much they were stressed by the task, and how much they enjoyed it.
14 We show in Figure C.2.2.1 in Online Appendix C.2.2 how the target-performance gap expected by employers is related to the self-set targets of employees, and we show in Result C.1.2 in Online Appendix C.1 that employers on average make a rational choice in their selection decision (i.e., they select the employee from whom they expect the highest payoff given the target and the performance that the employer expects from each employee).
15 This nonresult also holds when we group the individual items to indices.
16 This finding mirrors results by Bapna and Ganco (2021), who find that female investors favor female entrepreneurs in crowdfunding.
17 For example, Kanninen et al. (2023) show that women are more likely to apply for a job if the applications are anonymized, which could be an argument for using anonymous applications even if they do not increase women’s chances of being hired.
References
Abdul Latif Jameel Poverty Action Lab (2018) Unintended effects of anonymous resumes. Accessed May 14, 2025, https://www.povertyactionlab.org/case-study/unintended-effects-anonymous-resumes.Google Scholar- (2018) Ban the box, criminal records, and racial discrimination: A field experiment. Quart. J. Econom. 133(1):191–235.Crossref, Google Scholar
- (1990) Impure altruism and donations to public goods: A theory of warm-glow giving. Econom. J. 100(401):464–477.Crossref, Google Scholar
Antidiskriminierungsstelle des Bundes (2014) Leitfaden für Arbeitgeber—Anonymisierte Bewerbungsverfahren. Accessed May 14, 2025, https://www.wuppertal.de/microsite/competentia/medien/bindata/2023-Leitfaden-anonymisierte-Bewerbungsverfahren.pdf.Google Scholar- (2012) Do anonymous job application procedures level the playing field? ILR Rev. 65(1):82–107.Crossref, Google Scholar
- (2021) Gender gaps in equity crowdfunding: Evidence from a randomized field experiment. Management Sci. 67(5):2679–2710.Link, Google Scholar
- (2025) Explicit and implicit belief-based gender discrimination: A hiring experiment. Management Sci. 71(2):1600–1622.Link, Google Scholar
- (2015) Unintended effects of anonymous resumes. Amer. Econom. J. Appl. Econom. 7(3):1–27.Crossref, Google Scholar
- (2011) Labor market discrimination of minorities? Yes, but not in job offers. Accessed August 3, 2026, http://mpra.ub.uni-muenchen.de/33332.Google Scholar
- (2025) Inaccurate statistical discrimination: An identification problem. Rev. Econom. Statist. 107(3):605–620.Crossref, Google Scholar
- (2015) The impact of advice on women’s and men’s selection into competition. Management Sci. 61(5):1018–1035.Link, Google Scholar
- (2021) Gender differences in private and public goal setting. J. Econom. Behav. Organ. 192:222–247.Crossref, Google Scholar
- (2017) Self-chosen goals, incentives, and effort. Accessed August 3, 2026, https://www.philipbrookins.com/items/2017-10-17-EndoGoals.pdf.Google Scholar
- (2025) Experimental evidence on the acceptance of males falling behind. J. Eur. Econom. Assoc. 23(6):2212–2240.Google Scholar
- (2022) The effect of group identity on hiring decisions with incomplete information. Management Sci. 68(8):6336–6345.Link, Google Scholar
- (2018) Hiring preferences in online labor markets: Evidence of a female hiring bias. Management Sci. 64(7):2973–2994.Link, Google Scholar
- (2025) Leaning in softly: On gender and self-promotion. Preprint, submitted May 7, http://dx.doi.org/10.2139/ssrn.5240652.Google Scholar
- (2006) Promises and partnership. Econometrica 74(6):1579–1601.Crossref, Google Scholar
Chartered Institute of Personnel and Development (2022) A guide to inclusive recruitment for employers. Accessed May 14, 2025, https://www.cipd.org/globalassets/media/knowledge/knowledge-hub/guides/2023-pdfs/inclusive-recruitment-employers-guide_tcm18-112787.pdf.Google Scholar- (2022) Accounting performance goals in CEO compensation contracts and corporate risk taking. Management Sci. 68(8):6039–6058.Link, Google Scholar
- (2024) Elusive parity: Key gender parity metric falls for first time in 2 decades. Preprint, submitted June 26, http://dx.doi.org/10.2139/ssrn.4877730.Google Scholar
- (2024) Whether to apply. Management Sci. 70(7):4649–4669.Link, Google Scholar
- (2021) The role of beliefs in driving gender discrimination. Management Sci. 67(6):3551–3569.Link, Google Scholar
- (2009) Gender differences in preferences. J. Econom. Literature 47(2):448–474.Crossref, Google Scholar
- (2015) Self-chosen goals: Incentives and gender differences. Preprint, submitted March 25, http://dx.doi.org/10.2139/ssrn.2583872.Google Scholar
- (2026) Aversion to hiring algorithms: Transparency, gender profiling, and self-confidence. Management Sci. 72(1):285–301.Link, Google Scholar
- (2020) The unintended consequences of “ban the box”: Statistical discrimination and employment outcomes when criminal histories are hidden. J. Labor Econom. 38(2):321–374.Crossref, Google Scholar
- (2004) Flawed self-assessment: Implications for health, education, and the workplace. Psych. Sci. Public Interest 5(3):69–106.Crossref, Google Scholar
- (2021)
The gender leadership gap: Insights from experiments . Chaudhuri A, ed. A Research Agenda for Experimental Economics, 1st ed. (Edward Elgar Publishing, Cheltenham, UK), 137–162.Crossref, Google Scholar Eurostat (2020) Only 1 manager out of 3 in the EU is a woman … even less in senior management positions. Accessed June 12, 2024, https://ec.europa.eu/eurostat/documents/2995521/10474926/3-06032020-AP-EN.pdf/763901be-81b7-ecd6-534e-8a2b83e82934.Google Scholar- (2022) The gender gap in self-promotion. Quart. J. Econom. 137(3):1345–1381.Crossref, Google Scholar
- (2024) The gender gap in confidence: Expected but not accounted for. Amer. Econom. Rev. 114(3):851–885. Crossref, Google Scholar
- (2023) Encouraging self-blinding in hiring. Behavioral Sci. Policy 9(1):45–57.Crossref, Google Scholar
- (2024) Betting on diversity—Occupational segregation and gender stereotypes. Management Sci. 70(8):5502–5516.Link, Google Scholar
- (2015) Do competitive workplaces deter female workers? A large-scale natural field experiment on job entry decisions. Rev. Econom. Stud. 82(1):122–155.Crossref, Google Scholar
- (2022) On the robustness of gender differences in economic behavior. Sci. Rep. 12(1):21549.Crossref, Google Scholar
- (2020) LIONESS Lab: A free web-based platform for conducting interactive experiments online. J. Econom. Sci. Assoc. 6(1):95–111.Crossref, Google Scholar
- (2000) Orchestrating impartiality: The impact of “blind” auditions on female musicians. Amer. Econom. Rev. 90(4):715–741.Crossref, Google Scholar
- (2015) Explaining gender differences in competitiveness: Testing a theory on gender-task stereotypes. Preprint, submitted January 19, http://dx.doi.org/10.2139/ssrn.2551206.Google Scholar
- (2025) First names and ascribed characteristics. J. Econom. Behav. Organ. 234:107005.Crossref, Google Scholar
- (2010) Women can’t jump?—An experiment on competitive attitudes and stereotype threat. J. Econom. Behav. Organ. 75(3):395–401.Crossref, Google Scholar
- (2017) Minimising the risks of unconscious bias in university admissions—2017 update on progress. Accessed May 28, 2025, https://www.ucas.com/media/107021/download.Google Scholar
- (2023) Equity and Efficiency in Anti-Discrimination Policy: Evidence from an Anonymous Hiring Pilot. Preprint, submitted September 14, http://dx.doi.org/10.2139/ssrn.4567818.Google Scholar
- (2012a) Anonymous job applications in Europe. IZA J. Eur. Labor Stud. 1(1):5.Crossref, Google Scholar
- (2012b) Anonymous job applications of fresh Ph.D. economists. Econom. Lett. 117(2):441–444.Crossref, Google Scholar
- (2013) Identifying social norms using coordination games: Why does dictator game sharing vary? J. Eur. Econom. Assoc. 11(3):495–524.Crossref, Google Scholar
- (2018) Gender discrimination in hiring across occupations: A nationally-representative vignette study. Labour Econom. 55:215–229.Crossref, Google Scholar
- (2005) Avidentifiera jobbansökningar—En metod för mångfald. Technical Report SOU 2005:115, Sveriges regering, Stockholm. Accessed May 14, 2025, https://www.regeringen.se/rattsliga-dokument/statens-offentliga-utredningar/2006/01/sou-2005115/?utm_source=chatgpt.com.Google Scholar
- (2017) Do women have more shame than men? An experiment on self-assessment and the shame of overestimating oneself. Eur. Econom. Rev. 92:31–46.Crossref, Google Scholar
- (2012) Science faculty’s subtle gender biases favor male students. Proc. Natl. Acad. Sci. USA 109(41):16474–16479.Crossref, Google Scholar
- (2007) Do women shy away from competition? Do men compete too much? Quart. J. Econom. 122(3):1067–1101.Crossref, Google Scholar
Organisation for Economic Co-operation and Development (2023) Gender wage gap (indicator). Accessed June 16, 2023, https://data.oecd.org/earnwage/gender-wage-gap.htm.Google Scholar- (2014) How stereotypes impair women’s careers in science. Proc. Natl. Acad. Sci. USA 111(12):4403–4408.Crossref, Google Scholar
- (2012) The emergence of male leadership in competitive environments. J. Econom. Behav. Organ. 83(1):111–117.Crossref, Google Scholar
- (2017) When higher productivity hurts: The interaction between overconfidence and capital. J. Behav. Experiment. Econom. 67:131–142.Crossref, Google Scholar
- (1992) Managing overconfidence. Sloan Management Rev. (January 15), https://sloanreview.mit.edu/article/managing-overconfidence/.Google Scholar
- (2018)
Overconfidence . Augier M, Teece DJ, eds. The Palgrave Encyclopedia of Strategic Management (Palgrave Macmillan, London), 1236–1246.Crossref, Google Scholar - (2018) On the size of the gender difference in competitiveness. Management Sci. 64(4):1541–1554.Link, Google Scholar
- (2019) Gender differences in job entry decisions: A university-wide field experiment. Management Sci. 65(7):3272–3281. Link, Google Scholar
- (2012) Under pressure: Gender differences in output quality and quantity under competition and time constraints. J. Eur. Econom. Assoc. 10(5):1189–1213.Crossref, Google Scholar
- (1935) Studies of interference in serial verbal reactions. J. Experiment. Psych. 18(6):643–662.Crossref, Google Scholar
- (2024) Performance prediction and performance-based task allocation. J. Econom. Behav. Organ. 220:354–368.Crossref, Google Scholar
UK Government (2015) PM: Time to end discrimination and finish the fight for real equality. Accessed May 28, 2025, https://www.gov.uk/government/news/pm-time-to-end-discrimination-and-finish-the-fight-for-real-equality.Google ScholarWorld Economic Forum (2022) Global gender gap report 2022. Accessed June 12, 2024, https://www3.weforum.org/docs/WEF_GGGR_2022.pdf.Google Scholar- (2019) Uneven patterns of inequality: An audit analysis of hiring-related practices by gendered and classed contexts. Soc. Forces 98(2):461–492.Crossref, Google Scholar

