Estimating Customer Impatience in a Service System With Unobserved Balking
Abstract
This paper studies a service system in which arriving customers are provided with information about the delay they will experience. Based on this information, they decide to wait for service or leave the system. Specifically, every customer has a patience threshold, and they balk if the observed delay is above the threshold. The main objective is to estimate the parameters of the customers’ patience-level distribution and the corresponding potential arrival rate, using knowledge of the actual queue-length process only. The main complication and distinguishing feature of our setup lies in the fact that customers who decide not to join are not observed, and remarkably, we manage to devise a procedure to estimate the underlying patience and arrival rate parameters. The model is a multiserver queue with a Poisson stream of customers, enabling evaluation of the corresponding likelihood function of the state-dependent effective arrival process. We establish strong consistency of the MLE and derive the asymptotic distribution of the estimation error. Several applications and extensions of the method are discussed. The performance is further assessed through a series of numerical experiments. By fitting parameters of hyperexponential and generalized hyperexponential distributions, our method provides a robust estimation framework for any continuous patience-level distribution.
Funding: The research of Y. Inoue is supported in part by JSPS KAKENHI [Grant JP18K18007]. The research of L. Ravner and M. Mandjes is partly funded by NWO Gravitation Project Networks [Grant 024.002.003].
Supplemental Material: The e-companion is available at https://doi.org/10.1287/stsy.2022.0101.
1. Introduction
In many service systems, potential customers are provided with real-time information on the delay they will experience (Ibrahim 2018, Dong et al. 2019). This information, typically in terms of anticipated delay or current workload, is used by the potential customers to decide to either join the system or balk. In general, one could view balking as an implicit form of admission control; the load on the service system does not explode as a consequence of the fact that during busy periods some of the potential customers decide to leave, thus mitigating the overall congestion. This means that the system is in effect self-regulating even if the potential service demand is unknown to the administrator. To make sound decisions in designing the service system, however, it is crucial to have knowledge of the volume of the potential demand and the mechanism based on which potential customers decide to join or to leave. With this knowledge, the service provider can, for example, determine the optimal admission price or decide whether it is economically viable to increase the service capacity.
This paper is motivated by the fact that it is challenging to extract this knowledge from data when balking customers cannot be observed by the administrator. Such complication arises naturally in many service systems. The most obvious case is a physical service facility, where a visible queue (e.g., shops, parking lots, museums), sometimes even outside of the facility, will deter some of the potential customers. This has become even more prevalent recently, with social distancing measures limiting the number of people that can be inside a public space at a given time. This form of data censorship occurs also in systems that provide real-time delay data via electronic means such as dedicated apps for the service. Some examples are expected travel times in transportation services (e.g., Google Maps and Uber) and expected delivery times in food delivery services (e.g., UberEats in the United States or Deliveroo in Europe). Note that expected delay is often listed for the possible services (e.g., estimated arrival time of a taxi or delivery times for a list of Italian restaurants) even if a user does not indicate the specific service he or she is interested in, and therefore, the system cannot know whether a user balked from the service because of the delay information.
In this paper, we model such service systems with unobservable balking as an M/G/s + H queue, where the last symbol stands for the cumulative distribution function of the customer patience. More specifically, we consider a first-come, first-served (FCFS) queue with s () servers and potential customers arriving according to a Poisson process with rate . Potential customers have independent and identically distributed (i.i.d.) patience levels that are distributed as the nonnegative random variable and bring i.i.d. service requirements that are distributed as the nonnegative random variable . Customer i joins the system if Yi is greater or equal to the virtual waiting time at the moment of his or her arrival and otherwise balks without being observed. Note that although customers are homogeneous in a statistical sense, they have individual (thus heterogeneous) patience levels, so this model can clearly represent the types of customers that will effectively join the system.
We set up an estimation problem by parametrizing the patience distribution as (), where Θ denotes a compact set satisfying some regularity conditions. The goal of this work is to estimate the pair based on observation of the effective queueing process, which is constructed from records of arrival and departure times not including balking customers. As some of the customers balk, the corresponding effective interarrival times are not the usual i.i.d. exponentially distributed random variables. The effective arrival process is in fact a nonhomogeneous Poisson process whose rate depends on the virtual waiting time process. In particular, the effective arrival rate to the system when the virtual waiting time is . Note that the marginal effective arrival process is not a nonhomogeneous Poisson process with respect to time. Therefore, the dependence structure of the observations of interarrival times is directly determined by that of the virtual waiting time process. The workload-dependent arrival dynamics are utilized to derive a maximum-likelihood estimator (MLE) based on the effective interarrival observations. Specifically, the density of an interarrival time A conditional on initial virtual waiting time is given by
The Markovian dynamics of the queue further imply that the likelihood of the interarrival times conditional on the waiting times and job sizes is given by a product of densities with the above form for any sample of observations.
We further study the asymptotic properties of the proposed estimator. Importantly, the asymptotic performance of the estimator is not given by standard results due to the intricate underlying dependence structure. Indeed, so as to prove consistency and asymptotic normality, a subtle reasoning is required to make sure that the situation at hand fulfills specific regularity conditions. It is further shown that for homogeneous (deterministic) patience levels, that is, for some , the asymptotic distribution of the errors is not normal but rather exponential (with rate n and not ). The main contribution of this paper is the development of procedures for consistent estimation of the total arrival rate (that is, corresponding to customers joining the system and balking customers) and the patience-level distribution, observing the queue-length process only. Hence, somewhat counterintuitively, we can estimate load that has never been observed.
The main purpose of this paper is to lay foundations for statistical inference for congested service systems with unobserved balking. Although the queueing model considered in this paper is of course not a perfect replica of any specific real system, it does provide a methodological statistical approach for service systems where unobserved balking due to congestion is a key feature. Furthermore, the framework presented here can be extended to capture additional features such as noisy waiting time information, as will be discussed in the concluding remarks.
It is also important to stress that the framework we develop in this paper is essentially different from the extensively studied problem of estimating patience parameters from observed abandonment data (see Brown et al. 2005, Mandelbaum and Zeltyn 2013). If balking customers are observed, then the data are comprised of waiting times and corresponding indicator variables stating whether a customer joined or balked. Specifically, when it is observed that a customer i joined (resp. balked) given the waiting time Wi, the observation is of the form (resp. ). These data can be directly applied to construct an estimator for θ, for example, by applying an MLE method. If abandonment times are directly observed, then even more information is available, namely the realization of Yi for every abandoning customer, and for customers who obtained service. Note that in the above scenarios estimation of the total arrival rate is straightforward because all arrivals are observed. However, when balking is unobserved, the only information available is that of interarrival and waiting times, and therefore, indirect estimation methods are called for. Of course, there may be applications where some of the balking or reneging customers are observed, whereas others are not. For such systems, it may be reasonable to adopt a hybrid approach that uses classical patience estimation methods together with those presented in this paper. For the sake of brevity, we assume throughout that balking happens immediately and is not observed by the system operator so that no data regarding the balking customers is available for estimation purposes.
1.1. Contributions
We proceed by detailing our paper’s contributions. The focus is on developing estimators with provable performance guarantees. Notably, setting up our estimator is straightforward in the sense that it relies on a closed-form expression for the likelihood and does not require any queueing-theoretic analysis. As a result, even for models for which stationary performance analysis is involved (or intractable), parameter inference can be done in a relatively direct manner. Our contributions relate to (i) our estimator and its asymptotic properties, (ii) results and experiments for specific patience-level distributions, and (iii) extensions and ramifications.
Framing the system described above as a queueing model with impatient customers, we can evaluate the corresponding likelihood function (in terms of the observed quantities). This means that, in a parametric context, we can estimate the unknown parameters — that is, λ and the parameter(s) θ corresponding to the patience level Y — relying on a maximum-likelihood procedure. The estimation method has several attractive features, the most prominent one being that it does not require simultaneous estimation of the service requirement distribution or even making any distributional assumption about it. In addition, our methodology uses the fundamental queueing dynamics and does not, as is common in the literature, rely on any fluid and/or diffusion approximations.
In the case of a continuous patience-level distribution, we prove, under appropriate regularity conditions, strong consistency and asymptotic normality of the resulting estimation errors (scaled by ). The proof of the asymptotic normality relies on an application of a suitable version of the martingale central limit theorem.
In the case that the patience level Y is constant (i.e., for some θ), more refined results can be obtained. Most notably, we show that the estimation error (scaled by n) converges to an exponential distribution with a parameter that depends on the stationary workload density at θ and the loss probability of customers.
A number of other special cases are dealt with, covering exponentially and (generalized) hyperexponentially distributed patience levels; we present closed-form expressions for the asymptotic variance of the estimation error. The class of generalized hyperexponentially distributions is highly relevant for various reasons, most importantly because these can be used to approximate any positive continuous distribution arbitrarily well (Botta and Harris 1986). In addition, in the call center literature (Roubos and Jouini 2013), it has been observed that such distributions yield a good fit for observed customer patience in terms of the time until abandonment. We provide several numerical examples that illustrate the robustness of our methodology. Indeed, our experiments show that even if the patience-level distribution is misspecified (i.e., is not generalized as hyperexponential itself), the distribution function of the estimated generalized hyperexponential distribution is still remarkably close to the true one.
We also discuss several ramifications and model extensions that can be handled using our framework. These include extending the framework to a system with noisy delay information, estimating the proportion of impatient customers in the population, and estimating specific utility parameters such as service value and waiting time sensitivity.
1.2. Related literature
There is a substantial body of literature on queues with impatient customers. Without attempting to provide an exhaustive overview, we include a brief account of the various research lines. Naor’s influential paper (Naor 1969) can be seen as a pioneering contribution to the field of “behavioral queues.” It presented a powerful stylized model for a queueing resource in which potential customers decide to join or to balk based on delay information. Since then, performance and economic analysis of queueing systems with balking customers has been studied extensively. In particular, the effect of providing workload information to strategic customers was investigated in, for example, Guo and Zipkin (2007, 2008). Many other model variations are reviewed in Hassin and Haviv (2003) and Hassin (2016). More background on applied probability and queueing systems in a general context is provided in, for example, Assmussen (2003) and Dębicki and Mandjes (2015).
For various specific types of queueing systems with impatient customers, explicit performance results are known; see, for example, Boxma et al. (2010, 2011), Liu and Kulkarni (2006, 2008), and Mandelbaum and Shimkin (2000, 2004). Importantly, however, the estimation techniques presented in our paper do not require knowledge of, for example, the queue’s stationary distribution. It is also worth stressing that despite the fact that queues with impatient customers are well studied, to the best of our knowledge, hardly any workload-based estimation techniques have been developed. A notable exception is Gorst-Rasmussen and Hansen (2009), featuring an asymptotic analysis of statistical inference of waiting times truncated by abandonments; our setting, however, is crucially different from the one in Gorst-Rasmussen and Hansen (2009), because in the latter, abandoning customers and their sojourn times are observed.
There are various papers on estimation problems in the setting where all customers join but leave when getting impatient; examples are Courcoubetis et al. (1995), Akşin et al. (2013), Mandelbaum and Zeltyn (2013), and Yefenof et al. (2022). Importantly, this setting is crucially different from ours, in which the balking customers are not observed. In this branch of the literature, the challenge lies in the fact that for customers who are served, we have just a lower bound on their impatience time, making this a “right-censored” estimation problem.
Another related research direction concerns the so-called queue inference engine, a setting in which one does not observe the arrival process of the customers but rather the ordered service entry and service completion times (so-called “transactional data”); see, for example, Larson (1990) and Daily and Servi (1998). One comes across this situation when considering, for example, automatic teller machines, where the queue of customers waiting for the machine (and in particular their arrival times) is not observable, but the transactional data are recorded. In Daley and Servi (1998), a multiserver queue is considered, but with the specific feature that balking is assumed to occur when all servers are busy upon arrival, with a fixed probability independent of the queue length, making the underlying queueing dynamics fundamentally different from ours.
Strictly speaking, Negahban (2019, 2022) did not deal with transactional data; it is assumed that the interarrival times corresponding to the nonbalking customers are observed (so that its scope is somewhat similar to ours). At the methodological level, however, Negahban (2019, 2022) crucially differed from our approach; the proposed estimation procedure relies on discrete-event simulation rather than a rigorously backed maximum-likelihood procedure.
Our work fits in the larger branch of the literature on inference for queues. This domain focuses on estimation problems where the queue is observed (for instance periodically), with the objective to estimate its input parameters. We refer to Asanjarani et al. (2021) for a broad recent overview of this area. Examples are the procedures for the M/G/1 queue, as presented in Hansen and Pitts (2006) and den Boer and Mandjes (2017). We also refer to the Poisson-probing based approach (Ravner et al. 2019) for Lévy-driven queues (Dębicki and Mandjes 2015) and the general framework presented in Duffie and Glynn (2004), as well as the corresponding hypothesis-testing problem (Mandjes and Ravner 2020). Some approaches rely on exploiting knowledge of the queue’s tail probabilities (Courcoubetis et al. 1995, Glynn and Zeevi 2000, Duffy and Meyn 2011). A related line of research concerns the detection of stability or instability of queueing networks; see the Monte Carlo-based methods of Leahu et al. (2017) and Mandjes et al. (2017).
The main conclusion from the above is that, despite the mature literature on queues with impatient customers and related estimation problems, there is a lack of methodologies that can deal with the situation in which balking customers are not observed.
1.3. Paper Organization
This paper is organized as follows. In Section 2 we describe the model featuring in this paper and introduce the notation used. In addition, we present a number of known results on queues with customer impatience that are relied on later. Then, in Section 3, we construct and analyze our maximum-likelihood estimator. For continuous patience-level distributions, we prove strong consistency and asymptotic normality of the estimation error. The case of deterministic patience is treated separately, leading to a similar conclusion regarding strong consistency, but with the notable difference that in this case the limiting distribution of the estimation error is exponential. Section 4 provides detailed analysis of the MLE for exponential, hyperexponential, and generalized hyperexponential patience distributions, the latter cases being relevant because they can be used to approximate the distributions of arbitrary nonnegative random variables. This includes explicit analysis of the likelihood function and its corresponding asymptotic variance as well as simulation experiments assessing the performance of the estimators. Section 5 illustrates how the method can be utilized for several applications. In Section 6, we provide concluding remarks and directions for followup research, including a brief discussion of a nonparametric estimation procedure.
2. Model and Preliminaries
In this section, we provide a detailed model description, introduce the notation used throughout this paper, state the objective of the paper, and present preliminaries.
2.1. Model Description
We consider a service system with s servers (). Potential customers arrive at the service system according to a Poisson process with rate λ. Each customer has a service requirement with cumulative distribution function (cdf) and a patience level with cdf . We define B and Y as the generic random variables corresponding to service requirements and impatience levels, respectively. The interarrival times , the service requirements , and patience levels are independent sequences of i.i.d. distributed random variables. Customer i joins the queue if Yi is smaller than or equal to the waiting time he or she will experience. More specifically, let V(t) (for ) denote the virtual waiting time at time t, which is defined as the time it would take before at least one server becomes idle if no customers have joined the system after time t:
(i) When servers are busy, the virtual waiting time equals zero, whereas the workload equals some positive value and decreases with slope i as time passes without effective arrivals.
(ii) When all s servers are busy, the virtual waiting time and the workload decrease with slope 1 and s, respectively, as time passes without effective arrivals.
Figure 1 illustrates an example of the realization of the virtual waiting time process for s = 2. The actual waiting time of a customer arriving at time t equals so that a customer balks if the virtual waiting time just before the arrival instant exceeds the customer’s patience threshold. The resulting system can be considered as an M/G/s queue with impatient customers.

Because some customers will balk, there will be a difference between the interarrival times of the customers (covering both the balking and nonbalking customers) on one hand, and the effective interarrival times (covering just the nonbalking customers) on the other hand. Throughout this paper, the sequence of effective interarrival times is denoted by . Importantly, observe that the random variables Ai are generally neither identically distributed nor independent. We can reconstruct them from the sequences , , and in the following manner. For the following construction, we let a nonbalking customer arrive at time t = 0, as will be further motivated in Remark 1. Denoting the virtual waiting time process at time t by V(t), we have that , where
Similarly, , where
Observe that ji has the interpretation of being the index of the i-th nonbalking customer. Let denote the i-th effective arrival time. We denote the upward-jump size in the virtual waiting time caused by the i-th joining customer by . In the single-server case (s = 1), we have . In the multiserver case (), on the other hand, Xi takes a complicated form, depending on both the queue-length and the residual service times of customers in service seen on the arrival instant. For a single-server system (s = 1), Figure 2 illustrates the workload process during a single busy period for the case of deterministic patience, that is, for some . The building blocks of our framework, viz. the interarrival and service requirements and their effective counterparts, are highlighted in the figure. It is stressed that the distribution of the effective interarrival times can significantly deviate from the (exponential) distribution of the interarrival times. Figure 3 illustrates this effect for two different patience-level distributions. In addition, as mentioned, the effective interarrival times are not independent, as opposed to the interarrival times.

Notes. The dotted red lines mark arrival instants of new customers. Arrivals 3 and 5 observe a virtual waiting time level above θ and immediately balk, and thus the virtual waiting time continues to deplete as if there was no arrival. Although six customers have arrived during the busy period, only four effective interarrival times and service requirements are observed, namely , being equal to .
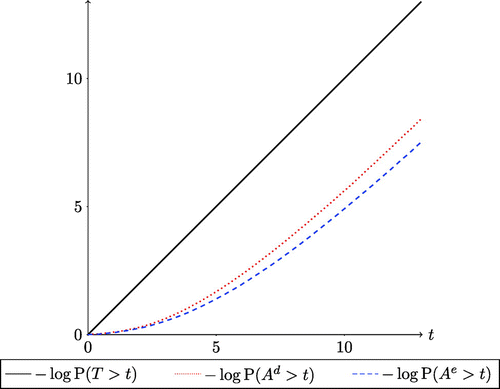
Notes. Simulation of the tail distributions of the stationary effective interarrival times is illustrated for two cases: Ad corresponds to deterministic patience levels with θ = 3 (dotted red), whereas Ae corresponds to exponentially distributed patience levels with mean 3 (dashed blue). The service requirements in the example are Erlang distributed with parameters . The plotted stationary effective interarrival distributions are given by the empirical distribution obtained by simulating effective arrivals for each of the cases.
We focus on the case that the patience-level distribution is determined by a parameter θ that is a vector in for some (known) , entailing the estimation problem is parametric. In addition, the arrival rate λ is to be estimated, which is evidently of a parametric nature as well. Alternatively, θ could be a function from some more general space, rendering the estimation problem nonparametric; in Section 6, we briefly discuss an approach that can be used in this setting. Throughout this paper, we assume that we observe the full queue-length process. This in particular means that we observe the arrival and departure epochs of the nonbalking customers (and that we do not observe the balking customers at all). The objective is to use this information to somehow learn the true arrival rate and the parameters of the patience-level distribution. More concretely, we wish to devise statistical procedures for estimating the arrival rate λ and the distribution of the patience Y (both corresponding to nonobservable quantities) with provable performance properties.
2.2. Stationary Distribution
We assume that the mean service time is finite and that, with denoting the traffic intensity,
Under these assumptions, we have that the queue is stable and that a stationary queue-length and a stationary virtual waiting time exist (see Baccelli and Hebuterne 1981 and Baccelli et al. 1984). Note that holds only if there are customers with infinite patience, that is, . If , on the other hand, then we have , so that the system is stable irrespective of the value of the traffic intensity ρ. As we will see, the MLE method to be developed relies only on the transient dynamics of the system so that it can be applied even if the stability condition (2) is not satisfied. On the other hand, we will utilize the system stability to discuss the asymptotic properties of the proposed estimator.
For the M/G/s queue with impatient customers, exact expressions for the distributions of the stationary queue-length Q and virtual waiting time V are not known in the literature. However, we can derive the following relations they satisfy in a similar way to the single-server case (Kovalenko 1961). Let () denote the probability mass function of the stationary queue length. The stationary virtual waiting time distribution has probability mass at zero, and it is absolutely continuous on . Let denote a generic random variable for the stationary upward-jump size X conditioned that it takes a positive value and that the immediately preceding virtual waiting time equals y:
With the level-crossing argument, we can verify that the density function v(x) of the stationary virtual waiting time satisfies the following integral equation (cf. Boxma et al. 2011):
Owing to the PASTA property, the virtual waiting time seen by an arriving customer has the same distribution as the stationary virtual waiting time V. The stationary waiting time W of a nonbalking customer is thus given by a conditional random variable . We can thus identify and the probability density function (pdf) of W in terms of the stationary virtual waiting time distribution :
For s = 1, (3) simplifies to
In some special cases, the expression (7) for the virtual waiting time density can be further simplified, as shown in the examples below.
(Constant Patience Levels). We consider the case that the patience levels take a constant value θ0 (for some ). Let (for ) denote the n-fold convolution of the pdf of the equilibrium distribution of the service times and the corresponding cdf. Also, define by
We then have, by de Kok and Tijms (1985) and Inoue and Takine (2015), with as usual “” denoting the convolution operator,
(Exponential Service Times). If the service times follow an exponential distribution with mean , we have, by Stanford (1979) and Inoue and Takine (2015), that
Observe that if the patience distribution is also exponential with rate θ, then the expressions can be simplified by substituting .
3. Parametric Estimation Procedure
In the setting considered, we focus on the first nonbalking n + 1 customers. We set the time origin t = 0 to the time instant that a nonbalking customer joins the system. We record the effective arrival times and departure times. From this information, we can fully reconstruct the virtual waiting time process using (1); in particular, we obtain the sequence of virtual waiting times observed by the nonbalking customers and the sizes of upward jumps caused by them. In this section, the goal is to estimate in a parametric context the arrival rate and patience-level distribution from the data.
The crucial observation is that we can construct a likelihood function of the patience-level distribution using an observed sample of effective interarrival times , waiting times , and upward-jump sizes , which can be reconstructed from the observed sequences mentioned in the previous paragraph. We work under the natural assumption that the observed system is in stationarity, so that W0 is the stationary waiting time of a nonbalking customer and X0 is a stationary upward-jump size.
To make the sequence of waiting times stationary, we should let the time origin coincide with an arrival instant of a nonbalking customer. The validity of this statement can be argued as follows.
We first point out that the sequence of waiting times is in general not a Markov process; only for s = 1 it is. We obtain a Markov process when considering the vector of residual service times at effective arrival instants. The waiting times and upward jump sizes are in fact measurable functions of this process. Therefore, in what follows, we let the underlying Markov process of residuals be stationary.
First, it is observed that assuming the virtual waiting time at time t = 0 being stationary does not imply that the waiting time W1 of the first customer follows the stationary distribution W. To see this, consider (for simplicity) an ordinary M/G/s queue (that is, without customer impatience). If the virtual waiting time at time t = 0 follows the stationary virtual waiting time distribution V, then the first customer arriving after time t = 0 finds an idle server with probability
Because the stationary waiting time W has the same distribution as the stationary virtual waiting time V in the ordinary M/G/s queue (due to PASTA), we find the inequality
This shows that the waiting time W1 of the first-arriving customer is biased in that it is not distributed as W.
Intuitively, the bias is a consequence of the fact that a customer arriving after a long interarrival time is more likely chosen as the first arriving customer in our experiment (cf. the well-known inspection paradox in renewal theory), and such a customer tends to observe the system less congested than time average. It is easily seen that letting time t = 0 correspond to the arrival instant of a nonbalking customer makes the sequence of waiting times stationary. □
Let denote the complementary cdf of patience levels. Also, we denote by the probability of a customer joining when the virtual waiting time equals :
Note that for continuous patience distributions.
We next describe the construction of the likelihood function. We first recall that the effective interarrival times are not exponentially distributed because of the fact that between two effective arrival instants there may have been arriving customers who observed a virtual waiting time level exceeding their patience level (as depicted in Figure 3). Despite this, we can still characterize the effective interarrival time distribution in terms of the observed quantities. To see this, suppose that, for some , there have been no effective arrivals in the interval . An arrival in then occurs with probability , as . The corresponding customer joins the system (i.e., becomes effective) with probability because (i) the virtual waiting time seen on the arrival equals and (ii) for x < 0. Therefore, the occurrence of the next (i.e., the i-th) effective arrival follows a time-inhomogeneous Poisson process with time-dependent intensity . Noting that (for ), we thus conclude that
This representation of the distribution of the effective interarrival times facilitates the evaluation of the likelihood. The (conditional) likelihood function for given and is given by the product of the conditional densities
This yields the conditional likelihood function
In the rest of this section, we assume that the patience-level distribution is characterized by a finite-dimensional vector of parameters . For , let , and denote , and given parameter θ, respectively. Let any , with , be identifiable in the conventional Kullback-Leibler sense. The maximum-likelihood estimator (MLE) of is then given by
In the sequel, we provide an asymptotic analysis describing the performance of this MLE. We first focus, in Sections 3.1 and 3.2, on the parameters pertaining to the patience only; that is, the estimation does not cover the arrival rate λ. The object of study is, in self-evident notation, for given,
Extending this to a procedure to also include estimation of the arrival rate is relatively straightforward; we get back to it in Section 3.3.
Observe that L is a conditional likelihood and not a full likelihood. This is due to the fact that the upward jump-sizes Xi have an elaborate distribution both marginally and jointly with the waiting times. The exception is the single-server case where and is independent of the previous waiting and arrival times. Hence, for s = 1, the maximization of with respect to them is equivalent to that of the unconditional likelihood function for . It is noted that the procedure to estimate θ does not require the simultaneous estimation of the service requirement or upward-jump size distributions.
In more detail, the remainder of this section is organized as follows. First, we establish (in Section 3.1) conditions for strong consistency and asymptotic normality of our estimator of the patience parameters, with the errors scaled by , focusing on continuous patience-level distributions. We then consider (in Section 3.2) the case of deterministic patience and establish consistency (independently) for this case as well. It is noted that in the latter case the asymptotic errors are not normally but rather exponentially distributed, with the errors scaled by n. This is due to the fact that for deterministic patience the MLE is obtained on the boundary of the sample data, much like in the well-known case of estimating the parameter θ of a uniform distribution on . As mentioned, Section 3.3 discusses the estimation of the arrival rate.
3.1. Continuous Patience-Level Distribution
This subsection covers the asymptotic performance of the MLE for the case that the patience-level distribution is continuous and parametric. Let θ0 denote the true parameter. Throughout the following analysis, the underlying probability measure is , that is, the probability measure corresponding to the true patience-level distribution. For the asymptotic results, we make the following assumptions, which will be discussed in Section 3.1.1.
The following assumptions are imposed:
(A1) The parameter space is a compact set such that the true parameter lies in the interior of the set, that is, .
(A2) The observation period commences at t = 0, which corresponds to the stationary arrival instant of a nonbalking customer, and thus the sequence of waiting times is stationary.
(A3) Let . Depending on whether the right endpoint
takes a finite value or not, we assume one of the following properties: (i) If , then there exists a positive nondecreasing function such that and for some constants ,(ii) If , then there exists a positive nondecreasing function such that and for some constants ,(A4) The gradient vector and Hessian matrix of are continuous with respect to θ. With denoting the Hessian matrix of the log-likelihood corresponding to a single waiting time in stationarity has finite elements in all coordinates for any .
(A5) The collection of functions is equicontinuous; for any and there exists a such that for any y such that uniformly over all .
We now state the main results of this subsection. In the sequel, denotes a normally distributed random variable with mean vector μ and covariance matrix
If Assumptions (A1)–(A3) and (A5) are satisfied, then, as ,
If Assumptions (A1)–(A5) hold, then, because ,
The proofs of the above theorems are provided in Section 3.1.2 after the detailed discussion of (A1)–(A5) that we give in Section 3.1.1.
3.1.1. Discussion of Assumptions.
We next provide more background on the assumptions imposed. In addition, we discuss their possible relaxation.
(1) Assumption (A1) is natural, because it requires that the parameter space is big enough so that it contains the true parameter. In practice, the parameter space can be adjusted on the fly, for example, if for large n we obtain boundary solutions for the first-order conditions.
(2) Assumption (A2) facilitates the use of known results on the convergence of stationary dependent sequences. Note that, as long as a stationary virtual waiting time distribution exists (for which we have given the condition as Equation (2) in Section 2), the same results should hold without making this assumption because of the regenerative nature of the process. However, without this assumption, the conditions for both consistency and asymptotic normality are harder to verify. In particular, the crucial step for consistency is the uniform convergence of the log-likelihood, established in Lemma 1 below. More elaborate conditions for uniform convergence are detailed in, for example, Ranga Rao (1962), Andrews (1987), and Pötscher and Prucha (1989).
(3) If there are patient customers who do not balk regardless of the waiting time, that is, , then Assumption (A3) requires that the parameter space Θ is chosen so that the existence of patient customers () is assumed for all , which is a reasonable assumption in modeling a service system where both patient and impatient customers exist. In the case of , on the other hand, Assumption (A3) requires that the decay rate of does not vary too strongly among the distributions , with θ in the parameter space Θ. In practice, this assumption is seldom violated. For example, if the true patience-level distribution decays exponentially, that is, for some and c > 0, then (A3) is satisfied if the infimum tail function does not decay faster than the doubly exponential function (which evidently decays exceptionally fast). As another example, supposing that the true patience-level distribution obeys a power law, that is, for some k > 0 and c > 0, then (A3) is satisfied if does not decay faster than .
(4) Assumption (A4) enables the construction of a standard martingale CLT for the asymptotic distribution of the estimation error of the MLE. It is not a necessary condition, but in cases where the assumption is not satisfied, one is typically required to apply ad hoc analysis to derive an asymptotic distribution. In Section 3.2, we show that for a deterministic patience level that does not satisfy (A4), the asymptotic distribution of the error is exponential and not normal. Assumption (A2) implies that the expectation of the Hessian matrix of the log-likelihood is the covariance matrix of the gradient, and thus it is always positive definite. As a consequence, one just needs to verify that the coordinates are finite for (A4) to hold.
(5) The equicontinuity assumption (A5) enables concise analysis and can be verified for many continuous patience-level distributions. For example, if there exists a bounded density for every , then it is Lipschitz continuous, and a uniform bound is given by the supremum of the constants in the compact set Θ. The assumption does not hold if the support of the distribution depends on θ. If has some discontinuities (with respect to x), one could pursue replacing (A5) by an appropriate upper semicontinuity assumption; see theorem 16b in Ferguson (1996) and Pötscher and Prucha (1989). We will present such an example in Section 5.1. Our asymptotic results may hold by replacing (A5) with (A4) and verifying additional measurability conditions on for a neighborhood of any (see Andrews 1987, corr. 2).
3.1.2. Proofs.
From (14), first note that we can express the log-likelihood by
Observe that we replaced with because is continuous.
With existing, because , the continuous mapping theorem yields
The key step in the proof of Theorem 1 is establishing a uniform version of (18); then, strong consistency follows by the methodology of Wald (Ferguson 1996, chapters 16 and 17). The virtual waiting time observations are not independent, but by (A2) they are stationary so that we can apply a uniform law for stationary sequences that is commonly used in the econometrics literature. We rely specifically on a theorem taken from Ranga Rao (1962) and its extensions, in particular the ones developed in Andrews (1987) and Pötscher and Prucha (1989). The uniform convergence is established in Lemma 1 (proven in the Appendix).
If Assumptions (A1)–(A3) and (A5) hold, then, because ,
Observe that the strong consistency follows from the identifiability property (19) and from Lemma 1. Note in particular that the proof of Ferguson (1996) (theorem 17) does not rely on i.i.d. observations once uniform convergence has been established, and so the same steps can be applied here. In particular, a sufficient condition (relying on uniform convergence for strong consistency when observations are dependent) can also be found in Heijmans and Magnus (1986); for every , there exists a neighborhood such that
We continue by proving asymptotic normality that was stated in Theorem 2. This amounts to showing that the estimation error is asymptotically normal because , assuming that (A1)–(A5) are satisfied. To this end, we apply the well-known delta method and an appropriate version of the martingale CLT (see, e.g., Heyde 1997, theorem 12.6).
For any given v, we let and denote the gradient and Hessian, respectively, of . These are both continuous with respect to any coordinate θk as a consequence of (A4). Thus, both the gradient and the Hessian of the log-likelihood are continuous functions. These are given by and , respectively, where, for ,
Following the lines of the standard delta method (van der Vaart 1998, chapter 3), we consider the expansion of at the MLE around the true parameter:
If , then because of the strong consistency that we found in Theorem 1, we have, because , that
Furthermore, because by assumption (A1), the smoothness assumption (A4) implies that, as n grows large, converges to a concave function, and the MLE is given by a sequence of roots satisfying ; that is, from some N on there is no boundary solution for any with probability one. Therefore, (24) yields, with
We are thus left with showing Lemma 2 below; its proof is given in the Appendix.
If (A1)–(A5) hold and is a positive definite matrix with finite elements, then (a) as , and (b) as ,
3.2. Constant Patience-Level MLE
We next consider the case where all customers have the same patience level θ0, that is, ; observe that in this case the stability condition (2) is always satisfied, but the continuity assumptions of Section 3.1 do not apply. As we will see, in this case the properties of the MLE are markedly different from those identified in Section 3.1.
In this setting, the likelihood function (14) reduces to, with the event denoting and its complement,
Observe that (i) equals zero for , (ii) has an upward discontinuity at and decreases for
Although the estimator is clearly biased (which follows from for all n), we show that it converges almost surely to θ0 as . In addition, we prove that the estimation error scaled at rate n converges to an exponential random variable.
Because ,
The proof of Theorem 3, which is given in the Appendix, constructs lower and upper bounds for the MLE and establishes that they both converge to θ0. The same bounds are also used to characterize the asymptotic distribution of the estimation error.
3.3. Estimating the Arrival Rate
Where in the preceding subsections we focused on estimating the patience-level distribution (in a parametric context) for a given value of the arrival rate λ, we now discuss the estimation of λ. Let λ0 denote the true value of λ. There are several ways to estimate it, the most basic one relying on the idle period observations. Denote the duration of the k-th idle period by Ik, where in the multiserver setting (s > 1) an idle period refers to time intervals such that at least one server is idle. Denote by Ek the total number of effective arrivals during idle period (meaning, for instance, Ek = 1 for all when s = 1). Let Cn denote the number of idle periods observed up until (and including) the n-th effective arrival. Then we propose the estimator
The rationale behind this estimator is that there is no balking during idle periods because the virtual waiting time is zero. Hence, the arrival process during these idle times is homogeneous Poisson with rate λ. Therefore, the estimator is a standard MLE of the rate parameter of an exponentially distributed random variable and satisfies all desired asymptotic properties.
Of course, the above procedure does not exploit a substantial amount of potentially useful data that is collected during busy periods. For the case of a deterministic patience level θ0, the above estimator is easily improved upon. Recall that was defined as , with the immediate consequence that . Supposing we observe an arrival such that immediately after this arrival the virtual waiting time level is still below the current value of the estimator, then the next arrival is an effective arrival and hence, occurs after an exponentially distributed random variable with rate λ. In this way, we generate more observations, thus allowing us to estimate λ with a better precision. Observe that the new observations and the idle times form an i.i.d. sequence.
For the case of a continuous patience-level distribution, one may use (33) or, alternatively, set up a joint MLE for λ and θ. The latter has clear advantages, in particular for small samples or heavily loaded systems. Because the log-likelihood function (17) is a smooth and concave function with respect to λ, the MLE of the arrival rate for any estimator of θ is
The asymptotic results of Section 3.1 can, therefore, be extended in a straightforward manner so as to cover the joint estimation of . We demonstrate this in Section 4.1, where we detail a procedure for jointly estimating the arrival rate and the patience parameter for the case of an exponentially distributed patience level.
4. Exponential and Generalized Hyperexponential Patience
In this section, we discuss a robust and practical approach for estimating continuous patience distributions. In our approach, this is achieved by fitting the MLE of a generalized hyperexponential (GHE) distribution. This approach is attractive because the class of GHE distributions is known to be dense in the space of nonnegative continuous distributions (see, for instance, Botta and Harris 1986), which, in practical terms, means that any nonnegative continuous distribution can be approximated arbitrarily closely by a GHE distribution. In our simulation-based experiments, highly accurate estimates are obtained, even when the baseline patience distribution itself is not GHE.
We first provide a detailed analysis of the joint MLE for the arrival rate and the single parameter of an exponential patience distribution to then move to the cases of hyperexponential and generalized hyperexponential patience distributions. We also present a heuristic search method that fits an approximate GHE distribution for any continuous patience distribution.
4.1. Exponentially Distributed Patience
Suppose that the arrival rate λ0 is unknown and that the patience-level distribution is exponential, that is, for an unknown θ0 (and ). Because of (17), it can be verified, by distinguishing between the cases and , that the log-likelihood for a single observation is
Our objective is to analyze the MLE of both λ and θ for a sample of size n, which we denote by . We assume that (A1) and (A2) hold, that is, compact parameter space and stationary W0. In addition, (A3) holds because is exponential for all . The log-likelihood is Lipschitz continuous (with respect to the observations), and so (A5) holds. We thus have that Theorem 1 holds and the MLE for is strongly consistent.
Clearly, this is a smooth function. We proceed by computing the gradient and Hessian with respect to . It takes some elementary calculus to verify that gradient is given by
For any given value of θ, is a concave function in λ, and therefore, the MLE of (34) is given by
The MLE now follows by maximizing for . The optimizing θ is obtained either on the boundary of the parameter space Θ or by solving the first-order condition . Because , we are guaranteed to find an interior solution as long as .
Taking second derivatives, we find that the entries of the Hessian matrix are given by
Because is a bounded function on for any and , we conclude that , and therefore, (A4) applies, which implies that Theorem 2 holds. In particular, because ,
We performed numerical experiments to assess the performance of the estimation procedure. Table 1 presents approximated confidence intervals for the maximum-likelihood estimators ; in addition, we also evaluated the estimator of the arrival rate based on idle periods, denoted by , as discussed in Section 3.3. The confidence intervals are evaluated for three congestion levels, namely . In all experiments, the sample size (of observed waiting times) was . Evidently, however, the heavier the system load, the fewer the number of idle periods; on average, equals 665, 457, and 267 for the three congestion levels.
|

Table 1. Confidence Intervals for the MLE s as Well as the Arrival Rate Estimated from Idle Periods for Different Confidence Levels
| Estimator | Load | 80% | 90% | 95% | 99% | |
|---|---|---|---|---|---|
| [0.423,0.592] | [0.403,0.620] | [0.386,0.645] | [0.352,0.691] | ||
| ρ = 1 | [0.454,0.555] | [0.441,0.571] | [0.431,0.586] | [0.407,0.612] | |
| ρ = 2 | [0.469,0.536] | [0.460,0.546] | [0.453,0.555] | [0.440,0.573] | |
| [0.958,1.048] | [0.948,1.061] | [0.937,1.074] | [0.918,1.099] | ||
| ρ = 1 | [0.955,1.053] | [0.944,1.067] | [0.933,1.081] | [0.912,1.104] | |
| ρ = 2 | [0.951,1.061] | [0.936,1.079] | [0.924,1.096] | [0.901,1.128] | |
| [0.953,1.052] | [0.941,1.069] | [0.929,1.082] | [0.909,1.110] | ||
| ρ = 1 | [0.944,1.063] | [0.928,1.083] | [0.915,1.101] | [0.890,1.134] | |
| ρ = 2 | [0.928,1.085] | [0.908,1.110] | [0.892,1.134] | [0.862,1.182] | |
Notes. A total of waiting observations were generated, times for each parameter setting. The parameter of the exponential patience parameter was , the arrival rate was λ = 1, and the service requirements followed a gamma distribution with parameters with μ = 1 and .
The numerical output is summarized in Table 1. A first observation is that the MLE for is more accurate as the system load increases. This is because the patience threshold is reached more often, and therefore, the data are more informative. Furthermore, for a lightly loaded system, the MLE and idle-period based estimator yield similar (accurate) results, as opposed to the high-load regime, in which the two estimators behave quite differently:
As a consequence of the fact that idle periods are observed considerably less frequently for a high load, becomes substantially less accurate.
The accuracy of , however, is only slightly reduced in the high-load regime. This is potentially because of the better accuracy of the estimation of θ, being jointly estimated with λ in the MLE procedure.
In the most heavily loaded example (ρ = 2, that is), the 95% confidence interval of the MLE is very similar to the 80% confidence interval of the idle period-based estimator. We conclude that even though the observations of the waiting times and the effective interarrival observations are highly dependent, the MLE provides substantially better confidence intervals than the idle period-based estimator .
Table 2 presents empirical confidence intervals for the maximum-likelihood estimators of for a multiserver system with s = 5. The confidence intervals are wider than in the single-server case, even though the sample size was taken twice as big, being indicative of the fact that the variance of the estimation error in a system with multiple servers is higher. As in the single-server case, lower system load increases the variance of the estimation error for the patience parameter θ. This effect is even stronger in the multiserver setting because of the fact that balking occurs only when all five servers are working, and such a state is not frequently observed. For higher load, the estimation of the patience parameter is much more accurate, as was the case for the single-server system. For the arrival rate, we observe high accuracy for all load levels.
|
Table 2. Empirical Confidence Intervals for the MLEs for Different Confidence Levels
| Estimator | Load | 80% | 90% | 95% | 99% | |
|---|---|---|---|---|---|
| ρ = 1 | |||||
| ρ = 2 | |||||
| ρ = 1 | |||||
| ρ = 2 | |||||
Notes. A total of waiting observations were generated, times for each parameter setting. The parameter of the exponential patience parameter was , and the arrival rate was λ = 1. The data were simulated for a system with s = 5 servers, and the service requirements followed a gamma distribution with parameters with and , corresponding to loads of .
4.2. (Generalized) Hyperexponential Patience
This subsection focuses on the case of the patience-level distribution being generalized hyperexponential (GHE), meaning that the corresponding cdf can be written as a mixture of exponential cdfs with weights that sum to 1 but that are not necessarily positive; this is in contrast with the standard hyperexponential (HE) distribution, where the weights are assumed to be positive. This case is particularly relevant because, as argued in Roubos and Jouini (2013), this distribution has a good empirical fit-to-patience data. Another motivation for considering this distribution lies in the known fact that the cdf of any continuous positive random variable can be approximated arbitrarily accurately (in terms of a suitably defined metric) by a GHE cdf (Botta and Harris 1986).
For convenience, we now assume the arrival rate λ to be known, but it is noted that it can be estimated in a similar manner as in the exponential case discussed in Section 4.1. Suppose the degree of the GHE distribution is :
Similarly to the previous example of the exponential distribution, Assumptions (A1)–(A3) and (A5) are satisfied when assuming stationary waiting times and a compact parameter space Θ. Therefore, the MLE is strongly consistent by Theorem 1. One should be cautious when fitting a GHE distribution because of further conditions to be imposed on the parameters to make sure that is a proper cdf. Even though convergence to the true parameters of the distribution is eventually guaranteed, for finite samples the estimated parameters may not yield a proper distribution. For an in-depth discussion on these conditions and the identifiability of GHE distributions, we refer to Botta and Harris (1986) (Section 3).
Using the representation (17), the log-likelihood pertaining to a single observation is calculated in a similar manner as in the exponential case, yielding
As follows with some elementary algebra, the gradient is then given by, for ,
The Hessian can be derived by computing the matrix of second derivatives. For the evaluation of the asymptotic covariance, a convenient alternative is to apply (26), that is,
Products of polynomials (of degree at most 2) and exponentials. For example, we come across a term that is, up to a multiplicative constant, . Observe that the mapping is bounded for
Ratios of the form, for example, up to a multiplicative constant
In addition, it is verified that if the patience-level distribution is light-tailed (which is the case for the GHE distribution), then the stationary waiting time W is also light-tailed and has finite moments. Indeed, note that (3) implies
Although there are theoretical guarantees for the asymptotic performance of the MLE, computation of the MLE is not straightforward, even for small parameter spaces such as p = 3. It requires maximizing , that is, solving a nonlinear and nonconcave program in variables, with both equality and inequality constraints. This is computationally highly challenging, and standard optimization methods may lead to local maxima. In particular, observe that is very small for large values of βj, which implies that displays very “flat” behavior for large values of these βj. Our experiments revealed that a direct implementation using standard optimization packages often led to points that were even not local maxima. As a consequence, we decided to write dedicated code to compute the MLE.
In light of the inherent complexity of maximizing the likelihood function, in our numerical experiments we have applied the following nested two-step heuristic optimization method.
(a) For each vector of , the objective function was maximized with respect to using a conventional coordinate descent algorithm. This step was typically fast and accurate; as for given , the objective function behaves nicely. Now we have reduced the problem to an optimization over
(b) Then, a standard L-BFGS quasi-Newton method (see e.g., Byrd et al. 1995) is applied to , so as to search for the optimal vector , with being parameterized by . The optimization is carried out with the following constraints that ensure that the parameters yield a proper distribution (Botta and Harris 1986):
Note that there is no firm guarantee that this heuristic method converges to the optimal parameters. To overcome this, the search for the optimizing vector was conducted multiple times for different initial values. The resulting method turned out to be time-consuming, especially for a relatively large sample size n and/or a relatively large dimension p of the parameter space. However, it typically returns considerably more robust results than off-the-shelf optimization routines (that in addition tended to converge very slowly).
Table 3 presents the marginal confidence intervals obtained by the normal approximation for an example of a HE cdf with p = 2. Observe that the variance of the estimation error is large, even for a substantial sample size. The accuracy is much higher for the low rate of than the higher rate of . This may be explained by the fact that the likelihood function is almost flat for high values of β2.
|
Table 3. Confidence Intervals for the MLEs Based on a Normal Approximation for a Sample Size of for Different Confidence Levels
| Estimator | Load | 80% | 90% | 95% | 99% | |
|---|---|---|---|---|---|
| [0.500,0.908] | [0.500,0.967] | [0.500,1.000] | [0.500,1.000] | ||
| ρ = 1 | [0.609,0.791] | [0.583,0.817] | [0.560,0.840] | [0.516,0.884] | |
| ρ = 2 | [0.660,0.740] | [0.649,0.750] | [0.639,0.761] | [0.620,0.780] | |
| [0.183,0.317] | [0.164,0.336] | [0.147,0.353] | [0.115,0.385] | ||
| ρ = 1 | [0.223,0.277] | [0.216,0.284] | [0.209,0.291] | [0.196,0.304] | |
| ρ = 2 | [0.240,0.260] | [0.237,0.262] | [0.235,0.265] | [ 0.230,0.270] | |
| [0.539,1.460] | [0.408,1.592] | [0.295,1.705] | [0.073,1.930] | ||
| ρ = 1 | [0.768,1.232] | [0.702,1.298] | [0.645,1.355] | [0.533,1.467] | |
| ρ = 2 | [0.870,1.130] | [0.833,1.167] | [0.801,1.199] | [0.739,1.261] | |
Note. The true values of the parameters of the HE patience were , the arrival rate was λ = 1, and the service requirements followed a gamma distribution with parameters with μ = 1 and .
The results presented in Table 3 show that the estimates are concentrated around the true values. The variance of the estimation error, however, is high, even more so given the large number of observations used. It should be realized, though, that HE distributions are not always easily distinguishable, in the sense that seemingly different HE distributions may lead to a very similar cdf. Clearly, from a practical standpoint, the main question is not whether the correct parameters are recovered but rather whether the cdf corresponding to the estimated parameters provides a good fit with the true cdf. In this respect, the main conclusion of our experiments is that our MLE procedure performs remarkably well. For example, in Figure 4, we illustrate this by presenting the true cdf and the estimated cdf based on four random samples (using observations). We have used the same parameters as in Table 3, with ρ = 1. We observe that, although the fitted parameters greatly differ from the correct ones, the fit of the (complementary) cdf is highly accurate.
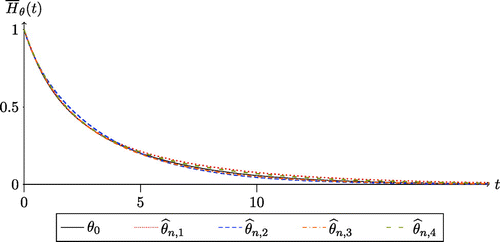
Notes. The true values of the parameters are given by . The fitted distributions , with , are based on independent samples of observations with the HE MLE for p = 2. The MLE parameters of the fitted functions are , and . The arrival rate in the example is λ = 1, and the service requirements are gamma distributed with parameters (3, 2).
In the remainder of this subsection, we further study the performance of the HE MLE. Our experiments lead to the conclusion that HE MLE provides a good fit even in cases where the true distribution is not HE (i.e., in misspecified scenarios). The examples focus mainly on fitting the target distribution by a (conventional) HE distribution, rather than a GHE distribution, by computing the MLE. The motivation behind this choice is that, when working with a GHE distribution, there is the additional complication that the estimated parameters may not yield a proper cdf. More specifically, the space of valid parameters is hard to characterize, let alone to be coded in terms of constraints of an optimization problem. Nevertheless, we would still like to exploit the extra versatility that the GHE class offers so as to improve the fit (when compared with the HE MLE). This is especially relevant for scenarios in which the model is misspecified, bearing in mind that, as mentioned earlier, in principle any distribution can be arbitrarily accurately approximated by a GHE distribution.
With the above considerations in mind, we implemented the following (seemingly naïve) heuristic model selection method. We generate various random weight vectors (equipped with a random size ). Then, for each of them, we optimize the likelihood function over using only step (a) above. The best model is then chosen by comparing the various combinations of and p, relying on the Akaike Information Criterion (AIC). The AIC encompasses both the log-likelihood and, in order to avoid overfitting, a penalty for the number of parameters (Burnham and Anderson 2002). Because step (a) can be performed highly efficiently, a main advantage of this heuristic is that it works very fast, even for bigger values of p, thus providing us with a technique to fit general continuous distributions. Recall from Botta and Harris (1986) that if we order the components of the weight vector (i.e., ), then a sufficient condition for to yield a cdf is that and ; we use this principle to select feasible solutions produced by the above heuristic.
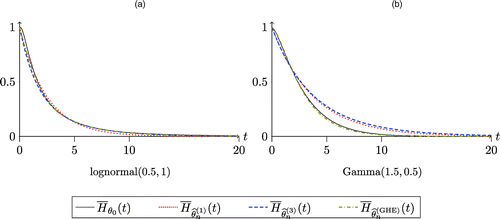
Figure 5, (a) and (c), illustrates the estimated survival function of using the HE MLE with varying weights for three examples of patience-level distributions. In the first example, the patience-level distribution is indeed HE with p = 4, whereas the second and third examples are misspecified (corresponding to a lognormal and gamma patience-level distribution, respectively). For each distribution, the MLE was computed using 2, and 4 (where p = 3 has been left out because it is barely distinguishable from p = 4).
As was the case in the setting of Figure 4, the experiments corresponding to the HE patience-level distribution show that, even for p = 4 and as many as waiting-time observations, the MLE does not accurately capture the true parameters. Nevertheless, the fit in terms of the cdf, as displayed in Figure 5(a), is remarkably good. We in addition performed the GHE fitting heuristic, which also provides a highly accurate fit and is considerably faster to compute than the MLE for p = 4.
The case of lognormal patience, as illustrated by Figure 5(b), shows that the fit is quite good for all estimators, except for p = 1 (i.e., an exponential distribution).
Figure 5(c) presents the fitted distributions for gamma patience. The fit of the HE MLE is decent, but importantly, in this case the GHE heuristic performs considerably better than the HE MLE (for p = 1, 2, 4). The GHE heuristic selects a model with p = 10 weights.
The above observations are replicated for a multiserver system with s = 10. Figure 6, (a) and (b), plots the true and estimated patience distribution for lognormal and gamma distributions, respectively, using the misspecified hyperexponential MLE. As in the single-server case, the GHE approximation yields an accurate fit.

Notes. The true patience distributions are hyperexponential, lognormal, and gamma. The fitted distributions are based on a sample of observations, with the HE MLE for and the GHE heuristic with p = 10. The arrival rate is λ = 1, and the service requirements follow a gamma distribution with parameters (3, 2). (a) HE (0.5, 0.3, 0.15, 0.05, 0.4, 1.5, 0.1, 1); (b) Lognormal (0.5, 1); (c) gamma (1.5, 0.5).
Notes. The true patience distributions are lognormal and gamma. The fitted distributions are based on a sample of observations, with the HE MLE for and the GHE heuristic. The system has s = 10 has servers with an arrival rate of λ = 10, and the service requirements follow a gamma distribution with parameters (3, 2). (a) Lognormal (0.5, 1); (b) gamma (1.5, 0.5).
5. Applications
In this section, we discuss a series of applications in which our estimation methodology can be directly used.
5.1. Unknown Proportion of Impatient Customers
In this subsection, we consider a system where an unknown proportion of the arriving customers has a known deterministic patience threshold w > 0. The other customers are patient and always join the queue. Suppose one wishes to estimate the fraction θ from data.
To this end, first observe that
Assumption (A4) is not satisfied because is not continuous (in x) at x = w. However, with respect to θ, we do have that is continuous. In addition, is concave, and therefore, the MLE is given by the first-order condition . In this case, we can apply results from Heijmans and Magnus (1986) to establish strong consistency. In particular, the smoothness of enables direct verification of the sufficient condition (21). Asymptotic normality then follows by verifying the conditions of Theorem 2 directly.
5.2. Noisy Delay Messages
Suppose that the patience threshold is a constant θ, but the customers do not observe their exact waiting time but rather some noisy estimate for some random function e such that . We assume that customers join based on this “perturbed delay” We, that is, if . Suppose we are in the context that the parameters underlying the noise distribution are known, but the threshold θ is not.
The probability of joining at virtual waiting time level W can be computed given the specific noise distribution. A few examples are as follows:
Additive perturbations. In this case, . One could, for instance, consider normally distributed perturbations: , independent of W, with . Let customers facing join the system. We thus have, with the cdf of the standard normal distribution,
The asymptotic properties of Section 3.1 hold in this case because satisfies the regularity conditions.
Multiplicative perturbations. Now, We = WG, with G nonnegative unit-mean and independent of W. In this case,
Now, if the random variable G is such that the regularity conditions of Section 3.1 are met, then it follows that the asymptotic properties hold in this case as well (with an asymptotic variance that can be expressed in terms of G).
5.3. Admission Pricing
Our estimation procedure can be exploited in the context of various problems rooted in operations research. Evidently, when having estimates of the arrival rate and the patience-level distribution, one could consider the option of increasing the service rate so as to potentially raise profits. Thus, the operational decision to be made is whether the increased revenues outweigh the cost of speeding up the service rate. In this subsection, we consider another operations research-related problem.
Suppose that the queue has an admission price of p and that customers are homogenous with a utility function as featured in the Naor (1969) model. More concretely, let there be constants r and c such that a customer will join the queue only if the virtual waiting time w upon the customer’s arrival satisfies
Theorem 3, in combination with the continuous mapping theorem, implies that, because , both and . Furthermore, for large n, confidence intervals for the stationary average revenue per unit of time can be approximated using (30). In particular, observing that the loss probability depends on the price, in self-evident notation,
6. Concluding Remarks
This paper has considered a service system in which clients potentially balk based on the virtual waiting time level they face at arrival. The main objective concerned the development of a framework for estimating the arrival rate and patience-level distribution. Our approach resolves the complication that in our setup only nonbalking clients are observed. Distinguishing between the case of a continuous patience-level distribution and constant patience, we developed MLE estimators and quantified their asymptotic properties. Through a sequence of examples and ramifications, we have illustrated the performance and broad applicability of our findings.
An important next step could concern the extension to a nonstationary arrival process. For example, one may assume that the potential arrival process is a nonhomogeneous Poisson process with an arrival rate function that depends on time, that is, . This means that when the virtual waiting time is v, the effective arrival rate at time t is given by , and the likelihood function in Section 2 can be updated accordingly. If the arrival rate function is known, then our estimation procedure for θ essentially carries over, including its performance guarantees. If the arrival rate function is unknown and parametric assumptions about it are made, then the joint estimation of the arrival rate and patience parameters is possible. Furthermore, in the practically relevant case that the time-dependent arrival rate is cyclic (i.e, for all and some cycle length ; think of daily or weekly patterns), then the queueing process will still have regenerative dynamics that can be exploited for asymptotic analysis. It is thus anticipated that the framework laid out in this paper can serve as a basis for developing estimation techniques for a wide class of nonstationary models.
Although we have developed estimation procedures assuming the independence between the customers’ service requirements and patience levels, one could consider an extension that allows dependence. Such an extension could, for example, model the situation in which customers with larger service requirements can be assumed to have more patience. Multiclass queueing models can be used to capture such dependence in service requirements and patience levels (Sakuma and Takine 2017). More specifically, suppose that there are two customer classes 1 and 2, where class k (k = 1, 2) customers arrive with rate λk and have service requirements (resp. patience levels), i.i.d. according to a class-dependent cdf (resp. ). It is natural to assume that the customer class is unobservable by the estimator, thus yielding a sequence of dependent service requirements and patience levels. In this setting, we have to estimate the service-requirement cdf jointly with the patience-level cdf (and the arrival rate λk) to compute the likelihood function corresponding to an observed sequence .
Another possible direction for future work concerns the situation in which each customer decides to balk based on his or her sojourn time, that is, the virtual waiting time seen by this customer just after (instead of before) his or her arrival. If the customer precisely knows his or her service requirement, this problem is easily reduced to the one considered in this paper. The other obvious option is that the customer balks if the virtual waiting time just before his or her arrival increased by a “guess” of his or her service requirement exceeds the customer’s patience threshold.
An alternative to the approach followed in the paper would be to pursue nonparametric estimation, cf. the results in Hansen and Pitts (2006) for the conventional case without balking. In the single-server case, it may be of help that we can write, with W(x) and D(x) denoting the cdf s of the waiting times and sojourn times of nonbalking customers, respectively,
A final issue to consider is that in many systems customers do not observe exact waiting times but rather queue lengths. Specifically, this can be modeled as an M/G/s + H system with customers that join or balk after having observed the number of customers in the system. In this case, the patience level Y is a discrete random variable indicating at what queue length a customer is willing to join. Therefore, the interarrival process at any given queue length is a Poisson process with rate . As was done in this paper, and MLE for the arrival rates (and the corresponding parameter θ) can be derived from a sample of interarrival times and the respective queue lengths.
The authors are grateful to the associate editor and two referees for their helpful comments and feedback. The authors also thank Onno Boxma (Eindhoven University of Technology, The Netherlands), Avi Mandelbaum (Technion, Haifa, Israel), Ran Snitkovsky (Columbia University & CUHK Shenzhen), and Galit Yom-Tov (Technion, Haifa, Israel) for providing useful feedback.
Appendix: Proofs
Assuming (A1)–(A3) and (A5), we verify the conditions for (20) as given in Ranga Rao (1962), (theorem 6.4). These are as follows: (i) Θ is compact, (ii) is a stationary ergodic sequence, (iii) the function converges almost surely pointwise to , (iv) the set is equicontinuous with respect to (A, X, W), and (v) there exists a function such that
Condition (i) is assumed in (A1). Assumption (A2) states that Wn is a stationary ergodic sequence, which also implies that the same is true for An and Xn, thus yielding the validity of (ii). Note that conditional on the distribution of Ai is determined by z and the external arrival process. Moreover, the upward-jump size is determined by the new service requirement together with the vector of residual service requirements in the system, which are assumed to be stationary and ergodic. Condition (iii) is (18). The equicontinuity assumption (A5) on implies that the same holds for the set of log-likelihood functions because both the log and the integral terms in (17) are continuous functions with respect to the observations so that we have established (iv). In the remainder of the proof, we verify (v).
Recall, from (A3), the definition for any . Because Θ is compact and all functions are continuous, we have that is a continuous monotone nonincreasing function such that . Defining
Clearly, , and so to complete the proof we need to show that . Recall that is the stationary virtual waiting time seen by an effective arrival, whose pdf is given by (cf. (4))
As mentioned in Section 3.1.1, (A5) ensures that the support of the distribution does not depend on θ. The above equation thus implies with probability one.
Note that we have
Regardless of whether or , it follows from (A3) that for any , there exist and such that
Using these inequalities, with , we obtain
(a) With Lemma 1 and Theorem 1 at our disposal, the proof essentially follows standard arguments. For instance, see the proof of Ferguson (1996) (theorem 18) for i.i.d. observations or the proof of Ravner et al. (2019) (lemma 14) that applies a martingale CLT for an MLE based on dependent workload observations in the M/G/1-queue context.
(b) We construct a martingale CLT for stationary sequences (Billingsley 1999, theorem 18.3) and verify that the corresponding conditions are satisfied. Let for , where . The identifiability condition (19) implies that the smooth function is maximized at θ0, and hence, , that is, all coordinates equal zero. Therefore, if is stationary, we have that
This proof consists of a lower bound and an upper bound.
Lower bound. Note that for , we have
We see from (13) and (A.2) that given , the observed virtual waiting time Wk is stochastically identical to , where denotes a sequence of i.i.d. random variables that are exponentially distributed with parameter λ. Therefore, are i.i.d. with
Obviously, we have and
Let, as before, and denote the pdfs of the stationary virtual waiting time and the stationary waiting time of nonbalking customers, and let denote the stationary loss probability. From the ergodicity, we have
Because (A.6) implies , we have, for any , using (A.4) and (A.5),
Furthermore, it follows from (A.4) and (A.6) that
Upper bound. Let denote the set of indices of observed virtual waiting times such that
By definition, we have
For , we define
From (13) and (A.2), it follows that a.s. for . We then have from (A.9),
Furthermore, Zk is stochastically identical to , where are i.i.d. exponential random variables with parameter λ, as defined above. thus forms a sequence of i.i.d. nonnegative random variables with the same cdf as (A.3) so that (cf. (A.4))
Let () denote the stationary probability that the virtual waiting time just after an acceptance of a customer takes a value in :
Because we have , it follows from the dominated convergence theorem that
Now define , which concretely means that
Because and are two disjoint sets whose union is , we have that
Note that (29) implies
Because is nondecreasing in n a.s., we have for ,
It then follows from (A.12) and (A.14) that
Using the Markov Inequality, we have for any ,
Therefore, we obtain from (A.11),
Finally, noting that (A.5) and (A.10) imply
Also, (31), (A.5), and (A.10) yield the following bounds for the scaled variance of the estimation error:
We can (i) explicitly calculate the right-hand sides of these inequalities using (A.7) and (A.11) and (ii) verify (with (A.6) and (A.16)) that their limits (because ) coincide and are given by ; we omit the details of these straightforward calculations. □
References
- (2013) Structural estimation of callers’ delay sensitivity in call centers. Management Sci. 59(12):2727–2746.Link, Google Scholar
- (1987) Consistency in nonlinear econometric models: A generic uniform law of large numbers. Econometrica 55(6):1465–1471.Google Scholar
- (2021) A survey of parameter and state estimation in queues. Queueing Syst. 97:39–80.Google Scholar
- (2003) Applied Probability and Queues, 2nd ed. (Springer, New York).Google Scholar
- (1981) On queues with impatient customers. Doctoral dissertation, INRIA.Google Scholar
- (1984) Single-server queues with impatient customers. Adv. in Appl. Probab. 16:887–905.Google Scholar
- (1999) Convergence of Probability Measures. (Wiley, Chichester, UK)Google Scholar
- (1986) Approximation with generalized hyperexponential distributions: Weak convergence results. Queueing Syst. 1:169–190.Google Scholar
- (2011) The M/G/1+G queue revisited. Queueing Syst. 67:207–220.Google Scholar
- (2010) The busy period of an M/G/1 queue with customer impatience. J. Appl. Probab. 47:130–145.Google Scholar
- (2005) Statistical analysis of a telephone call center: A queueing-science perspective. J. Amer. Statist. Assoc. 100 (469):36–50.Google Scholar
- (2002) Model Selection and Multimodel Inference: A Practical Information-Theoretic Approach (Springer, New York).Google Scholar
- (1995) A limited memory algorithm for bound constrained optimization. SIAM J. Sci. Comput. 16:1190–1208.Google Scholar
- (2020) Silent abandonment in contact centers: Estimating customer patience from uncertain data. Working paper, https://gality.net.technion.ac.il/files/2019/12/Castellanos_Silent_Abandonment_Paper.pdf.Google Scholar
- (1995) Admission control and routing in ATM networks using inferences from measured buffer occupancy. IEEE Trans. Commun. 43(2/3/4):1778–1784.Google Scholar
- (1998) Moment estimation of customer loss rates from transactional data. J. Appl. Math. Stochastic Anal. 11(3):301–310.Google Scholar
- (1985) A queueing system with impatient customers. J. Appl. Probab. 22:688–696.Google Scholar
- (2015) Queues and Lévy Fluctuation Theory. (Springer, New York).Google Scholar
- (2017) Convergence rates of Laplace-transform based estimators. Bernoulli 23(4A):2533–2557.Google Scholar
- (2004) Estimation of continuous-time Markov processes sampled at random time intervals. Econometrica 72(6):1773–1808.Google Scholar
- (2011) Estimating Loynes’ exponent. Queueing Syst. 68(285):285–293.Google Scholar
- (2019) The impact of delay announcements on hospital network coordination and waiting times. Management Sci. 65(5):1969–1994.Abstract, Google Scholar
- (1996) A Course in Large Sample Theory (Chapman & Hall, Routledge, London).Google Scholar
- (2000) Estimating tail probabilities in queues via extremal statistics. Analysis of communication networks: Call centres, traffic, and performance. AMS Fields Inst. Comm. 28:135–158.Google Scholar
- (2009) Asymptotic inference for waiting times and patiences in queues with abandonment. Comm. Statist. Simulation Comput. 38:318–334.Google Scholar
- (2007) Analysis and comparison of queues with different levels of delay information. Management Sci. 53(6):962–970.Link, Google Scholar
- (2008) The effects of information on a queue with balking and phase-type service times. Naval Res. Logist. 55(5):406–411.Google Scholar
- (2006) Nonparametric inference from the M/G/1 workload. Bernoulli. 12(4):737–759.Google Scholar
- (2016) Rational Queueing (CRC Press, Boca Raton, FL).Google Scholar
- (2003) To Queue or Not to Queue: Equilibrium Behavior in Queueing Systems (Springer, New York).Google Scholar
- (1986) Consistent maximum-likelihood estimation with dependent observations: The general (non-normal) case and the normal case. J. Econom. 32(2):253–285.Google Scholar
- (1997) Quasi-Likelihood and Its Application: A General Approach to Optimal Parameter Estimation (Springer Science & Business Media, New York).Google Scholar
- (2018) Sharing delay information in service systems: A literature survey. Queueing Syst. 89:49–79.Google Scholar
- (2015) Analysis of the loss probability in the M/G/1+G queue. Queueing Syst. 80:363–386.Google Scholar
- (1961) Some queueing problems with restrictions. Theory Probab. Appl. 6:205–208.Google Scholar
- (1990) The queue inference engine: Deducing queue statistics from transactional data. Management Sci. 36(5):586–601.Link, Google Scholar
- (2017) A numerical approach to stability of multiclass queueing networks. IEEE Trans. Automat. Control 62:5478–5484.Google Scholar
- (2006) Explicit solutions for the steady state distributions in M/PH/1 queues with workload dependent balking. Queueing Syst. 52:251–260.Google Scholar
- (2008) Busy period analysis for M/PH/1 queues with workload dependent balking. Queueing Syst. 59(37):37–51.Google Scholar
- (2000) A model for rational abandonments from invisible queues. Queueing Syst. 36:141–173.Google Scholar
- (2004) Rational abandonment from tele-queues: Nonlinear waiting costs with heterogeneous preferences. Queueing Syst. 47:117–146.Google Scholar
- (2013) Data-stories about (im)patient customers in tele-queues. Queueing Syst. 75:115–146.Google Scholar
- (2020) Hypothesis testing for a Lévy-driven storage system by Poisson sampling. Stochastic Process. Appl. 133:41–73.Google Scholar
- (2017) Detecting Markov chain instability: A Monte Carlo approach. Stoch. Syst. 7(2):289–314.Link, Google Scholar
- (1969) The regulation of queue size by levying tolls. Econometrica 37(1):15–24.Google Scholar
- (2019) Simulation-based estimation of the real demand in bike-sharing systems in the presence of censoring. European J. Oper. Res. 277(1):317–332.Google Scholar
- (2022) Estimating the true arrival, balking, and reneging processes from censored transactional data: A simulation-based approach. Simulation 98(7):597–614.Google Scholar
- (1989) A uniform law of large numbers for dependent and heterogeneous data processes. Econometrica 57(3):675–683.Google Scholar
- (1962) Relations between weak and uniform convergence of measures with applications. Ann. Math. Statist. 33(2):659–680.Google Scholar
- (2019) Estimating the input of a Lévy-driven queue by Poisson sampling of the workload process. Bernoulli 25(4B):3734–3761.Google Scholar
- (2013) Call centers with hyperexponential patience modeling. Int. J. Prod. Econom. 141(1):307–315.Google Scholar
- (1979) Reneging phenomena in single channel queues. Math. Oper. Res. 4(2):162–178.Link, Google Scholar
- (2017) Multi-class M/PH/1 queues with deterministic impatience times. Stoch. Models. 33(1):1–29.Google Scholar
- (2022) Self-reporting and screening: Data with right-censored, left-censored, and complete observations. Statist. Medicine. 41(18):3561–3578.Google Scholar
- (1998) Asymptotic Statistics, vol. 3 (Cambridge University Press, Cambridge, UK).Google Scholar