Regional Poverty Alleviation Partnership and E-Commerce Trade
Abstract
Regional inequalities are prevalent in all major economies. What are the effects of inclusive growth policies targeting economically disadvantaged regions? In this study, we examine how the East-West Poverty Alleviation Partnership, which pairs rich cities in East China with economically disadvantaged cities in West China, affects e-commerce trade. Using proprietary trade-flow data from Alibaba, we find that the partnership boosts e-commerce trade between partnered cities. This effect is asymmetric as it increases exports from West China to East China but not the other way around. The effect is also particularly strong for product categories in which West China has a comparative advantage and for the western regions with the largest economic and development disparities. Additionally, the results indicate that the partnership benefits both big and small sellers equally. In exploring the underlying mechanisms, we find that partnership-driven migration as well as consumer awareness can partially explain the effect.
History: Olivier Toubia served as the senior editor. This paper has been accepted for the Marketing Science Special Section on DEI.
Funding: The research of W. Zhou is funded by the Zhejiang Provincial Philosophy and Social Sciences Planning Project [Grant 24NDJC125YB], the National Natural Science Foundation of China [Grants 72203200 and 72141305], the National Key Research and Development Program of China [Grant 2022YFF0902000], the Soft Science Research Program of Zhejiang Province [Grant 2023C35101], the National Statistical Science Research Project of China [Grant 2023LZ040], and the Fundamental Research Funds for General Universities [Grant S20240048].
Supplemental Material: The online appendix and data files are available at https://doi.org/10.1287/mksc.2023.0214.
1. Introduction
Regional inequalities are prevalent in all major economies, including the economic gap between the heartland and coast regions in the United States, East Europe, and West Europe as well as East and West China. In response, governments have introduced various place-based policies aimed at promoting inclusive growth, reducing inequalities, and alleviating poverty. E-Commerce platforms, by offering businesses access to markets and reducing barriers to entrepreneurship, have the potential to contribute to these inclusive growth policies. This is particularly relevant in remote areas and among ethnic minorities, where physical and cultural distances can pose substantial hurdles. In this paper, we empirically examine the impact of one of China’s most extensive poverty-alleviation policies on e-commerce.
Despite China’s miraculous economic growth, poverty remains a prevalent issue in West China, home to most of the country’s ethnic minorities. As of 2012, over 50 million people, representing 17.6% of the local population in this region, lived in poverty. In stark contrast, poverty was virtually eliminated in the eastern provinces, where Gross Domestic Product (GDP) per capita was 87% higher than in West China in 2012. Even in 2021, this gap remained significant at 68%. To address regional inequality and poverty, the Chinese Central Government established the East-West Poverty Alleviation Partnership, which pairs western regions with their eastern counterparts. Eastern local governments are charged with providing financial aid and other forms of support, such as governance expertise, technology, market access, and labor exports, to their partnered cities in West China. Over the past few years, this partnership has facilitated the migration of millions of people from west to east and prompted billions of investments that created hundreds of thousands of local jobs in West China. These initiatives have played a significant role in lifting tens of millions of West China residents out of poverty. Yet, despite the importance and scale of this partnership, to the best of our knowledge, there has been no study on its economic effects.
We evaluate the economic impact of the regional partnership plan through e-commerce trade. Unlike financial aid, which typically involves zero-sum transfers between regions, trade often generates surpluses. E-Commerce, constituting about one fourth of all consumption in China, is particularly relevant in this context as e-commerce can potentially reduce transportation costs and trade barriers for cities between East and West China, which are often more than a thousand miles apart (Goldfarb and Tucker 2019). Consequently, this has the potential to help businesses in economically disadvantaged West China access the vast East China market. Our analysis is based on trade flow data derived from all transactions on Alibaba, the leading e-commerce platform in China. The data, aggregated on a monthly basis at the prefecture-city pair level from 2017 to 2021, total 1.15 million observations.
We first present empirical patterns using the classic gravity model. We document that being city partners is associated with a 5.6% increase in e-commerce trade. Notably, this association is only significant for west to east trade (11.9%). However, this pattern should not be interpreted as causal because of potential systematic differences between partnered city pairs and nonpartnered ones. We thus further use a spatial regression discontinuity (RD) design for causal identification. This design is implemented by comparing partnership pairs with control pairs in close proximity, which should share similar unobserved demand for goods produced in the other cities, as well as similar unobserved trade barriers. We verify that within close proximity, partnership and control pairs are balanced in terms of observables.
We find that the partnership caused a 4.8% increase in e-commerce trade flow, which translates to an increase of 2–3 billion Chinese yuan in trade. The effect is asymmetric; from east to west, the impact is minimal and statistically insignificant, whereas from west to east, it is substantial (10.0%) and statistically significant. The effects on the number of transactions are qualitatively similar. The results are robust across various specifications and bandwidth choices and with different types of control city pairs as well as under alternative implementations of spatial RD.
We also investigate the heterogeneous effects on different sellers by examining the impact on the sellers’ concentration ratio for each city pair-month cell. Our findings indicate that the partnership does not influence the sellers’ concentration ratio, suggesting that the policy equally benefits large and small sellers in West China. Among different product categories, the effect is notably strong for food and beverage, clothing, and household goods, with exports from west to east increasing by 12%–9.6% because of the partnership. These sectors are comparative advantages of West China and priority investments by the policy to create local jobs.
We further examine how the effects vary across cities with different characteristics. Our findings reveal that pairs with larger GDP gaps or western cities with worse physical and digital infrastructure exhibit stronger effects. Western cities with higher proportions of ethnic minorities, more geographical indication (GI) products, and more e-commerce firms benefit more from the partnership, suggesting that the policy can help overcome cultural barriers as well as unlock the supply-side potential in e-commerce. Dynamically, whereas the overall effects decreased following the coronavirus disease 2019 (COVID-19) pandemic, the effect from west to east remained consistent as before.
In testing the mechanism, we find that migration between partnered cities partially explains the effect. Thus, the partnership addresses inequality in two ways; it assists migrant workers from West China in securing jobs in eastern cities who in turn, support sellers in their hometowns through e-commerce. Consumer awareness, as measured by online search, also partially mediates the effect. We find no evidence supporting the effect being driven by targeted public-sector spending, typically observed at the end of the year or during the Chinese New Year (CNY), nor by reduced transportation costs between partnered cities as measured by direct flight routes.
This study carries broad and significant implications for both policymakers and platforms. Our results suggest that the partnership plan boosts e-commerce trade between regional pairs, particularly from economically disadvantaged regions to more developed ones. The benefits are equitably distributed among both large and small sellers. This experience from the world’s largest e-commerce platform also holds implications for other economies, where the debate on whether digitization exacerbates or alleviates inequality remains active and ongoing.
We are the first to examine the economic effects of the regional cooperation plan, thereby contributing to the literature on inequality, local economic development, and e-commerce trade. The primary policy we explore addresses the issue of regional inequality in China (Montalvo and Ravallion 2010, Zhang and Zou 2012, Lemoine et al. 2015, Liu et al. 2017, Fan 2019, Kanbur et al. 2021, Zhang 2021). The plan also bears some similarity to the partnership plan in disaster relief (Bulte et al. 2018) and social entitlement exchange (Luo and Zhang 2009) based on the incentive role of personnel control (Li and Zhou 2005). However, it operates on a much larger scale, targeting persistent regional inequality.
Broadly, our study also relates to aid for trade in the fields of international and development economics (Cali and Te Velde 2011, Rajan and Subramanian 2011, Vijil and Wagner 2012, Hühne et al. 2014, Lee and Ries 2016, Martínez-Zarzoso et al. 2017, Gnangnon 2019, Kim 2019). The distinction lies in our focus on large-scale intranational aid and e-commerce trade. More generally, we contribute to the literature on place-based policies (Kline and Moretti 2014, Neumark and Simpson 2015, Austin et al. 2018, Duranton and Venables 2018, Ehrlich and Overman 2020). Within the context of China, the existing literature has so far concentrated on special economic zones (Lu et al. 2019), high-tech zones (Tian and Xu 2022), and the Western Development Program (Jia et al. 2020). We are the first to specifically study the East-West Poverty Alleviation Partnership, and we are the first to examine the effect of a place-based policy on e-commerce trade in general.
The literature on the geography of e-commerce trade finds that e-commerce reduces transportation costs, thereby diminishing the role of distance in trade (Blum and Goldfarb 2006, Hortaçsu et al. 2009, Chen et al. 2015, Lendle et al. 2016, Brynjolfsson et al. 2019, Zhao et al. 2019, Hui 2020, Chintagunta and Chu 2021, Carballo et al. 2022, Elfenbein et al. 2023). In particular, Fan et al. (2018) also studied the geographic pattern of intranational trade on Alibaba. We build on this literature by bridging this body of work with regional inequality and the effect of regional partnerships. As such, we also contribute to the literature on online platforms and poverty (Couture et al. 2021), and more broadly, we contribute to the literature on the impact of the digital economy in rural and remote areas (Forman et al. 2005, Aker and Mbiti 2010, Goyal 2010, Parker et al. 2016, Luo et al. 2019). We demonstrate how the policy utilizes an e-commerce platform to assist disadvantaged regions and test for its rich heterogeneous effects and mechanisms.
2. Background
2.1. Regional Income Inequality in China
As China’s economy grew in the past decades, so did the regional inequality. From 1978 to 2000, the ratio of GDP per capita in East China to GDP per capita in West China increased from 1.85 to 2.42. Since then, regional inequality has been declining, but it remains considerable (Kanbur et al. 2021, Zhang 2021). In 2012, the GDP per capita in East China was 87% higher than that in West China, a gap that had narrowed to 68% by 2021.
Concurrent with the decline in regional inequality, there has been significant progress in reducing poverty in western China. As of 2012, 50.86 million people in West China (17.6% of the local population) lived in poverty, a number reduced to only 3.23 million by 2019. This reduction in poverty enabled the central government to declare its elimination in 2021, marking a significant milestone in the centennial celebration of the founding of the Chinese Communist Party.
2.2. The East-West Poverty Alleviation Partnership
The East-West Poverty Alleviation Partnership has been a central policy toward reducing regional inequality and poverty. Initiated by the State Council in May 1996, the program started as a province to province partnership that included 6 provinces and seven provincial cities (such as Beijing, Tianjin, and Shanghai) in East China paired with 10 provinces in West China. Most of the partnerships have remained the same, with only minor reshuffling at the end of 2016. In 2017, the central government further formalized the partnerships between counties and cities and published the full list of “prosperity-together” pairs, based on which we construct the partnership treatment.1
The partnership encompasses multiple policies. It calls on local governments in East China to provide fiscal aid to West China through their budgets. It encourages government officials to visit West China and exchange officials between partnered cities, with the goal of sharing governance and development expertise. Firms in East China are encouraged to invest in the aided western regions. The governments in West China have also organized training sessions and labor exports to their partnered cities in East China. Between 2015 and 2020, local governments in East China sent 78 billion Chinese yuan in aid to West China. Government officials made 148,642 visits and facilitated 16,198 exchanges; 22,683 firms invested over 1 trillion Chinese yuan, creating 313,750 local jobs. The partnership also provided 3,429,408 training opportunities and over 4 million jobs through labor exports. All of these efforts are key performance indicators that the central government tracks.
The partnership plan also encourages societal participation, including philanthropy and “poverty alleviation through consumption,” in which e-commerce has been playing a vital role. The idea that the digital economy can benefit geographically isolated regions has been well established (Forman et al. 2005, Luo et al. 2019). The partnership can promote intercity e-commerce trade through various mechanisms. On the supply side, the partnership plan often includes investments in the supply chain, infrastructure, shipping services, and training for sellers to host online storefronts or live stream e-commerce sessions. Whereas many of these investments may increase the aided regions’ overall exports, some may specifically increase exports to the paired eastern regions. For example, the product categories that eastern firms invest in may correlate with their local preferences. Shipping routes, such as new airline networks, may reduce the specific transportation costs between partnership pairs. On the demand side, local governments in East China can promote products from their paired regions through advertising, channel support, coupons, and consumer subsidies. Other policy initiatives, such as labor exports, may also indirectly increase trade flow.
3. Data
Our study utilizes data from several sources. The key variation is the East-West Poverty Alleviation Partnership from the Yearbook of China’s Poverty Alleviation and Development. The outcome variable is the trade flow data from Alibaba Group, the largest e-commerce company in China. We supplement these two data sets with city pair characteristics, migration, and Baidu search index data.
3.1. City Partnerships
We collect the list of city partnerships (Online Appendix Table A.1) reported in the 2018 Yearbook of China’s Poverty Alleviation and Development, published by the State Council Leading Group of Poverty Alleviation and Development.2 Within all 87 eastern cities and 110 western cities, there are 19,140 () directed city pairs.3 There are 56 eastern cities and 81 western cities in the program, forming 256 directed partnership pairs, based on which we define the treatment indicator that equals one if city i and city j are “partner cities” under the framework of the East-West Poverty Alleviation Partnership. Panel A of Table 1 reports the summary statistics of this variable for the full sample. These city partnerships were first announced at the beginning of 2017 by the central government, and they remained the same throughout our sample period.4 Figure 1 illustrates the pairs on a map. The rest are potential control pairs, of which we can further classify them into four types. (1) Neither eastern city i nor western city j are in the program (1,798 pairs). (2) Only eastern city i is in the program (3,248 pairs). (3) Only western city j is in the program (5,022 pairs). (4) Both eastern city i and western city j are in the program, but they are not in a partnership pair with each other (8,816 pairs). We will show that our results are robust to various combinations of control pairs.
|

Table 1. Summary Statistics
| Variable | Observations | Mean | SD | Min | P25 | P50 | P75 | Max |
|---|---|---|---|---|---|---|---|---|
| Panel A: City partnerships | ||||||||
| Partnership pair | 19,140 | 0.013 | 0.115 | 0.00 | 0.00 | 0.00 | 0.00 | 1.00 |
| Panel B: E-Commerce trade flows (full sample) | ||||||||
| Trade amount | 1,148,400 | 6,710,610.75 | 35,489,376.75 | 0.00 | 81,174.18 | 455,479.42 | 1,298,604.85 | 3,330,035,240.52 |
| Deal volume | 1,148,400 | 37,620.12 | 246,761.85 | 0.00 | 767.21 | 3,622.76 | 19,610.40 | 19,812,880.78 |
| Seller concentration ratio | 1,136,426 | 88.56 | 13.77 | 18.51 | 80.74 | 89.22 | 97.47 | 99.99 |
| Buyer concentration ratio | 1,137,650 | 82.32 | 14.64 | 14.69 | 72.88 | 82.55 | 91.79 | 99.99 |
| Panel C: E-Commerce trade flows (east to west sample) | ||||||||
| Trade amount | 574,200 | 9,062,917.15 | 57,932,763.85 | 0.00 | 300,124.01 | 892,274.52 | 5,339,022.40 | 2,920,621,699.07 |
| Deal volume | 574,200 | 115,145.46 | 589,621.79 | 0.00 | 2,975.83 | 12,983.27 | 34,234.36 | 25,296,946.13 |
| Seller concentration ratio | 574,134 | 88.08 | 11.87 | 20.65 | 81.21 | 88.27 | 95.55 | 99.98 |
| Buyer concentration ratio | 574,135 | 81.76 | 12.77 | 19.32 | 73.25 | 81.67 | 89.91 | 99.98 |
| Panel D: E-Commerce trade flows (west to east sample) | ||||||||
| Trade amount | 574,200 | 1,177,110.25 | 8,953,320.35 | 0.00 | 36,360.83 | 93,751.99 | 583,916.55 | 508,782,865.30 |
| Deal volume | 574,200 | 12,109.87 | 68,299.08 | 0.00 | 317.92 | 1,523.43 | 4,256.68 | 3,420,159.12 |
| Seller concentration ratio | 562,292 | 89.07 | 15.44 | 18.51 | 80.03 | 90.52 | 98.00 | 99.99 |
| Buyer concentration ratio | 563,515 | 82.88 | 16.33 | 14.69 | 72.31 | 83.68 | 93.71 | 99.99 |
| Panel E: City pair characteristics | ||||||||
| Distance | 9,570 | 1,565.36 | 492.86 | 113.10 | 1,254.59 | 1,542.96 | 1,895.36 | 3,237.34 |
| GDP difference | 9,570 | 1.71 | 4.73 | −12.75 | 0.28 | 1.27 | 2.48 | 15.56 |
| Panel F: Intercity migration flows | ||||||||
| Pre-CNY traffic ratio (mean) | 9,570 | 0.154 | 0.661 | 0.000 | 0.001 | 0.011 | 0.068 | 15.681 |
| Post-CNY traffic ratio (mean) | 9,570 | 0.129 | 0.579 | 0.000 | 0.001 | 0.010 | 0.053 | 15.938 |
| Panel G: Baidu search index | ||||||||
| Baidu search index | 19,140 | 38.52 | 60.97 | 0.00 | 3.00 | 16.00 | 55.00 | 1,224.00 |
Notes. This table reports the summary statistics of the full sample, including the mean, standard deviation (SD), minimum (Min), 25th percentile (P25), median (P50), 75th percentile (P75), and maximum (Max), for the key variables used in our study. The sample covers the period from January 2017 through December 2021. To satisfy the data privacy requirements of Alibaba Group, the summary statistics for the e-commerce trade flows shown in panels B, C, and D are obtained by transforming the original values using a linear model with randomly generated coefficients, which preserves the rank of the data. Partnership pair is a dummy variable that equals one if two cities form a partnership pair. Trade amount, deal volume, seller concentration ratio, and buyer concentration ratio are monthly variables of e-commerce trade flows as detailed in Section 3.2. Distance and GDP difference are city pair characteristics defined in Section 3.3. Pre-CNY traffic ratio (mean) and Post-CNY traffic ratio (mean) are two intercity migration ratios as detailed in Section 3.4. Baidu search index is detailed in Section 3.4.
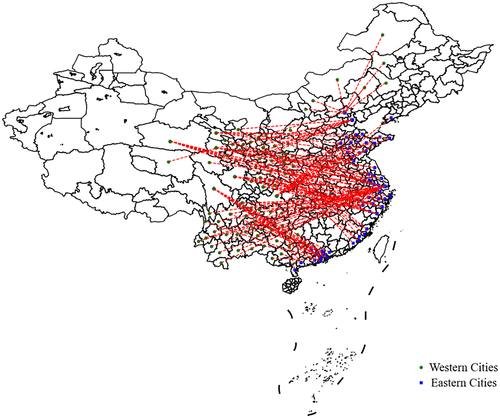
Note. This figure displays the city partnerships, represented by red dashed lines, between the targeted western cities (green circles) and their corresponding eastern partner cities (blue squares).
3.2. E-Commerce Trade Flows
The e-commerce trade flow data used in our study consist of four key outcome variables, including trade amount in Chinese yuan (trade), the number of deals or transactions (deal), seller concentration ratio, and buyer concentration ratio, for each directed city pair on a monthly basis. These variables are constructed using transaction-level data from Taobao and Tmall, the most popular online retail platforms in China, which are both owned by the Alibaba Group. Specifically, for the trade flow from city i to city j, the seller (respectively, buyer) concentration ratio is defined as the share of the trade amount of the top 10% largest sellers (respectively, buyers) measured by the transaction amount in city i (respectively, city j) relative to the total monthly trade flow between these two cities.
Panels B, C, and D of Table 1 report the summary statistics of the outcome variables for the full, east to west, and west to east samples, respectively. The final data set consists of the e-commerce trade flows of 19,140 directed city pairs from January 2017 to December 2021, resulting in a sample size of 1,148,400 ( months). The east to west e-commerce trade flows are an order of magnitude larger than those in the other direction as the e-commerce industry is much more developed in the eastern region of China. There are a few missing data points in the two concentration ratios because of zero trade in these city pair-month cells. In Online Appendix Table A.2, we further show the summary statistics of the share of partnered cities relative to the overall east-west trade. On average, the trade between partnered cities is about 4.78% of the overall east-west trade, whereas western cities’ exports to partnered cities constitute 5% of their overall export to all eastern cities.
3.3. City and Pair Characteristics
We supplement the data with the following city-level and city pair-level characteristics. We calculate the distances based on the longitudes and latitudes of city centers, which we obtain from the Baidu Map. For our heterogenous effect analysis, we collect city-level GDP statistics in 2018 from the China City Statistical Yearbook. Panel E of Table 1 shows the summary statistics of these city pair characteristics. We further include the e-commerce infrastructure in West China by the number of newly entered e-commerce companies in western cities, constructed from the registration information of industrial and commercial enterprises based on industry classification.5 We also collect data on the share of ethnic minorities in the population of each western city from the 2020 census. In addition, we compile the number of products with GI as of 2022 for every city.6 To measure offline trade, we use the standard input-output table for the years 2012 and 2017, the most recent data available.7
3.4. Intercity Migration Flows and Baidu Search Index
We collect migration and Baidu search index data for testing the mechanism. Because of China’s rapid industrialization and urbanization, millions of people in the working-age population have migrated from rural areas to urban centers in search of employment opportunities. These migrants often leave their families behind in their rural hometowns. Before the CNY—China’s most important holiday season—they travel from urban areas back to rural ones to reunite with their families. After the festivities, they return to the urban centers. This migration, known as Chunyun (the Chinese New Year travel rush), represents one of the largest annual human migrations worldwide.
Utilizing the migration flow patterns before and after the CNY, we construct measures of migration between city pairs as follows. We use the migration data based on the Global Positioning System data of hundreds of millions of actual users of Baidu Map, the equivalent of Google Maps in China.8 The data are available at a daily level between January 1, 2019 and December 31, 2021. Each entry records the percentage of migration flows from one city to another for both inflow and outflow, defined as the number of migrants relative to the total number of migrants from the origin or destination city. We further normalize the migration percentage by the population of the destination city (for outflow) or origin city (for inflow).9 We then take the days during the official Chunyun periods10 and split them into pre-CNY and post-CNY periods. We calculate the average daily east to west inflow pre-CNY traffic and the average daily west to east outflow traffic post-CNY for each of the holiday seasons of 2019, 2020, and 2021.11 Additionally, we calculate the mean of both pre-CNY traffic and post-CNY traffic, averaged across these three years. Thus, we have eight measures (three years plus the mean for both pre-CNY and post-CNY traffic) representing the same underlying migrant population—those migrating from their hometowns in western China to work in eastern China. Online Appendix Table A.3 shows that all eight measures are highly correlated with each other. We thus focus on the result using the pre-CNY traffic averaged across the three years in the paper, and we show that the results are consistent when we use other measures.
We also gather the following Baidu search index data, the equivalent of Google Trends, from Baidu’s Application Programming Interface. The original data show the search index of one city (e.g., the keyword “Leshan,” a city in West China) by residents of another city (e.g., Shenzhen in East China) at a monthly level between January 2017 and December 2021. We match the data with the trade-flow data for the city pair month in the opposite direction. For instance, for the west to east trade (e.g., Leshan to Shenzhen), we match the search from the east for keywords of western cities (e.g., Shenzhen residents searching for the keyword of “Leshan”) to measure the demand-side awareness on the location of the supply side.
Panel F of Table 1 reports the summary statistics of the intercity migration flows, including the east to west outflow pre-CNY and the west to east inflow post-CNY. Panel G of Table 1 reports the summary statistics of the Baidu search index data.
4. Methodology
We use the canonical gravity model as our baseline:
If (that is, the unobserved error terms driving trades between city pairs are not systematically correlated with the treatment), then the coefficient γ can be interpreted as a causal effect of the partnership. In the baseline model, we find significant differences in distances and economic statistics between the partnered city pairs and the control pairs. The last column of Online Appendix Table A.6 shows that the treatment status is significantly correlated with longer distances and larger GDP gaps between city pairs. Consequently, the identification assumption may not hold. Consumers in city i might systematically prefer products sold by sellers in their partnered city j even in the absence of the partnership. This motivates us to use spatial regression discontinuity for causal identification.
The premise of spatial RD is that cities in close proximity should share similar unobserved characteristics potentially affecting the outcome, thereby allowing for the separation of the treatment effect. In our context, when evaluating the outcome of partnered city pair ij, we intend to compare it with a control pair kj. In this pair, city k and city i are close in proximity, and hence, they should share similar preferences for products sold by city j’s sellers as well as face similar trade barriers and transaction costs. Therefore, the comparison of trade flows between pair ij and kj serves as a natural experiment. Formally, the pair-level spatial RD relies on the assumption that , where is a flexible continuous function of the latitude and longitude of city i and city j, with the condition that . Our segment-segment fixed effect model replaces with the fixed effects of segment-segment pairs, denoted as θIJ. This approximation remains consistent as the segments get arbitrarily small.
We implement the spatial RD using the spatial fixed effect. We first construct segments through spatial clustering, ensuring that the distance between any two cities in the same segment is within a small bandwidth d. We then estimate the following model:
The identification assumption now becomes (i.e., within the same segment pair, where all eastern (western) cities are in close proximity, unobserved error terms driving trades are not systematically different between a treated city pair and a control pair). We confirm that within the same segment pair, there are no observable differences between treated and control pairs, and the results are robust to a wide range of bandwidths in spatial clustering.13
We also show that our results are robust to two alternative implementations of spatial RD: spatial matching and regular RD. In spatial matching, we only include samples of treated city pairs and their corresponding control pairs that are within a certain distance. In the regular RD method, for every treated pair ij, we find neighboring cities of i, such as city k, and collapse the locations of i and k into a single dimension of distanceik as the running variable. This variable has a negative sign for the control pair kj and a positive sign for the treated pair ij. We then use a standard local linear regression to estimate the treatment effects. The details of these two alternative methods are provided in Online Appendix D. Both methods yield consistent results.
5. Results
5.1. Main Results
We first visualize online trade between western and eastern cities in partnership pairs and nonpartnership pairs in Figure 2. The pattern shows that whereas overall log trade and log distance display a linear relationship as the gravity model predicts, partnered cities trade more than nonpartnered cities (Figure 2(a)), especially from west to east (Figure 2(c)).
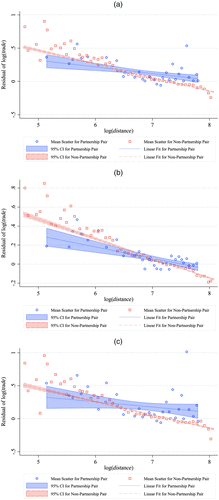
Notes. This figure illustrates the relationship between the residuals of the logarithm of e-commerce trade, denoted as , and the distance between city centers, represented by . The residuals of the logarithm of e-commerce trade are obtained by regressing the monthly e-commerce trade amount on the city-month fixed effects. The blue circles and red squares display the residuals of averaged over 50 evenly spaced distance bins. The blue and pink shaded areas represent the 95% confidence intervals (95% CIs) for the linear fits of the relationship for partnership and nonpartnership pairs, respectively. (a) Full sample. (b) East to west trade. (c) West to east trade.
Table 2 presents the estimates of the baseline gravity model. We find that the partnership is associated with a 5.6% increase in e-commerce trade, driven solely by west to east trade (11.9%). Consistent with the literature on online trade (Lendle et al. 2016, Fan et al. 2018), the coefficients on log distance are around −0.33. The estimates on deals (the number of transactions) are similar. We find no correlation between the concentration ratios and the partnership. Taken together, the gravity model shows a strong correlation between partnership and e-commerce trade, and the correlation only exists for west to east trade. Table A.5 in the Online Appendix further shows that the results are similar when we control for import and export province pair fixed effects.
|
Table 2. Gravity Regression: Main Results
| Dependent variable | Both directions | East to west | West to east | Both directions | East to west | West to east |
|---|---|---|---|---|---|---|
| Partnership pair | 0.056*** | −0.008 | 0.119*** | 0.036*** | −0.005 | 0.076*** |
| (0.018) | (0.012) | (0.034) | (0.009) | (0.008) | (0.014) | |
| −0.334*** | −0.339*** | −0.329*** | −0.316*** | −0.332*** | −0.300*** | |
| (0.005) | (0.006) | (0.007) | (0.004) | (0.006) | (0.005) | |
| Exp. city-month FEs | Yes | Yes | Yes | Yes | Yes | Yes |
| Imp. city-month FEs | Yes | Yes | Yes | Yes | Yes | Yes |
| Adjusted R2 | 0.963 | 0.986 | 0.929 | 0.991 | 0.994 | 0.984 |
| F-statistic | 2,653.68 | 1,595.11 | 1,133.80 | 3,399.44 | 1,655.63 | 1,776.52 |
| Observations | 1,148,400 | 574,200 | 574,200 | 1,148,400 | 574,200 | 574,200 |
| Seller concentration ratio | Buyer concentration ratio | |||||
| Partnership pair | −0.124 | −0.115 | −0.133 | −0.006 | 0.053 | −0.065 |
| (0.202) | (0.214) | (0.345) | (0.162) | (0.183) | (0.267) | |
| Yes | Yes | Yes | Yes | Yes | Yes | |
| Exp. city-month FEs | Yes | Yes | Yes | Yes | Yes | Yes |
| Imp. city-month FEs | Yes | Yes | Yes | Yes | Yes | Yes |
| Adjusted R2 | 0.504 | 0.646 | 0.418 | 0.515 | 0.659 | 0.424 |
| F-statistic | 22.17 | 49.71 | 0.26 | 92.64 | 35.91 | 56.93 |
| Observations | 1,136,426 | 574,134 | 562,292 | 1,137,650 | 574,135 | 563,515 |
Notes. This table reports the regression results of the baseline gravity model. The unit of observation is by city pair-month. The dependent variables are the logarithms of e-commerce trade amount, deal volume (total number of transactions), seller concentration ratio, and buyer concentration ratio, as detailed in Section 3.2. The independent variable of interest is the partnership pair. All columns control for the export (Exp.) city-month and import (Imp.) city-month fixed effects (FEs). Standard errors are clustered at the city pair level and reported in parentheses.
***Statistical significance at the 1% level.
Table 3 displays our main results based on the spatial RD, where partnership pairs and control pairs are in close proximity and balanced in all observable characteristics. Consistent with the gravity model, we find that the partnership causes a 4.8% increase in the overall e-commerce trade amount and that the effect is asymmetric in direction. For west to east trade, the effect is 10.0%, whereas for east to west trade, it is negligible and not statistically significant. The effects on the number of deals are similar (3.1% overall and 6.0% west to east trade), suggesting that the effects are driven by more goods sold rather than the composition of transactions across different price tiers. Overall, the regional partnership promotes trade between partnered city pairs, notably helping sellers from economically disadvantaged regions in West China tap into the market in East China.
|
Table 3. Spatial RD: Main Results
| Dependent variable | Both directions | East to west | West to east | Both directions | East to west | West to east |
|---|---|---|---|---|---|---|
| Partnership pair | 0.048*** | −0.004 | 0.100*** | 0.031*** | 0.002 | 0.060*** |
| (0.016) | (0.015) | (0.028) | (0.010) | (0.010) | (0.017) | |
| Yes | Yes | Yes | Yes | Yes | Yes | |
| Exp. city-month FEs | Yes | Yes | Yes | Yes | Yes | Yes |
| Imp. city-month FEs | Yes | Yes | Yes | Yes | Yes | Yes |
| Exp. seg.-imp. seg. FEs | Yes | Yes | Yes | Yes | Yes | Yes |
| Adjusted R2 | 0.967 | 0.988 | 0.935 | 0.993 | 0.996 | 0.987 |
| F-statistic | 4.91 | 10.16 | 19.68 | 5.71 | 3.13 | 13.76 |
| Observations | 1,148,400 | 574,200 | 574,200 | 1,148,400 | 574,200 | 574,200 |
| Seller concentration ratio | Buyer concentration ratio | |||||
| Partnership pair | 0.048 | 0.101 | −0.007 | 0.108 | 0.191 | 0.024 |
| (0.214) | (0.236) | (0.357) | (0.189) | (0.244) | (0.289) | |
| Yes | Yes | Yes | Yes | Yes | Yes | |
| Exp. city-month FEs | Yes | Yes | Yes | Yes | Yes | Yes |
| Imp. city-month FEs | Yes | Yes | Yes | Yes | Yes | Yes |
| Exp. seg.-imp. seg. FEs | Yes | Yes | Yes | Yes | Yes | Yes |
| Adjusted R2 | 0.528 | 0.669 | 0.442 | 0.549 | 0.683 | 0.444 |
| F-statistic | 1.11 | 4.61 | 9.19 | 0.474 | 3.899 | 5.641 |
| Observations | 1,136,426 | 574,134 | 562,292 | 1,137,650 | 574,135 | 563,515 |
Notes. This table reports the regression results of the spatial RD model. The distance threshold is set at 100 km. The unit of observation is city pair-month. The dependent variables are the logarithms of e-commerce trade amount, deal volume (total number of transactions), seller concentration ratio, and buyer concentration ratio, as detailed in Section 3.2. The independent variable of interest is the partnership pair. All columns control for the export (Exp.) city-month, import (Imp.) city-month, and export segment-import segment (Exp. seg.-imp. seg.) fixed effects (FEs). Standard errors are clustered at the city pair level and reported in parentheses.
***Statistical significance at the 1% level.
The main effects are economically significant. The partnership effect is equivalent to reducing the distance between city pairs by 14.4% overall or by 30% from west to east. A simple back-of-the-envelope calculation implies that the partnership increases trade between all 128 partnership pairs over the five years by an amount in the range of 2–3 billion Chinese yuan (0.30–0.45 billion U.S. dollars).
How are the benefits of the partnership distributed across different buyers and sellers? We find that the effects are not driven by large sellers or buyers disproportionately benefiting from the partnership. The lower panel of Table 3 shows that the partnership effect on the seller concentration ratio is small and is overall not statistically significant. The west to east effect on the seller concentration ratio is a precise zero: −0.007 with a standard error of 0.357, relative to the disguised sample average of 89.07 (the true value is of a similar magnitude), suggesting that the city partnership benefits both major sellers and small sellers equally. Similarly, the effect on the buyer concentration ratio has an estimated coefficient of 0.024 (standard error of 0.289) relative to the disguised sample average of 82.88 (the true value is of a similar magnitude), suggesting that major buyers alone do not drive the increase in e-commerce trade from west to east.
5.2. Robustness Checks
5.2.1. The Main Identification Strategy.
First, we note that our spatial RD strategy balances the treated and control city pairs. Table A.6 in the Online Appendix shows that within the bandwidth of d = 100 km or shorter, the observable characteristics of city pairs in 2017 are not correlated with the treatment status. Table A.25 in the Online Appendix shows that the treatment has no effect on offline overall or west to east trade using the standard input-output table in the year 2012 when e-commerce was still relatively nascent (6.3% of total consumption), suggesting that the treatment is not systematically correlated with offline trade barriers.
The main result of the partnership effect on trade is robust across a wide range of alternative regression specifications. Tables A.9 and A.10 in the Online Appendix show that the estimates remain consistent when we include either export segment-import segment-month fixed effects or city and month fixed effects.
The spatial RD is also robust across a wide range of bandwidths. Table A.11 in the Online Appendix presents the spatial RD estimates for distances of 50, 75, 125, and 150 km. All results are robust. Furthermore, we address potential cultural differences between the treatment and control pairs by restricting the treated cities and control cities to be in the same dialect district. The estimates reported in Table A.12 in the Online Appendix indicate that the main results remain robust.
We further test whether the results are consistent when we use different control groups. Specifically, in our main model, we have four types of control groups: (1) neither the eastern city nor the western city is in the program; (2) only the eastern city is in the program; (3) only the western city is in the program; and (4) both cities are in the program but are not partnered with each other. Online Appendix Tables A.21–A.24 show that if we exclude any of the four types of control groups, the results remain consistent not only for our main bandwidth of 100 km but also, for the bandwidths of 75 and 125 km.
Some segment pairs contain more than one treated city pair, which may lead to complications as the control pairs within these segment pairs are compared with multiple treated pairs. We exclude all of those segment pairs and estimate the main model in Online Appendix Table A.13, which shows that the results remain consistent.
5.2.2. Alternative Spatial RD Implementation.
The main results are robust to two alternative spatial RD design implementations. First, in spatial matching (see Online Appendix D.1 for details), for every treated pair, we match control pairs that are in close proximity and only include the spatially matched sample in the regression. In doing so, the same city pair may appear multiple times in the spatial matching, and it does not control for the segment pair fixed effect and thus, is less flexible than the main model. We report the summary statistics (Online Appendix Tables A.26 and A.27), and we find that the spatially matched sample is balanced with respect to a set of economic indicators (Online Appendix Table A.28). The estimation results (Online Appendix Table A.29) are similar to the main results; overall partnership significantly increases trade, and the effect is asymmetric in its direction (only west to east).
Second, we consider a regular RD design (see Online Appendix D.2 for details). In essence, it is similar to spatial matching but places more weight on treated and control city pairs that are closer to each other. The results from the regular RD design are similar to the main results based on segment-segment fixed effects. In Online Appendix Table A.30, we find that the RD estimates of the partnership effects on trade show a consistent effect both for the e-commerce trade amount (3%–4%) and for the deal volume (3%–4%) across a wide range of bandwidths from 60 to 130 km. Moreover, these effects are also significant only in the west to east e-commerce trade (6%–7%). Online Appendix Figure A.2 visualizes the pattern using regular RD plots. Furthermore, Online Appendix Table A.31 reveals that city partnerships do not significantly influence the seller and buyer concentration ratios, suggesting that both large and small sellers equally benefit, which is again consistent with our main model.
5.3. Heterogeneity Analyses
In this section, we test the heterogeneous effect across product categories, across regional and pair characteristics, and across time. We focus on west to east trade as the overall effect is solely driven by west to east trade.
5.3.1. Different Categories.
We break down the trade amount into six categories (clothing, food and beverage, household goods, electronics, healthcare, and others), and we separately estimate the spatially matched sample for each category. Table 4 shows that the partnership effects on west to east trade are present in clothing, food and beverage, and household goods. The most substantial effect is in the food and beverage category (12%). This finding aligns with the policy’s intention—to aid rural areas in West China where there are comparative advantages in agricultural products, particularly for households in poverty. The impact on clothing (which also includes shoes, leather, and accessories) is similar in magnitude, which is consistent with the observation that West China has rich supplies of leather, wool, and cotton, and the textile industry is one of the largest investments for creating local job opportunities in West China. The third category, household goods, encompasses a wide range of products, such as furniture, toys, kitchen items, and beauty items, which also show a significant effect. The remaining three categories—electronics, healthcare, and others—show no effect as expected. These categories are neither the comparative advantage of West China nor the priority areas of policy investment.
|
Table 4. Spatial RD: Categorical Analysis on West to East E-Commerce Trade Amount
| Category | Clothing | Food and beverage | Household goods |
|---|---|---|---|
| Partnership pair | 0.118*** | 0.120*** | 0.096** |
| (0.040) | (0.045) | (0.047) | |
| Yes | Yes | Yes | |
| Exp. city-month FEs | Yes | Yes | Yes |
| Imp. city-month FEs | Yes | Yes | Yes |
| Exp. seg.-imp. seg. FEs | Yes | Yes | Yes |
| Adjusted R2 | 0.892 | 0.941 | 0.906 |
| F-statistic | 4.52 | 3.99 | 13.75 |
| Observations | 574,200 | 574,200 | 574,200 |
| Electronics | Healthcare | Others | |
| Partnership pair | −0.041 | −0.025 | 0.035 |
| (0.051) | (0.076) | (0.053) | |
| Yes | Yes | Yes | |
| Exp. city-month FEs | Yes | Yes | Yes |
| Imp. city-month FEs | Yes | Yes | Yes |
| Exp. seg.-imp. seg. FEs | Yes | Yes | Yes |
| Adjusted R2 | 0.855 | 0.810 | 0.843 |
| F-statistic | 2.03 | 0.35 | 4.99 |
| Observations | 574,200 | 574,200 | 574,200 |
Notes. This table reports the regression results of the spatial RD model for six categories: clothing, food and beverage, household goods, electronics, healthcare, and others. The distance threshold is set at 100 km. The unit of observation is city pair-month. The dependent variable is the logarithm of the west to east e-commerce trade amount. The independent variable of interest is the partnership pair. All columns control for the export (Exp.) city-month, import (Imp.) city-month, and export segment-import segment (Exp. seg.-imp. seg.) fixed effects (FEs). Standard errors are clustered at the city pair level and reported in parentheses.
**Statistical significance at the 5% level; ***statistical significance at the 1% level.
5.3.2. Minority and GI Products in Western Cities.
West China is also home to the majority of China’s ethnic minorities, whereas the majority Han population predominantly inhabits Central and East China. Thus, the partnership potentially integrates ethnic minorities into the national market for inclusive growth. E-Commerce, in particular, has the potential to overcome cultural and language barriers (Brynjolfsson et al. 2019). We collect the share of minorities in the overall population for all western cities and use a median split to create the dummy variable ; then, we estimate the model that further includes its interaction with the partnership pair indicator. The result in Table 5, column (1) shows that the partnership effects are not only stronger but in fact, are solely driven by western cities that have high minority shares. Although this result apparently contrasts with the finding in Elfenbein et al. (2023), which documents that online trade is positively associated with cultural similarities, it could be explained by the migration mechanism discussed in Section 5.4.1 as follows. Migrants from western ethnic regions to their partnered eastern cities tend to purchase culturally specific products from their hometown sellers, items that are often scarce in offline markets.
|
Table 5. Heterogeneity Analyses for West to East E-Commerce Trade
| Panel A | ||||||
|---|---|---|---|---|---|---|
| Dependent variable | ||||||
| (1) | (2) | (3) | (4) | (5) | (6) | |
| Partnership pair | −0.015 | 0.051* | 0.026 | 0.017 | −0.032* | −0.019 |
| (0.020) | (0.029) | (0.022) | (0.016) | (0.017) | (0.029) | |
| Partnership pair × | 0.174*** | |||||
| (0.044) | ||||||
| Partnership pair × | 0.168*** | |||||
| (0.057) | ||||||
| Partnership pair × | 0.108*** | |||||
| (0.041) | ||||||
| Partnership pair × | 0.194*** | |||||
| (0.052) | ||||||
| Partnership pair × | 0.241*** | |||||
| (0.045) | ||||||
| Partnership pair × | 0.228*** | |||||
| (0.053) | ||||||
| Yes | Yes | Yes | Yes | Yes | Yes | |
| Exp. city-month FEs | Yes | Yes | Yes | Yes | Yes | Yes |
| Imp. city-month FEs | Yes | Yes | Yes | Yes | Yes | Yes |
| Exp. seg.-imp. seg. FEs | Yes | Yes | Yes | Yes | Yes | Yes |
| Adjusted R2 | 0.935 | 0.935 | 0.935 | 0.937 | 0.937 | 0.935 |
| F-statistic | 14.67 | 14.98 | 13.44 | 16.81 | 18.74 | 17.14 |
| Observations | 574,200 | 574,200 | 574,200 | 574,200 | 574,200 | 574,200 |
| Panel B | ||||||
|---|---|---|---|---|---|---|
| (7) | (8) | (9) | (10) | (11) | ||
| Partnership pair | −0.017 | −0.021 | 0.040 | 0.009 | 0.112*** | |
| (0.027) | (0.026) | (0.040) | (0.043) | (0.031) | ||
| Partnership pair × | 0.217*** | |||||
| (0.050) | ||||||
| Partnership pair × | 0.188*** | |||||
| (0.045) | ||||||
| Partnership pair × | 0.105** | |||||
| (0.053) | ||||||
| Partnership pair × | 0.147*** | |||||
| (0.052) | ||||||
| Partnership pair × | −0.031 | |||||
| (0.019) | ||||||
| Yes | Yes | Yes | Yes | Yes | ||
| Exp. city-month FEs | Yes | Yes | Yes | Yes | Yes | |
| Imp. city-month FEs | Yes | Yes | Yes | Yes | Yes | |
| Exp. seg.-imp. seg. FEs | Yes | Yes | Yes | Yes | Yes | |
| Adjusted R2 | 0.935 | 0.934 | 0.935 | 0.935 | 0.935 | |
| F-statistic | 17.30 | 17.05 | 14.43 | 16.45 | 13.23 | |
| Observations | 574,200 | 574,200 | 574,200 | 574,200 | 574,200 | |
Notes. This table reports the regression results of the spatial RD model, testing the heterogeneity in the main effect. The distance threshold is set to be 100 km. The unit of observation is by city pair-month. The dependent variables are the logarithms of the west to east e-commerce trade amount. The independent variables of interest are the interaction terms of the partnership pair and the corresponding subgroup indicators. All columns control for the export (Exp.) city-month, import (Imp.) city-month, and export segment-import segment (Exp. seg.-imp. seg.) fixed effects (FEs). Standard errors are clustered at the city pair level and reported in parentheses.
*Statistical significance at the 10% level; **statistical significance at the 5% level; ***statistical significance at the 1% level.
We formally test the idea that regions with more ethnic minorities may have a larger treatment effect because of more unique or exotic products.14 We use the number of GI products—products with specific geographical origin—as the measure of exotic products (see details in Section 3.3). We then use a similar median split to indicate regions with more GI products. We find that the number of GI products is indeed significantly correlated with the share of the minority population (Online Appendix Table A.8, panel A). Table 5, column (2) shows that the partnership effect is also significantly larger for western cities with more GI products. Thus, we believe that the number of GI products can be interpreted as a measure of e-commerce supply-side potentials unlocked by the partnership. We will also discuss how these are related to the supply side of e-commerce infrastructure measured by the number of e-commerce firms.
5.3.3. Economic Disparities.
We also explore how economic disparities and infrastructures affect the magnitude of the partnership effect. Specifically, we consider the following measures: (1) the difference in GDP of partnered cities; (2) internet and mobile phone penetration rates in West China; and (3) measures of physical infrastructure, including high-speed rail, freeway density, and road densities. The latter two categories of measures, although related to e-commerce, are also strongly correlated with GDP per capita (Online Appendix Table A.8, panel B).
Our findings are consistent; the partnership effect is more pronounced in western cities that are relatively less developed (Table 5, column (3)), have poorer physical infrastructure (Table 5, columns (4)–(6)), and are less connected to the internet and mobile networks (Table 5, columns (9) and (10)). These results uniformly suggest that the policy is most effective in regions with the largest income gaps relative to East China and in areas with poorer digital and physical infrastructure. The fact that the policy’s greatest impact is seen in areas most in need of assistance indicates that it has indeed achieved its objective of targeting poverty, particularly absolute poverty.
We then consider whether the number of e-commerce firms that capture the supply side of online trade plays a role in taking advantage of the partnership. We measure the number of newly entered firms related to the e-commerce industry in 2018 as well as cumulative to 2021 and test the heterogeneous effects. We find that the magnitude of the partnership effect is strongly associated with the number of e-commerce firms in western cities (Table 5, columns (7) and (8)), implying that western cities with superior e-commerce supply side will benefit more from the partnership. To alleviate the reverse causality concern, we test the heterogeneity (HTE) using the lagged number of e-commerce firms and find similar results (Online Appendix Table A.7, columns (4) and (5)). This result is consistent with the HTE of GI products, which also shows that regions with more supply-side potentials benefit more from the partnership.
As an additional observation, we note that the distance between city pairs does not significantly moderate the effect (Online Appendix Table A.7, column (3)). This indicates that although the pattern observed in Figure 2 might suggest a larger impact within the gravity model, such an implication does not extend to the causal spatial RD design.
5.3.4. Dynamic Effects: The COVID-19 Pandemic.
The COVID-19 pandemic, which emerged at the start of 2020, has significantly impacted the e-commerce industry both in China and globally (Alcedo et al. 2022, Alipour et al. 2022, Han et al. 2022). However, its impact on the effectiveness of the partnership policy remains unclear. On one hand, the pandemic might have shifted consumer shopping behaviors across online and offline channels, potentially amplifying the policy’s effects as observed in online trade. On the other hand, the pandemic may have negatively impacted offline exchanges, visits, and migrations.
In Table 5, column (11), we report the estimates of the partnership effects before and after the outbreak of the COVID-19 pandemic (defined as January 2020). We find that there are no significant changes in the west to east e-commerce trade. This could be attributed to the limited disruption in offline interactions owing to China’s zero COVID-19 policies, at least before 2022.
5.4. Mechanisms
In this section, we further explore the underlying mechanisms of the city partnership effect on e-commerce trade. Again, we focus on the west to east trade in the main paper.
5.4.1. Migration.
One potential explanation for the partnership effects is China’s internal migration, which has been well documented in the literature (Chan 2013). Specifically, a key policy within the partnership framework encourages residents from western cities to find jobs in their partnered cities (labor export), which may help to remove frictions, such as liquidity constraints in migration (Cai 2020). Once settled, these migrants might buy goods from their hometowns online (related to the literature on brand preferences of migrating consumers) (e.g., Bronnenberg et al. 2012), leading to an increase in e-commerce trade between partnered cities from west to east.
To test this hypothesis, we first show that the partnership increases west to east migration using the migration flow data described in Section 3.4 and the same spatial RD model as the main specification. Column (1) in panel A of Table 6 shows that the migration ratio between partnered cities is indeed significantly higher than that for neighboring control city pairs. We then include the migration flows in the benchmark spatial RD model on trade. Column (3) in panel B of Table 6 shows that (1) migration has a significantly positive effect on trade and that (2) the partnership effect decreases in magnitude but still remains statistically significant. We further test whether the mediating role of migration is significant by testing whether the inclusion of migration flows in the specification leads to a statistically significant change in the estimated partnership effect.15 We find that this change is significant at the 1% level for e-commerce trade, indicating that migration significantly (but also only partially) mediates the partnership effect.
|
Table 6. Mechanisms: Intercity Migration and Awareness of Partnered Cities
| Panel A | ||
|---|---|---|
| Dependent variable | Pre-CNY traffic ratio | |
| (1) | (2) | |
| Partnership pair | 0.528** | 0.121*** |
| (0.162) | (0.020) | |
| Yes | Yes | |
| Exp. city FEs | Yes | No |
| Imp. city FEs | Yes | No |
| Exp. city-month FEs | No | Yes |
| Imp. city-month FEs | No | Yes |
| Exp. seg.-imp. seg. FEs | Yes | Yes |
| Adjusted R2 | 0.762 | 0.850 |
| F-statistic | 13.26 | 17.81 |
| Observations | 19,140 | 1,148,400 |
| Panel B | |||
|---|---|---|---|
| (3) | (4) | (5) | |
| Partnership pair | 0.055*** | 0.066*** | 0.052*** |
| (0.019) | (0.019) | (0.019) | |
| Pre-CNY traffic ratio | 0.009*** | 0.008*** | |
| (0.001) | (0.001) | ||
| 0.027*** | 0.026*** | ||
| (0.004) | (0.004) | ||
| Yes | Yes | Yes | |
| Exp. city-month FEs | Yes | Yes | Yes |
| Imp. city-month FEs | Yes | Yes | Yes |
| Exp. seg.-imp. seg. FEs | Yes | Yes | Yes |
| Adjusted R2 | 0.949 | 0.951 | 0.949 |
| F-statistic | 24.71 | 26.78 | 29.71 |
| Observations | 574,200 | 574,200 | 574,200 |
Notes. This table reports the regression results of the spatial RD model, testing the mechanisms of intercity migration and awareness of partnered cities. The distance threshold is set at 100 km. The unit of observation is by city pair-month. The dependent variable is the logarithm of the west to east e-commerce trade amount. All columns control for the export (Exp.) city-month, import (Imp.) city-month, and export segment-import segment (Exp. seg.-imp. seg.) fixed effects (FEs). Standard errors are clustered at the city pair level and reported in parentheses.
**Statistical significance at the 5% level; ***statistical significance at the 1% level.
The results prove robust across various migration measures, including data from any of the years between 2019 and 2021 and both pre-CNY and post-CNY traffic (Online Appendix Table A.15); this is expected because both pre-CNY traffic and post-CNY traffic measure the same underlying west to east migration population that goes back to their hometowns in West China before CNY and returns to East China afterward. We also test the effects of the reverse east to west migration. Although the partnership increases migration in this direction, it has negligible effects on trade (Online Appendix Table A.16), which is expected given that the majority of migrations in China go from rural to urban areas—in this context, overwhelmingly west to east.
5.4.2. Awareness of Partnered Cities.
We also test whether the partnership increases eastern consumers’ awareness of and interest in their partnered regions in West China, thus increasing the west to east online trade between partnered cities. To measure consumer awareness, we use the Baidu search index data as described in Section 3.4, which we match with the main trade flow data in the opposite direction; for example, for trade from city i to city j, we match the search index of keyword city i from residents in city j to capture the demand-side awareness. We then test the mediating role of consumer awareness as follows.
First, we test whether the partnership increases Baidu search using the same spatial RD specification as the main model. Column (2) in panel A of Table 6 shows that partnership indeed causes more Baidu searches in both directions; on average, the treatment increases the search index by around 12%. Column (4) in panel B of Table 6 shows that more Baidu searches lead to more west to east trade. The direct effect, however, remains statistically significant, albeit smaller in magnitude. We also test the significance of the change in the estimated partnership effect after including Baidu searches. We find that this change is statistically significant at the 1% level, showing a partial mediating role of Baidu searches.
We further jointly test the two mechanisms of migration and awareness by including both mediators in the main model. As column (5) in panel B of Table 6 shows, both migration and Baidu search still have significant effects on online trade, with point estimates close to independently estimating their mediation. The direct effect remains statistically significant. Thus, the evidence suggests that both mechanisms coexist and that, together, they only partially explain the main effect. Finally, as a side note, we find that both migration and awareness also affect east to west trade, despite the partnership having no direct effect (Online Appendix Table A.17). This suggests that migration and consumer awareness, independent of the partnership, also correlate with online trade, which is consistent with our approach of using these two measures as mediators.
5.4.3. Alternative Mechanisms.
We also explore several alternative mechanisms of the partnership effect. The first is purchases from the public sector, including local governments and state-owned enterprises that may deliberately purchase goods from the partnered city to fulfill the requirements of poverty alleviation. Although there are no data available on public spending on e-commerce, these spendings typically occur at the end of the year16 or during the Chinese New Year because the governments tend to spend all budgets before the new fiscal year starts. Motivated by this observation, we test whether the partnership effects vary during these periods. The results reported in Table 7 show that the partnership effects on the west to east e-commerce trade do not change significantly at the end of the year or during the Chinese New Year, which indicates that the partnership effects are unlikely to result of public sector spending. Furthermore, the precisely estimated zero effect on the buyer concentration ratio (Table 3) suggests that the effects are not driven by a few main buyers as we would expect from public sector spending.
|
Table 7. Mechanisms: Targeted Subsidies
| Dependent variable | ||
|---|---|---|
| (1) | (2) | |
| Partnership pair | 0.100*** | 0.100*** |
| (0.028) | (0.028) | |
| Partnership pair × | −0.004 | |
| (0.017) | ||
| Partnership pair × | 0.002 | |
| (0.022) | ||
| Yes | Yes | |
| Exp. city-month FEs | Yes | Yes |
| Imp. city-month FEs | Yes | Yes |
| Exp. seg.-imp. seg. FEs | Yes | Yes |
| Adjusted R2 | 0.934 | 0.935 |
| F-statistic | 13.16 | 13.18 |
| Observations | 574,200 | 574,200 |
Notes. This table reports the regression results of the spatial RD model, testing the mechanism of targeted subsidies. The unit of observation is city pair-month. The dependent variable is the logarithm of the west to east e-commerce trade amount. The independent variables of interest are the interaction terms between the partnership pair and the time period indicators. All columns control for the export (Exp.) city-month, import (Imp.) city-month, and export segment-import segment (Exp. seg.-imp. seg) fixed effects (FEs). Standard errors are clustered at the city pair level and are reported in parentheses.
***Statistical significance at the 1% level.
Additionally, we test whether the effect is driven by reduced transportation costs. We collect data on flight routes between all city pairs in China in 2019. We find that the partnership has no significant impact on the number of direct flights between city pairs (Online Appendix Table A.18), and controlling for the flights does not alter the main effect (Online Appendix Table A.19). We thus conclude that this mechanism is unlikely.
5.5. Implications and Discussions
In line with standard gravity models used in trade studies, in our research design the overall export growth attributed to e-commerce development is fully captured by the export city-time fixed effects. Thus, the empirical strategy does not allow for a direct test of whether the policy promoted overall e-commerce growth in West China. Nevertheless, we can analyze the correlation between the heterogeneous effects and the overall growth of e-commerce. To do so, we split the western regions by their GDP and e-commerce growth rates during the sample period, respectively. The results show that western regions with larger treatment effects also exhibit stronger economic growth (Online Appendix Table A.7, column (1)) and overall e-commerce export growth (Online Appendix Table A.7, column (2)). Additionally, we find a significant correlation between overall e-commerce exports and both overall GDP growth and the GDP of the primary and tertiary sectors (Online Appendix Table A.35).
All HTE results can be interpreted in two ways. First, the heterogeneity of the effect may be correlated with the treatment intensity. Second, they may indicate different responses to the policy. In the case of economic and e-commerce growth, these results can be interpreted as indicative of the policy’s role in promoting overall economic growth and specifically, e-commerce exports. Alternatively, they may also indicate that western regions with more growth potential could have benefited more from the partnership. These two interpretations have different policy implications, with the former indicating the role of the partnership policy in promoting growth and the latter pointing out potentially effective targeting of partnership. The same caution applies to other HTE results, including the e-commerce infrastructure. Separately identifying the interpretations is beyond the scope of the current paper.
The migration mechanism also has important policy implications; the west to east migration, including organized labor export under the partnership framework, not only helps migrants find jobs but also indirectly benefits the businesses and residents who remain in western China through e-commerce trade.
There are two potential counterfactual scenarios related to the implication of this result. First, there are reasons to believe that the partnership reduces migration frictions, leading to a more efficient spatial distribution of labor and capital. This likely implies an increase in the productivity and income of the migrants, ultimately enhancing their purchasing power.17 Consequently, their e-commerce purchases may exceed what their offline purchases would have been had they not migrated.18
Second, given the partnership-driven migration, without e-commerce, migrants could not have bought many products from their hometowns through offline channels. Thus, the increase in e-commerce trade among partnership pairs with more migration may reflect new trade that would not have happened without e-commerce. In other words, migrants may be more than substituting offline purchases (of goods from their hometowns; for example, in supermarkets) for online purchases. If this was not the case, one would expect to see a negative effect of the partnership on offline trade. We test the idea using offline trade-flow data and find no such effect. Specifically, we use the input-output tables for 2017 (the most recent data available) between all city pairs in China. Using the same spatial RD model, we find no effect on offline trades (Online Appendix Table A.25). Thus, the results do not support such pure online-offline substitution. Relative to this counterfactual, we believe that the results show that e-commerce can potentially alleviate the aforementioned negative effect of migration (i.e., shrinking the demand in the local product market) on the population that remains in West China. E-Commerce thus complements migration in alleviating poverty in West China by keeping some of their purchasing power in West China.
The awareness mechanism shows that the partnership generates consumer interest in the paired western cities, which translates to higher demand for products sold by sellers in these partnership cities. The fact that neither migration nor consumer awareness completely accounts for the result indicates that additional mechanisms are contributing. This is to be expected because of the scale and complexity of the partnership policy. For example, there may be supply-side mechanisms that help western cities develop and market products that consumers in their partnered eastern cities prefer. These mechanisms may be related to the positive moderating roles of the number of GI products and e-commerce firms, which may be correlated with the positive HTE on the share of the minority population. The government official visits and exchanges or the investment amounts promoted through the partnership may also be relevant. However, because of the data limitation in measuring these mechanisms, we leave their detailed exploration for future research.
6. Concluding Remarks
Despite the potential of online platforms to connect remote regions, it remains unclear how they may contribute to alleviating regional inequality. This study focuses on how e-commerce interacts with a significant inclusive growth policy that pairs prosperous and fast-growing regions in East China with low-income regions in West China. We test whether the policy promotes e-commerce trade; how benefits are distributed across sectors, regions, and different sellers; and what the mechanisms are. We find that the partnership policy indeed increases e-commerce trade and that the increase is driven by more exports from low-income regions to high-income ones. By exploring the rich heterogeneities of the effects, we find that they are mostly driven by categories that abound in West China, between regional pairs with large economic gaps, and from regions in West China with better e-commerce infrastructure. We also find that policy-driven migration as well as consumer awareness can partially explain the increase in trade.
These findings have important policy implications. We are the first study to document the economic effects of the East-West Poverty Alleviation Partnership, a major policy that contributed to the largest reduction of poverty in human history to date. We find that the policy significantly promoted e-commerce trade by a magnitude of billions of Chinese yuan over the past few years. The findings also highlight conditions under which the policy is most effective (for example, low-income regions with superior e-commerce infrastructure as well as more GI products), which underline the importance of the supply side in promoting e-commerce trade from underdeveloped regions. The migration mechanism implies an unintended consequence of migration, which benefits their hometowns through e-commerce. The consumer awareness mechanism highlights the potential of the policy to “market” the cities in West China.
Several insights from this study may apply to contexts beyond China. The main effect shows that policies targeting regional inequalities can be mutually beneficial instead of mere redistribution. By leveraging e-commerce and digital platforms, policymakers in other countries can potentially replicate these benefits to address economic disparities and help small businesses. The heterogeneous effects show that such policies will be most successful in the least-developed regions with supply-side characteristics, such as e-commerce infrastructure and GI products. The mechanisms of migration and consumer awareness can also work in other contexts. In many developing countries, such as India, rural to urban migration is still ongoing. The results thus suggest that such migration can benefit the originating regions of the migrants through e-commerce trade. Other initiatives, such as sister cities, can also promote e-commerce trade through cultural exchanges and raising awareness.19
Our study has a few limitations. We estimate the effect on trade between city pairs. Because most regions are treated (but with different pairs), any region-level overall increases in trade are absorbed by the fixed effects and cannot be estimated within the current framework. The effects are partial equilibrium results that cannot be easily aggregated. Although some results suggest that the effect is not solely driven by redistribution (the effect remains robust for only using city pairs of a focal export city and the neighboring cities of its partnered import city as control, whereas redistribution is more likely between neighboring export cities), formal tests for redistribution remain outside of the scope of this study.
All these limitations lead to future areas of research. In addition, we believe that testing how e-commerce interacts with other inclusive policies will be important. It will also be interesting to estimate how the partnership policy affects other significant outcomes, such as education and gender/ethnic inequalities.
The authors thank the senior editor, the associate editor, two anonymous reviewers, Avi Goldfarb, Daniel Trefler, Xiaobo Zhang, Li-An Zhou, and Chenming Zuo as well as seminar participants at the 2023 Marketing Science Diversity, Equity, and Inclusion conference, the 13th Annual Theory + Practice in Marketing Conference (2023), the 2023 Econometric Society Asia Meeting, the University of Toronto, Peking University, Hong Kong University of Science and Technology, Chinese University of Hong Kong, Chinese University of Hong Kong - Shenzhen, and Zhejiang University for their feedback. This paper reflects the views of the authors and should not be interpreted as reflecting the views of Alibaba. J. Li worked as an intern at the Luohan Academy, an open research institute previously affiliated with the Alibaba Group. P. Li is currently an employee of Alibaba Group. As required by the company’s rules of data privacy, Alibaba Group has a right to remove its trade secrets from the paper. J. Li’s current affiliation is Marketing & Analytics, UCL School of Management, University College London, London E14 5AA, United Kingdom.
1 Before 2017, although some city-level partnership pairs existed, there was no systematic policy to organize city-level partnerships.
2 See pp. 768–777 in the 2018 Yearbook of China’s Poverty Alleviation and Development (2019).
3 The 87 eastern cities belong to six provinces and three municipalities, including Beijing, Shanghai, Tianjin, Liaoning, Jiangsu, Zhejiang, Fujian, Shandong, and Guangdong, and the 110 western cities belong to nine provinces and one municipality, including Chongqing, Gansu, Guangxi, Guizhou, Inner Mongolia, Ningxia, Qinghai, Shaanxi, Sichuan, and Yunnan; see Table A.1 in the Online Appendix for more details.
4 See http://www.gov.cn/xinwen/2017-01/06/content_5157037.htm.
5 We used the numbers of companies registered in the categories of digital services. See http://www.stats.gov.cn/sj/tjbz/gjtjbz/202302/t20230213_1902784.html (in Chinese) for the codes.
6 This was published by the China National Intellectual Property Administration. See https://www.cnipa.gov.cn/col/col1388/index.html (in Chinese).
7 We obtain the data from Carbon Emission Accounts & Datasets (Zheng et al. 2022). Other studies using similar data include Yuan et al. (2019), Chen and Zhao (2023), and Wang et al. (2024).
8 Census data, such as the sample from the 2015 China 1% Population Census, are too sparse for city pair-level migration.
9 For example, the inflow data show that on January 19, 2020 (before CNY), of all migrants arriving in the western city of Leshan, 1.45% originated from the eastern city of Shenzhen, and 0.40% originated from the eastern city of Foshan. The outflow data show that on January 29, 2020 (after CNY), of all migrants departing from Leshan, 1.01% went to the eastern city of Shenzhen, and 0.19% went to the eastern city of Foshan. However, much of this difference is attributable to the population disparity between Shenzhen (17.63 million) and Foshan (9.52 million). Therefore, calculating the ratio based on the origin cities (here, Shenzhen and Foshan) helps to account for this difference in scale.
10 It is determined by the Chinese Ministry of Transport as 15 days before CNY and 25 days after CNY: January 21 to March 1, 2019 and January 28 to March 8, 2021. For 2020, because of the COVID-19 outbreak around the CNY of January 25, 2020, we use the days between January 1 and March 31.
11 We can also calculate the corresponding east to west outflow pre-CNY traffic and west to east inflow post-CNY traffic. These measures are theoretically equivalent to the ones we use. However, this approach encounters more measurement challenges because of the larger total migration population to and from eastern cities, resulting in many observations falling below the minimum threshold of 0.01% because of a larger denominator.
12 Table A.4 in the Online Appendix shows the distribution of segment size for different bandwidth choices, and Figure A.1 in the Online Appendix illustrates the segments on the map. Table A.6 in the Online Appendix further shows that as long as the bandwidth is no greater than 100 km, the observable characteristics are balanced such that they can no longer predict the treatment status.
13 Additionally, in Online Appendix Table A.20, we present the summary statistics for the consumption shares for each category both for the full sample and within segments. The results demonstrate that within a segment, the absolute difference between treated and control cities is small compared with the variation in the full sample. For example, the absolute difference in the share of food and beverage within segments has a mean of 0.84, which is one order of magnitude smaller than the standard deviation of 8.74 of the full sample. This indicates that cities within the same segment indeed exhibit similar patterns in terms of online consumption. In Online Appendix Table A.25, we show that treated and control pairs had similar offline trades in 2012 and 2017.
14 We thank an anonymous reviewer for this suggestion.
15 Other standard mediation tests, such as the Sobel test, do not apply in our setting for two reasons. First, whereas all our models are linear, they include multiple high-dimensional fixed effects that may be different across the models. Second, the mediator (migration) is measured at the city pair level, whereas our main model is at the city pair-month level.
16 According to Chinese law (http://www.npc.gov.cn/zgrdw/englishnpc/Law/2007-12/12/content_1383623.htm), a budgetary year begins on January 1 and ends on December 31 in a calendar year. Because of the use-it-or-lose-it budget, year-end crash expenditure is well known. For example, see http://www.jryj.org.cn/EN/abstract/abstract588.shtml (in Chinese). In the U.S. context, similar wasteful year-end spending has also been well documented (e.g., Liebman and Mahoney 2017).
17 The literature on exogenous migration typically finds an increase in earnings after migration because of natural disasters or policies aiming to promote migration (e.g., Bryan et al. 2014, Deryugina et al. 2018, Bryan and Morten 2019, Nakamura et al. 2022). There are studies showing similar effects for migrants from rural to urban areas in China (e.g., Du et al. 2005). In our context, the increase in earnings will likely be more pronounced because of the large wage gap between West China and East China than the settings in the literature.
18 There could also be secondary effects, such as information spillover from migrants to local consumers in their destination cities as well as remunerations sent by migrants to their family members in their hometowns. A formal analysis of this mechanism requires us to go beyond the reduced form approach to analyze the dynamic general spatial equilibrium on the allocation of capital, labor, and consumption, which is an active and understudied area of research (see Jia et al. 2023 for a recent review).
19 For example, see https://cities-today.com/how-sister-city-partnerships-can-play-a-new-role-in-a-global-economy/.
References
- (2010) Mobile phones and economic development in Africa. J. Econom. Perspect. 24(3):207–232.Crossref, Google Scholar
- (2022) E-commerce during covid: Stylized facts from 47 economies. NBER working paper, National Bureau of Economic Research, Cambridge, MA.Google Scholar
- (2022) The future of work and consumption in cities after the pandemic: Evidence from Germany. CESifo Working Paper No. 10000, Center for Economic Studies and Ifo Institute for Economic Research, Munich, Germany.Google Scholar
- (2018) Jobs for the heartland: Place-based policies in 21st century America. NBER Working Paper No. w24548, National Bureau of Economic Research, Cambridge, MA.Google Scholar
- (2021) Local protectionism, market structure, and social welfare: China’s automobile market. Amer. Econom. J. Econom. Policy 13(4):112–151.Crossref, Google Scholar
- (2006) Does the internet defy the law of gravity? J. Internat. Econom. 70(2):384–405.Crossref, Google Scholar
- (2012) The evolution of brand preferences: Evidence from consumer migration. Amer. Econom. Rev. 102(6):2472–2508.Crossref, Google Scholar
- (2019) The aggregate productivity effects of internal migration: Evidence from Indonesia. J. Political Econom. 127(5):2229–2268.Crossref, Google Scholar
- (2014) Underinvestment in a profitable technology: The case of seasonal migration in Bangladesh. Econometrica 82(5):1671–1748.Crossref, Google Scholar
- (2019) Does machine translation affect international trade? Evidence from a large digital platform. Management Sci. 65(12):5449–5460.Link, Google Scholar
- (2018) Post-disaster aid and development of the manufacturing sector: Lessons from a natural experiment in China. Eur. Econom. Rev. 101:441–458.Crossref, Google Scholar
- (2020) Migration under liquidity constraints: Evidence from randomized credit access in China. J. Development Econom. 142:102247.Crossref, Google Scholar
- (2011) Does aid for trade really improve trade performance? World Development 39(5):725–740.Crossref, Google Scholar
- (2022) Online business platforms and international trade. J. Internat. Econom. 137:103599.Crossref, Google Scholar
- (2013)
China: Internal migration . Ness I, ed. The Encyclopedia of Global Human Migration (Wiley, Hoboken, NJ), 1–13.Crossref, Google Scholar - (2023) External demand shock, economic rebalancing and the construction of a unified national market: A study based on dynamic quantitative spatial equilibrium. Econom. Res. J. 58(6):30–48.Google Scholar
- (2015) Great and small walls of China: Distance & Chinese e-commerce. Preprint, submitted October 1, https://dx.doi.org/10.2139/ssrn.2668023.Google Scholar
- (2021) Geography as branding: Descriptive evidence from Taobao. Quant. Marketing Econom. 19(1):53–92.Crossref, Google Scholar
- (2021) Connecting the countryside via e-commerce: Evidence from China. Amer. Econom. Rev. Insights 3(1):35–50.Crossref, Google Scholar
- (2010) The persistent effects of Peru’s mining Mita. Econometrica 78(6):1863–1903.Crossref, Google Scholar
- (2018) The economic impact of Hurricane Katrina on its victims: Evidence from individual tax returns. Amer. Econom. J. Appl. Econom. 10(2):202–233.Crossref, Google Scholar
- (2005) Migration and rural poverty in China. J. Comparative Econom. 33(4):688–709.Crossref, Google Scholar
- (2018) Place-based policies for development. NBER Working Paper No. w24562, National Bureau of Economic Research, Cambridge, MA.Google Scholar
- (2020) Place-based policies and spatial disparities across European cities. J. Econom. Perspect. 34(3):128–149.Crossref, Google Scholar
- (2023) The impact of socioeconomic and cultural differences on online trade. Management Sci. 69(10):6181–6201.Link, Google Scholar
- (2019) Internal geography, labor mobility, and the distributional impacts of trade. Amer. Econom. J. Macroeconomics 11(3):252–288.Crossref, Google Scholar
- (2018) The Alibaba effect: Spatial consumption inequality and the welfare gains from e-commerce. J. Internat. Econom. 114:203–220.Crossref, Google Scholar
- (2005) How did location affect adoption of the commercial internet? Global village vs. urban leadership. J. Urban Econom. 58(3):389–420.Crossref, Google Scholar
- (2019) Aid for trade and export diversification in recipient-countries. World Econom. 42(2):396–418.Crossref, Google Scholar
- (2019) Digital economics. J. Econom. Literature 57(1):3–43.Crossref, Google Scholar
- (2010) Information, direct access to farmers, and rural market performance in central India. Amer. Econom. J. Appl. Econom. 2(3):22–45.Crossref, Google Scholar
- (2022) Covid-19 and e-commerce operations: Evidence from Alibaba. Manufacturing Service Oper. Management 24(3):1388–1405.Link, Google Scholar
- (2009) The geography of trade in online transactions: Evidence from eBay and Mercadolibre. Amer. Econom. J. Microeconomics 1(1):53–74.Crossref, Google Scholar
- (2014) Who benefits from aid for trade? Comparing the effects on recipient vs. donor exports. J. Development Stud. 50(9):1275–1288.Crossref, Google Scholar
- (2020) Facilitating inclusive global trade: Evidence from a field experiment. Management Sci. 66(4):1737–1755.Link, Google Scholar
- (2020) Place-based policies, state-led industrialisation, and regional development: Evidence from China’s Great Western Development Programme. Eur. Econom. Rev. 123:103398.Crossref, Google Scholar
- (2023) The economics of internal migration: Advances and policy questions. J. Econom. Literature 61(1):144–180.Crossref, Google Scholar
- (2021) The great Chinese inequality turnaround. J. Comparative Econom. 49(2):467–482.Crossref, Google Scholar
- (2019) Does aid for trade diversify the export structure of recipient countries? World Econom. 42(9):2684–2722.Crossref, Google Scholar
- (2014) People, places, and public policy: Some simple welfare economics of local economic development programs. Annual Rev. Econom. 6(1):629–662.Crossref, Google Scholar
- (2016) Aid for trade and greenfield investment. World Development 84:206–218.Crossref, Google Scholar
- (2015) Spatial rebalancing and industrial convergence in China. China Econom. Rev. 34:39–63.Crossref, Google Scholar
- (2016) There goes gravity: eBay and the death of distance. Econom. J. 126(591):406–441.Google Scholar
- (2005) Political turnover and economic performance: The incentive role of personnel control in China. J. Public Econom. 89(9–10):1743–1762.Crossref, Google Scholar
- (2017) Do expiring budgets lead to wasteful year-end spending? Evidence from federal procurement. Amer. Econom. Rev. 107(11):3510–3549.Crossref, Google Scholar
- (2017) Spatio-temporal patterns of rural poverty in China and targeted poverty alleviation strategies. J. Rural Stud. 52:66–75.Crossref, Google Scholar
- (2019) Place-based policies, creation, and agglomeration economies: Evidence from China’s economic zone program. Amer. Econom. J. Econom. Policy 11(3):325–360.Crossref, Google Scholar
- (2009)
Social entitlement exchange and balanced economic growth . Fan S, Kanbur R, Zhang X, eds. Regional Inequality in China (Routledge, London), 258–269.Google Scholar - (2019) E-commerce development and household consumption growth in China. World Bank policy research working paper, World Bank, Washington, DC.Google Scholar
- (2017) Is aid for trade effective? A panel quantile regression approach. Rev. Development Econom. 21(4):e175–e203.Google Scholar
- (2010) The pattern of growth and poverty reduction in China. J. Comparative Econom. 38(1):2–16.Crossref, Google Scholar
- (2022) The gift of moving: Intergenerational consequences of a mobility shock. Rev. Econom. Stud. 89(3):1557–1592.Crossref, Google Scholar
- (2015)
Place-based policies . Duranton G, Henderson JV, Strange WC, eds. Handbook of Regional and Urban Economics, vol. 5 (Elsevier, Amsterdam), 1197–1287.Google Scholar - (2016) Is IT enough? Evidence from a natural experiment in India’s agriculture markets. Management Sci. 62(9):2481–2503.Link, Google Scholar
- (2011) Aid, Dutch disease, and manufacturing growth. J. Development Econom. 94(1):106–118.Crossref, Google Scholar
- (2018) Positive spillovers and free riding in advertising of prescription pharmaceuticals: The case of antidepressants. J. Political Econom. 126(1):381–437.Crossref, Google Scholar
- (2022) Do place-based policies promote local innovation and entrepreneurship? Rev. Finance 26(3):595–635.Crossref, Google Scholar
- (2019) Advertising and demand for addictive goods: The effects of e-cigarette advertising. Marketing Sci. 38(6):994–1022.Abstract, Google Scholar
- (2012) Does aid for trade enhance export performance? Investigating the infrastructure channel. World Econom. 35(7):838–868.Crossref, Google Scholar
- (2024) Low-carbon economic resilience: The inequality embodied in inter-regional trade. Cities 144:104646.Crossref, Google Scholar
- Yearbook of China’s Poverty Alleviation and Development (2019) Yearbook of China’s Poverty Alleviation and Development 2018 (China Agricultural Press, Beijing), 768–777.Google Scholar
- (2019) Estimation and decomposition of China’s interregional trade cost from the perspective of value added trade. Statist. Res. 36(2):63–75.Google Scholar
- (2021) A survey on income inequality in China. J. Econom. Literature 59(4):1191–1239.Crossref, Google Scholar
- (2012) Regional inequality in contemporary China. Ann. Econom. Finance 13(1):113–137.Google Scholar
- (2019) Geography still matters: Examine the role of location in online markets for foreign branded products. Decision Sci. 50(2):285–310.Crossref, Google Scholar
- (2022) Entropy-based Chinese city-level MRIO table framework. Econom. Systems Res. 34(4):519–544.Crossref, Google Scholar