Estimating Marketing Component Effects: Double Machine Learning from Targeted Digital Promotions
Abstract
We estimate the causal effects of different targeted email promotions on the opening and purchase decisions of the consumers who receive them. To do so, we synthesize and extend recent advances in causal machine learning techniques to capture heterogeneity in the content of the email subject line itself as well as heterogeneous consumer responses to the promotional offers and semantic choices contained therein. We find that content and framing are important for driving performance. We identify precise causal estimates of the effects of individual deal components, personalized content, and various semantic choices on consumer outcomes all the way down the conversion funnel. The decompositional nature of our methodology allows us to show how different combinations of key words and promotional inducements produce significantly different outcomes, both within a given stage and across all stages of the funnel. Notably, discounts framed as clearance events sharply outperform those tied to particular products. We also find components that drive engagement at the top of the funnel don’t always lead to conversion at the bottom: their efficacy, across the funnel, is significantly moderated by the engagement levels of the consumers who receive them. Finally, leveraging both aspects of heterogeneity, we use off-policy evaluation to demonstrate the potential for significant gains from improved targeting.
History: K. Sudhir served as the senior editor and Hema Yoganarasimhan served as associate editor for this article.
Supplemental Material: The online appendix and data are available at https://doi.org/10.1287/mksc.2022.1401.
1. Introduction
Most marketing interventions are inherently complex and multidimensional in nature. Television advertisements contain a multitude of treatment components, including visual images, subtextual cues, direct promotions, and subtle design elements, each chosen to collectively spark a desired consumer response. Similarly, online display ads often feature visual design elements alongside textual claims or specific promotional offers, whereas digital push notifications can contain both text messages and visual imagery. Nonetheless, when measuring the impact of these interventions, both researchers and practitioners typically quantify only the composite effect of the underlying treatment components as a whole. Perhaps not surprisingly, large-scale meta-studies that include many ad campaigns often find quite heterogeneous effects across campaigns (Johnson et al. 2017, Gordon et al. 2022), likely reflecting the differential impacts of their underlying composite treatments. Unbundling the separate impact of these myriad components to identify the source of this heterogeneity is rarely attempted, perhaps because of perceived issues of low statistical power, crippling selection biases, or the high-dimensional nature of the implied target. In this paper, we seek to decompose the heterogeneous effects of the individual treatment components present in compound digital interventions.
Our empirical application focuses on the subject-line content of targeted email promotions. We recover precise causal estimates of individual deal components, personalized content, and various semantic choices on purchase and engagement, demonstrating the importance of content and framing for promotion performance. To do so, we synthesize and extend recent advances in doubly robust causal machine learning (ML) techniques to capture heterogeneity in the treatment components (i.e., promotional offers and semantic cues) present in the email subject line itself (compound intervention) as well as heterogeneous consumer responses to those components. We make two primary contributions to the literature. First, we demonstrate how machine learning can be leveraged in a unified framework to provide precise causal estimates of the effect of separate components in a high-dimensional marketing intervention, using only observational data. Second, we apply our proposed approach to data from 34 distinct email promotions sent by a retailer to more than 1.3 million individuals to first demonstrate how specific content choices produce significant differences in outcomes and then identify the source of those differential effects. We find statistically significant and economically meaningful effects of content choice all the way down the conversion funnel. We further show that the efficacy of these components across the funnel is significantly moderated by the engagement levels of the consumers who receive them. Finally, we demonstrate how exploiting the heterogeneity in the recovered response mechanism can yield a meaningful increase in profitability.
We provide a unified framework for estimating the heterogeneous treatment effects of heterogeneous treatments that leverage recent advances in the causal ML literature. Our compound “treatments” are targeted email promotions, which themselves comprise several distinct design elements or “treatment components.” We analyze their effects in two ways; both require an “orthogonalized signal” (a key feature of the doubly robust framework), but each differ in how they process this signal. In the first part of the analysis, we choose an email as baseline and estimate the pairwise causal treatment effect parameters with respect to each of the other 33 compound email treatments. We do so by using the doubly robust machine learning approach of Chernozhukov et al. (2018), in which estimated propensity score and outcome equations are used in tandem to address confounding induced by the targeting of treatments. Similar to recent meta-studies of online display ads, we find marked heterogeneity in the performance of different email promotions. In the second part, we follow Semenova and Chernozhukov (2021) in projecting the orthogonalized signals recovered in the first stage onto a low-dimension set of covariates characterizing both types of heterogeneity to explore key features of the mapping from the observed demographic and treatment components within each email to consumer responses. In so doing, we identify and measure the key components that drive the heterogeneity in overall performance.
We organize our substantive contributions around two goals. Our first goal is to recover unbiased estimates of the pairwise average treatment effects that compare each unique email to a designated baseline email.1 We further aim to capture heterogeneity in these pairwise contrasts for use in better targeting of the existing set of emails. Our second goal is to decompose the composite effect of each email treatment into these separate components (heterogeneity in the treatments) and further characterize the heterogeneous response to these choices (treatment effect heterogeneity). We find that accounting for targeting is materially important. For example, we show that the causal implication between a contrasting pair of email promotions is reversed if one fails to account for endogenous targeting. More generally, we find strong evidence that content and framing matter for performance: all promotions are not created equal. We show that measuring effects at the compound treatment level can be misleading, underscoring the importance of a component-level analysis. For example, we find that, although the effect of nonprice promotions is marginally positive with respect to price promotions, this composite effect of nonprice promotion conceals the fact that, whereas free shipping and free gift affect consumer actions positively, free returns and 50% off shipping yield negative effects across the entire funnel. This decompositional feature of our methodology allows us to demonstrate how different combinations of key words and promotional inducements produce significantly different outcomes, both within a given stage and across the full set of stages within the conversion funnel. For example, percentage discounts are very effective when framed as a clearance offer but actually detrimental when tied to particular products. On the other hand, a fixed rebate acts more like a pure price drop. Despite its lack of clear material benefit to the consumer, personalization produces sizable benefits at the open stage. However, when conditioned on consumer engagement, it yields opposing effects in the final purchase amount across engagement types.
Our observational email setting provides both challenges and opportunities for decomposing the impact of complex interventions.2 On the one hand, using the observed promotion bundles to infer the causal effects of their included design elements (treatment components) is complicated by the fact that promotions are typically targeted to particular consumers, creating a classic econometric confound (targeting bias). However, in many cases (including ours), it is natural to assume that this endogenous targeting can be addressed by statistical adjustments (e.g., weighting or matching) that account for these targeting rules directly. In particular, the use of a well-defined targeting or personalization policy corresponds directly to the classic unconfounded assignment condition, under which various treatment effect parameters are econometrically identified and several valid estimation approaches exist.3 Our proposed approach simply exploits this institutional feature. Through the use of ML in the first stage of our framework, we can nonparametrically match the policy function used by the firm in assigning treatment and identify the base-level response of individuals to treatment conditional on their observed covariates—a large vector of observed recency–frequency–monetary (RFM) variables in our application. The high-dimensional nature of our compound treatments, each a unique combination of promotional, contextual, and semantic components chosen by the firm, is a second challenge that motivates our use of machine learning. Identifying the separate effects of each component requires synthesizing and decomposing the outcomes of several complex and compound treatments at once. Thus, the novelty of our second-stage projection down onto a lower dimensional object lies in allowing the identification of component-level effects yet controlling for partial correlations between their simultaneous inclusion in a given email treatment object. The scalability of machine learning techniques is well-suited to our data-intensive application; the orthogonalization of the signals is key to mitigating potential biases associated with either model selection or overfitting.
Turning to the benefits afforded by our setting, focusing on email marketing eliminates many of the key challenges specific to online display ads, which mainly stem from their complex delivery mechanism (Johnson 2020). In particular, there is no selection here on the part of the recipients (activity bias) because of having to “be online” to receive treatment and no role for a downstream intermediary (e.g., an ad auction platform optimizing performance or rivals bidding for the same ad slot) to further impact the assignment mechanism (delivery bias). Identity fragmentation is also minimized because emails are generally delivered to all devices. Finally, an embedded code within the email provides clean attribution of the individual’s actions across the conversion funnel. This allows us to consider not only the top-level engagement outcome of opening an email, but the lower level outcomes of purchase incidence and purchase amounts that ultimately drive profit.
The rest of the paper is organized as follows. Section 2 highlights the related literature, whereas Section 3 describes the institutional context and construction of the data set. Section 4 lays out the causal framework and estimation approach. Section 5 contains a preliminary empirical analysis geared toward assessing overlap and covariate balance. Section 6 contains our main empirical results as well as an illustrative comparative static exercise that showcases the strength of this unified framework. Section 7 concludes.
2. Related Literature
Our work contributes to a fast-growing literature that uses ML methods to estimate heterogeneous causal effects, mainly in the context of fully randomized control trials (RCTs). Wager and Athey (2018) propose the causal forest approach, an extension of the earlier causal tree method (Athey and Imbens 2016), to explore heterogeneous treatment effects in high-dimensional RCT settings, in which issues of statistical power and multiple testing are paramount. Athey and Wager (2019) develop further extensions to settings that feature observational data instead. Hitsch and Misra (2018) employ a K-nearest-neighbor approach combined with an additional treatment effect projection step onto pretreatment covariates to construct optimal targeting policies and compare how they perform in a randomized trial. Optimal policy choice is also the focus of Imai and Strauss (2011). Yoganarasimhan et al. (2020) consider the design and evaluation of personalized free trials in the context of software subscription services, evaluating different personalized trial-length policies based upon different estimators and comparing their effectiveness. Chernozhukov et al. (2017) propose and evaluate different strategies for estimating key features of heterogeneous effects as well as providing inference approaches that are valid in high-dimensional settings. Semenova and Chernozhukov (2021) focus more narrowly on recovering the best linear predictors/approximations of the underlying treatment effect functions. Imai and Ratkovic (2013) frame the heterogeneous treatment effect estimation problem as one of variable selection, specifying separate least absolute shrinkage and selection operator (LASSO )constraints for the parameters on the pretreatment and causal heterogeneity factors. The goal is to recover a sparse representation of the heterogeneous effects, using a subset of the covariates. Grimmer et al. (2017) estimate both heterogeneous treatment effects and the effects of heterogeneous treatments using the ensemble (super learner) methods developed by Van der Laan et al. (2007).
We also contribute to the voluminous literature on digital marketing promotions and ad effect, which is far too broad to adequately summarize here. However, we refer back to particular results and prior studies in the context of interpreting the results from our empirical application. Finally, we contribute more directly to a small literature on assessing the performance of targeted email campaigns per se. Ansari and Mela (2003) examine a firm’s ability to customize the design and content of email promotions to increase website traffic and find that content-targeting increases expected click-throughs by 62%. Bonfrer and Drèze (2009) examine a series of email marketing campaigns, using bivariate hazard models to predict when customers open or click an email. Kumar et al. (2014) study how the total number of emails opened impacts how long consumers subscribe to an email program. Sahni et al. (2017) use a propensity-score based approach to analyze 70 targeted email campaigns and find that email promotions not only increase customers’ average purchase spending during the promotion window, but the positive externality also carries over to the week after the promotion expires. Zhang et al. (2017) connect the open and purchase stages of the conversion funnel and derive an optimal frequency for sending email promotions. Sahni et al. (2018) use a series of randomized field experiments to determine whether including the recipient’s name in the subject line and body of the email increases their willingness to proceed down the conversion funnel. Substantively, our results on engagement are consistent with the findings reported by Ascarza (2018). In the context of churn prevention, Ascarza (2018) finds that the consumers most likely to churn are not the best targets for churn management programs (their incremental lift is lower or even negative compared with those who are ex ante less likely to churn). Similarly, we find that the least engaged consumers are also the least responsive to the particular email characteristics we identify as generally leading to increased conversion in all stages of the funnel.
3. Contextual Setting and Data Construction
The data for this study are drawn from an online apparel retailer that uses frequent email promotions to provide engagement and purchase incentives to its target customer base. We observe 34 unique email promotions that were sent over a two-month period in the spring of 2015 to more than 1.3 million customers. Each individual in the data set received one or more of these emails (referred to by the firm as “deals”) during the sample window, which is important for quantifying the effects of each promotion. They can then choose to engage or not engage with a given message, thus updating the vector of characteristics the firm uses to target them (i.e., RFM value measures and other engagement variables).
Each time an email is sent to a customer, we observe a vector of characteristics for that individual at that time.4 This allows us to condition on the exact information used by the firm in its targeting decisions. In addition, we observe time stamps indicating when an individual opened an email and if and when the individual made a purchase as well as the total spend of any purchase or purchases connected to that email (net of discounts). Each of these actions then also updates an individual’s related engagement variables for use in later targeting decisions.5 Finally, we see the full subject line of each of the 34 emails. This allows us to categorize the treatment components within each email and address our research objective of understanding how the choice of promotional incentives and semantic cues impacts customer actions down the conversion funnel upon receiving an email promotion.
We now describe in detail the included vector of email components (causal heterogeneity treatment components) and the observed customer-related variables (pretreatment covariates).
3.1. Email Characteristics (Causal Heterogeneity Factors)
As noted, each treatment that an individual receives is a specific email. Our focus is on estimating the effect of different treatment components present in the subject line of each email on the actions taken by the recipient along the conversion funnel. More specifically, we are interested in characterizing a recipient’s actions, upon receiving a promotion email, at three stages of the funnel: (1) whether the recipient opens the email, (2) whether the recipient makes a purchase, and (3) the recipient’s (unconditional) purchase amount. We focus on a variety of components present in the 34 emails we study. We separate these components into four groups: merchandise category, promotional factors, semantic choices, and footprint (character length). We now briefly summarize each of these groups. Table 1 presents the high-level details of our 34 emails under study, summarizing the category, promotional elements, and number of semantic elements present in the emails.6
|

Table 1. Frequency of Heterogeneous Treatment Components Broken Out by Merchandise Category
| Merchandise category | ||||
|---|---|---|---|---|
| Frequency of heterogeneous treatments | Product | Clearance | Miscellaneous | |
| Price | Discount | 16 | 4 | 14 |
| Dollar rebate | 0 | 0 | 2 | |
| Nonprice | Free gift | 8 | 0 | 0 |
| Free shipping | 4 | 0 | 3 | |
| 50% off shipping | 1 | 0 | 0 | |
| Free returns | 2 | 0 | 1 | |
| Noninformative semantic choices | Personalized | 0 | 0 | 2 |
| Mystery | 0 | 0 | 5 | |
| Extra | 3 | 4 | 5 | |
| Exclusive | 3 | 0 | 0 | |
| Exclaim | 11 | 4 | 10 | |
| Sale | 2 | 0 | 3 | |
| Code | 13 | 4 | 10 | |
Given that different product types may have varied conversion rates at different stages of the funnel (because, for example, of how attractive the particular category is to the consumer), we include a dummy variable indicating which merchandise category is present in the email subject line. There are three factors within this group: Product, Clearance, and Miscellaneous. The Product group refers to an email that mentions a specific product. The Clearance group refers to cases in which the items mentioned in the email are designated as being on clearance. The Miscellaneous category contains those subject lines that do not fall into either of the two previous groupings. For purposes of estimation, we designate the miscellaneous group as baseline.
Promotional factors are related to promoted offerings, both price and nonprice, that are present in the email subject line. We observe a total of seven different promotional elements in the 34 emails studied. The first is a Discount offering, in which the object, either a specific product or the whole order, is discounted by a fixed percentage. For example, an email with a discount offering states that a given product is now 20% off. Because of sufficient variation across emails, we include this variable as the true percentage and not a dummy variable, which is unique among our email characteristics. The observed discounts range from 20% to 75% off. Second, we see promotions for a Dollar Rebate. Because there is no variation in the dollar amount of the rebate, this is captured by a dummy variable indicating the presence of a dollar rebate in the subject line. We also observe the inclusion of a Free Gift, which could either be a free gift promotion or a buy-one-get-one (BOGO) offer. The actual “free gift” is specified in the subject line, whereas the BOGO deal refers to a specific product category, allowing the individual to procure further items of that product type at a discounted amount (or completely free). Finally, we observe three different forms of promotion tied to receiving or returning items. The three cases are Free Shipping, 50% Off Shipping, and Free Returns.
We turn now to a variety of semantic factors that do not feature a monetary incentive to induce engagement. Our choices for semantic cues are specifically restricted to what can be thought of as a form of “noninformative advertising” that may further enhance the salience or attractiveness of the subject line (Sahni et al. 2018). We choose two categories of such semantic cues within our treatments. The first, Personalization, pertains to the email containing personalized information regarding the particular recipient. For example, an email may be sent out on the “anniversary” of when the customer signed up with the firm, containing a notification of such, often coupled with another deal component. The second conceptual indicator is Mystery, which refers to cases in which the exact nature of the promotion is not provided directly in the email subject line and is only revealed when the individual actually opens the email and follows the subsequent links included therein (for example, some kind of contest or mystery sale).
For the other category of semantic cues, we include five different word choices present in the email subject lines that provide no additional information regarding the deal itself but may act as trigger points nonetheless. These five choices are Extra, Exclusive, Exclaim, Sale, and Code. The first semantic choice is the word Extra. Often, the firm attaches Extra to a particular discount percentage; for example, rather than seeing simply “20% off” in the subject line, the individual is presented with “an extra 20% off” instead (though the modifier is functionally meaningless here). Our second semantic keyword is Exclusive, which may signal that the deal is restricted to valued customers and the individual has been especially selected for this offer. Third, we observe that some emails have an exclamation point at the end, whereas the others do not. To investigate its role, we include a dummy for using an exclamation point, denoted as Exclaim. We identify Sale as our fourth semantic factor, for which the email subject line includes this word along with details about the sale. Finally, we observe a number of emails with a key code present in the subject line. These codes are used to “unlock” the promotional offering, perhaps inducing greater engagement. We include Code as a dummy variable that takes the value one if a promotional code is provided in the subject line. Finally, we include one additional email characteristic in our model: the number of characters present in the email subject line. This is to capture the overall “footprint” of the subject line in an individual’s email inbox on the individual’s device screen.
Table 2 highlights the average engagement levels of the customers at different stages of the funnel, conditional on having been exposed to each email characteristic we have included in our analysis. We observe wide variation in the open rate associated with the treatment components, with maximum 0.284 and minimum 0.114—a clear indication that some emails (or email components) are much more impactful than others. Focusing instead on the opening rates of the overall emails themselves, the largest open rate is 0.317 and the smallest is 0.017. Table A1 in the online appendix contains the full list of emails and the summary statistics of their performance at each stage of the funnel, giving an initial indication of the statistical power available here.7 As we continue to move further across the columns of Table 2, in which we observe the unconditional purchase incidences and dollar amounts of each email component, we see that some components perform differently based on the stage (though, at this point, these are merely associations). For example, the use of the semantic keyword “sale” has a moderate effect on the open rate but results in a higher purchase rate at the end of the conversion funnel. We also present the conditional purchase amount as the last column in the table. We see that emails that include “free shipping” in the subject line produce relatively middling open rates; however, their conditional purchase amount is the highest among all the components. Whereas there is ample variation among the email characteristics, two notable constructs are missing from this purely descriptive analysis: which customers are actually exposed to each email characteristic and what other email characteristics are contained within the subject line. This selective targeting likely confounds the descriptive patterns shown in this table, providing a key motivation for taking a doubly robust approach to causal inference.
|
Table 2. Performance of Heterogeneous Treatment Components
| Type | Treatment components | Number of customers | Marginal response | Cond. on Pur. | ||
|---|---|---|---|---|---|---|
| Open rate | Pur. rate | Pur amt, $ | Ave. Pur Amt, $ | |||
| Merchandise category | Product | 11,428,186 | 0.129 | 0.001 | 0.09 | 75.84 |
| Clearance | 1,833,869 | 0.114 | 0.001 | 0.09 | 60.75 | |
| Price | Discount | 14,580,019 | 0.127 | 0.001 | 0.10 | 74.18 |
| Dollar rebate | 2,237,609 | 0.182 | 0.002 | 0.13 | 58.55 | |
| Nonprice | Free gift | 6,258,194 | 0.132 | 0.001 | 0.08 | 70.53 |
| Free shipping | 6,777,169 | 0.126 | 0.001 | 0.11 | 85.79 | |
| 50% off shipping | 328,582 | 0.141 | 0.001 | 0.11 | 74.46 | |
| Free returns | 2,940,106 | 0.119 | 0.001 | 0.10 | 72.77 | |
| Noninformative semantic choices | Personalized | 137,555 | 0.284 | 0.007 | 0.42 | 61.73 |
| Mystery | 4,649,422 | 0.139 | 0.002 | 0.14 | 65.48 | |
| Extra | 8,090,759 | 0.130 | 0.001 | 0.10 | 64.79 | |
| Exclusive | 2,593,001 | 0.141 | 0.001 | 0.08 | 70.87 | |
| Exclaim | 19,187,060 | 0.135 | 0.002 | 0.12 | 68.67 | |
| Sale | 4,636,212 | 0.130 | 0.002 | 0.16 | 69.87 | |
| Code | 20,856,903 | 0.136 | 0.002 | 0.11 | 69.22 | |
3.2. Consumer Characteristics (Pretreatment Targeting Variables)
As noted, we observe the full list of variables that the firm uses when sending emails out to their master list. In total, we observe 15 distinct pretreatment variables that are used for both targeting by the firm and in our subsequent analysis to characterize the heterogeneous response of individuals to the various subject line treatment components. These pretreatment covariates fall into three categories: customer demographics, RFM variables, and engagement variables. Note that these aggregates are the exact constructs that the firm has chosen to collect and condition upon for targeting.
For demographics, there are three self-reported variables collected at sign-up for each individual: their age (Age), income level (Income), and month of birth (BDay). Stated age and income variables are categorical; individuals categorize their responses into different groups when they initially sign up for the firm’s mailing list. Their birthday month is naturally an integer.
For the RFM and engagement variables, the information is much more granular. When an email is sent to an individual, a snapshot is taken of the individual’s profile, which is then stored in the database. Related to purchasing, we observe the average spend (dollar value) by an individual each time the individual made a retail-channel purchase (Ave_Ret_Spend), the average spend by an individual each time the individual made a purchase in the web channel (Ave_Web_Spend), and the total number of purchases the individual made in the last two years (Order_Count). We also observe how the individual has engaged with the firm on a variety of dimensions. First, Catl_Book is a dummy variable if the individual has signed up to receive a catalog. Custom_Choice refers to individual browser settings consumers may choose to expedite the purchasing process. We also observe whether the individual has ever purchased in the online or off-line channels, captured by the dummy variables Pur_On and Pur_Off, respectively. Finally, Tot_Dept records the total number of departments within the firm from which the individual has ever purchased.
To further measure the recency of engagement with the firm, the firm collects four additional variables. We observe time stamps of when the individual first registered with the firm to receive emails, last opened an email, last clicked on the contents of an email, and last purchased from the firm. Using these measures, we use the number of days between the time a new email was sent to an individual and these earlier dates to construct the number of days since the individual registered (Days_Reg), last opened an email (Days_Open), last clicked through to the website (Days_Click), and last purchased from the firm (Days_Pur).
Table 3 summarizes the average customer characteristics for each email sent during our two-month window. There is obvious and meaningful variation in the individual-level characteristics associated with each email promotion. The large variance of the RFM variables is indicative of clear segmentation and active targeting on the part of the firm. Interestingly, we see very little variation in the average Age and Income variables, which suggests that these variables do not play a strong role in the firm’s targeting strategy. As explained, our doubly robust estimation strategy is designed to ensure that we guard against selection biases arising from their targeting policy.
|
Table 3. Description of Pretreatment Covariates and Their Summary Statistics with Respect to an Email Recipient Summarized Across the 34 Emails
| Recipient characteristics | Pretreatment covariates | Summary statistics | ||
|---|---|---|---|---|
| Variable | Description | Mean | Standard deviation | |
| Recency | Days_Reg | Days since the recipient registered with the firm to receive emails | 1,595.08 | 1,288.81 |
| Days_Open | Days since the recipient opened the recipient’s last email | 67.33 | 126.29 | |
| Days_Click | Days since the recipient clicked on the recipient’s last email | 284.97 | 558.00 | |
| Days_Pur | Days since the recipient made a purchase from the recipient’s last email | 475.63 | 700.19 | |
| Frequency | Order_Count | Number of purchases made by the recipient in the past two years. | 3.36 | 5.05 |
| Tot_Dept | Total number of departments from which the recipient has shopped from | 4.25 | 4.19 | |
| Monetary | Ave_Ret_Spend | Average $ amount spent each time the recipient makes a retail purchase | 10.81 | 30.21 |
| Ave_Web_Spend | Average $ amount spent each time the recipient places an order online | 42.91 | 45.14 | |
| Habitual | Catl_Book | True (1) if the recipient received catalog book | 0.11 | 0.32 |
| Custom_Choice | True (1) if the recipient customized buying preferences | 0.23 | 0.36 | |
| Pur_Off | True (1) if the recipient makes retail purchase | 0.43 | 0.46 | |
| Pur_On | True (1) if the recipient makes online purchase | 0.89 | 0.78 | |
| Demographic | Bday | Bithday month of the recipient | 6.26 | 3.84 |
| Age | Age bracket of the recipient | 3.57 | 1.51 | |
| Income | Income bracket of the recipient | 4.74 | 2.17 | |
4. Causal Framework and Estimation Approach
In this section, we describe our estimation approach and place it within the canonical Neyman–Rubin potential outcome framework (Neyman 1923, Rubin 1978, Holland 1986). We follow closely the notation developed in Heckman and Vytlacil (2007) (HV) for the more general multiple treatments with treatment components setting. Following the HV setup, we define the outcome corresponding to treatment state s for individual ω as . The set of possible treatments is denoted with elements s. In our application, treatments are emails, and outcomes are separate binary indicators for whether the email was opened during the observation period and whether a purchase was made and the dollar value (very frequently zero) subsequently spent on purchased products. For each individual type ω, the collection of possible outcomes is given by . Note that there are, thus, many possible treatment states (e.g., different possible email offers) and, as is the case in our setting, no requirement of a “nontreated” or traditional control state.
As noted, emails consist of a vector of design elements, representing the particular offers and other semantic choices included in the subject line. In the HV notation, each treatment condition s may itself be a compound of component states, denoted here as for C components.8 HV further note that “unbundling the components of complex treatments is rarely done” (Heckman and Vytlacil 2007, p. 4788) although it is certainly feasible in low-dimensional settings.9 One possible goal is to then unbundle the overall effect into the separate contributions of each component. Another is to explore the heterogeneous response to either the overall treatment or its included components.
The individual treatment effect (ITE) for agent ω that compares the outcome of treatment with treatment s is then given by
Treatments are assigned to individuals by an assignment mechanism: a rule that assigns treatment to each ω. As noted, in our context, this rule is determined by the retailer’s targeting policy. Whereas we do not observe the policy itself, we do have the full set of factors (components of ω) upon which the assignment is based.
Note that, at any given point in time, we can only observe the outcome for the email that was sent (i.e., the treatment that was assigned). Once again following the HV setup, let if we observe agent ω in state s given (implicit) targeting policy regime p. The observed outcome can then be defined as
Which has the structure of a classic “switching regressions” problem (Cox 1958, Quandt 1958). The fact that we observe if but we generally cannot observe for is referred to by Holland (1986) as the “fundamental problem of causal inference.” Note that, in our setting, the actual assignment process we observe is more precisely a partial “crossover experiment” in which different treatments may be given to the same individuals at different points in time (see, e.g., Hernán and Robins 2020, chapter 2), in which case the individual treatment effects themselves can be identified under certain conditions.10 We return to this discussion subsequently.
The well-known Neyman–Rubin “statistical solution” to the general nonidentifiability of the ITEs is to combine restrictions over (or knowledge of) the assignment mechanism with a shift in focus to more aggregate (population level) estimands (e.g., average treatment effects (ATEs) and conditional average treatment effects (CATEs)). For example, the (pairwise) ATE that compares treatment j to treatment k is given by
Here, the expectation is over ω. If one instead conditions on pretreatment covariates X associated with the observed components of ω, the CATE can then be defined as
We make use of both in what follows.11
Switching focus to the causal effect of the underlying treatment components , the natural contrast is now between treatments (or sets of treatments) that instead differ in their inclusion or exclusion of a given component (e.g. a free gift or personalized semantic cue). Following Grimmer et al. (2017), the marginal average treatment effect (MATE) can then be defined as the pairwise contrast between the inclusion and exclusion of this factor, integrating out over the remaining treatment components, as well as the full set of pretreatment covariates (demographic factors). Note that a similar integration-based strategy can be used to characterize the marginal impact of particular demographic factors (e.g., the marginal effect, or MCATE, of a subset of the full covariate set X). See Grimmer et al. (2017) for a full set of such definitions and a broader discussion of their roles.
It is now well-known that the ATE and CATE are econometrically identified under various restrictions on the structure of the assignment mechanism . The simplest example is random assignment, which here is a series of RCTs typically carried out as A/B tests. In our setting, the assignment is clearly nonrandom as it was determined by the firm’s marketing team to drive engagement, so treating the assignments as fully randomized is inappropriate. Closely related is the slightly weaker notion of unconfounded assignment,12 which is simply a conditionally randomized assignment mechanism but for which we may or may not know the actual assignment rule (also referred to as the propensity score). The key requirement is that assignment to treatment not depend on the true (potential) outcomes though it may depend on ω through the observed covariates x.
Note that, in many targeted marketing settings, unconfounded assignment is a natural assumption that is likely to be satisfied automatically (and directly verifiable) as most targeting is done algorithmically, conditional on an observed set of demographic and behavioral outcome variables (e.g., RFM measures summarizing past actions). Moreover, with targeted marketing, the natural estimands are the CATE or MCATE parameters, which capture the response heterogeneity among the key consumer segments being targeted.
We return to the identification problem, given unconfoundedness, which can now be formally stated.
(Unconfounded Assignment or Exchangeability).
Both the ATE and CATE type estimands are identified given an additional overlap or positivity condition as well as the requirement that there be no interference across units (Cox 1958, Rubin 1980).13 The sufficient overlap condition can be expressed as follows.
(Sufficient Overlap or Positivity)
Sufficient overlap, which is also referred to as common support or positivity across different literature, requires that, for all individuals in the target population, the probability of being assigned to each treatment condition be strictly greater than zero. Insufficient overlap of the demographic variables between groups that are assigned different treatments suggests a failure of overlap or positivity.14 Unlike unconfoundedness, overlap can easily fail in targeted marketing settings if the targeting rules employed by the firm are in fact deterministic. Indeed, firms should be encouraged to include a degree of residual randomization in all campaigns for just this reason.
Note that, in contrast to the canonical case-control setting, individuals here can and did receive more than one email treatment over the sample window. This crossover structure can aid in identification provided that there is no carryover effect of each treatment. In particular, the impact of a given email must not depend on whether the individual was exposed to one or more earlier ones (or the sequence in which they were shown). It also requires that outcomes not depend on calendar time (i.e., when they were sent out). Whereas this can be a strong assumption in some circumstances (e.g., irreversible treatments such as a heart transplant), we believe it to be relatively innocuous here given (1) the high volume of emails sent over the period, (2) the fact that they generally target different products, and (3) the fact that the RFM variables used by the firm (that capture outcomes) are controlled for in both the outcome and assignment models. We discuss the empirical support for these assumptions, including overlap and balance, in Section 5.
Given these two assumptions (referred to jointly as strong ignorability), there are then many candidate methods for estimating the treatment effect parameters, including subclassification, matching, propensity-score weighting, and regression adjustment (and various combinations thereof). The approach we employ here, doubly robust machine learning, is designed to provide robustness to misspecification of either the outcome or propensity model, whereas also controlling for biases associated with overfitting and/or regularization.
4.1. First Stage Analysis: Doubly Robust ML Estimation of the Pairwise ATEs
Our ultimate goal is to recover estimates of the email component effects, ideally indexed by consumer type. Before doing so, we first recover the pairwise treatment effects (ATEs and CATEs) for the overall emails themselves. These pairwise estimands are interesting in themselves, and we leverage them in our counterfactual off-policy evaluation exercise that focuses on improved targeting. Moreover, this initial estimation procedure involves recovering estimates of the “orthogonalized scores,” which correspond to the fitted values (“ITE signals”) of the (partially unobserved) individual-level outcomes. These are also key inputs to our second exercise, which involves projecting these scores down onto the components of their corresponding treatments. Throughout, we employ the doubly robust machine learning (DML) approach of Chernozhukov et al. (2018), which builds upon and extends methods originally proposed by Robins and Rotnitzky (1995).
In describing the DML procedure, we closely follow the language and notation of Athey and Imbens (2019). Consider, for simplicity, a binary comparison of two emails: treatments 1 and 0. Again, for simplicity, let’s call treatment 1 the “treatment” and treatment 0 the “control” even though we have no (nontreatment) control condition here. In practice, we choose one email as the baseline comparison and contrast the remaining emails with this reference treatment. Let W be an indicator function that flags whether each observation was assigned to the treatment (1) or control (0) condition. The propensity score is then given by
It is now well-known that the ATE parameter τ can be written as a functional of the joint distribution of in a variety of ways. Three particularly notable options are as follows:
The first representation corresponds to a classic regression adjustment strategy in which the conditional outcome expectations under the treatment and control conditions are estimated first, and then, a direct comparison is constructed using the sample analog of the population expectation, namely, averaging the fitted values (’s) from the outcome models. The second representation corresponds to a propensity-weighting approach, whereby the sample analog is computed using the observed outcomes, weighted by the fitted values (’s) from the propensity score model. The final representation corresponds to a doubly robust approach that blends the elements of the first two using the structure of the influence or efficient score function.
Note that, in contrast to the doubly robust approach, a “single” ML strategy involves the flexible estimation of either outcome or propensity models (i.e., representation 1 or 2) via some particular ML approach (or an ensemble of several) rather than a more traditional parametric, semiparametric, or nonparametric technique. Unfortunately, the single ML strategy is vulnerable to biases arising from both regularization (e.g., model selection) and overfitting. More recent causally motivated “double” ML approaches use orthogonalization and cross-fitting to address these biases, thereby making the estimator “doubly robust” to misspecification of either the outcome or propensity score equation as well as biases resulting from overfitting and regularization (Robins and Rotnitzky 1995, Van der Laan and Rose 2011, Chernozhukov et al. 2018, Wager and Athey 2018). Note that the use of orthogonalization is the key distinction of representation three.
In particular, using this representation, the influence function (IF) or orthogonalized score is given by
In our implementation of the DML approach, we use random forests to estimate both the propensity and outcome models.15 This choice is motivated by three factors. First, whereas we observe the full set of targeting variables the firm uses when sending emails (assigning treatment), we do not know its actual targeting rule (i.e., the exact function/procedure it employs). Thus, it is important to be sufficiently flexible in estimating and constructing the propensity weights. Because the set of conditioning variables is low dimensional but the mapping is unknown, an adaptive nearest neighbor structure, such as that of the random forest, is particularly attractive in this context. Second, because the most important features for predicting heterogeneous responses in the outcome equation are ex ante unknown, a method that includes automatic variable selection (with complexity penalization and a guard against overfitting) is desired as well. Third, random forests employ cross-fitting and out-of-sample prediction automatically, thereby mitigating overfitting bias internally.
Finally, given that we have many treatment conditions, we follow the approach of McCaffrey et al. (2013) for estimating propensity scores in a multiple treatment regime. In particular, we take the focal population to be the full (pooled) set of consumer profiles and estimate the exhaustive collection of binary propensity scores, one for each email. Because the estimated propensities across any two pairs need not sum to one (and can be quite small on average), we further follow the guidance of Hernán and Robins (2020) in using the unconditional frequencies to construct stabilized propensity weights, which are found to provide better computational properties (Hernán and Robins 2006).
4.2. Second Stage Analysis: Projecting the Scores onto Treatment Components
The preceding procedure allows us to recover unbiased estimates of the outcome from an individual being assigned a particular compound treatment (email). However, understanding why one email outperforms another, which is critical for improving future performance, requires decomposing these composite effects. To understand how the included components contribute to the overall lift in outcomes, we adapt Semenova and Chernozhukov (2021) to our setting by projecting the orthogonalized scores obtained in the earlier analysis down onto the components of treatment and (in some cases) a subset (or aggregation) of the pretreatment covariates. Let V represent the full set of treatment components and pretreatment covariates and Z represent a low-dimensional subset (or covariate dictionary) that is specified in advance. We seek to estimate and conduct inference upon a function g(z) that summarizes the causal/heterogeneous effects conditional on this reduced set of factors. Note that the function g(z) is essentially the response surface of a given treatment, which has a long history in the optimal experimental design literature starting with Box and Wilson (1951), but one in which the true target surface is a function of both the treatment components (causal heterogeneity factors) and demographic variables. As noted by Grimmer et al. (2017), the main causal quantities of interest (i.e., MATE and MCATE estimands) are given by various differences across this surface.
Using the notation of Semenova and Chernozhukov (2021), we assume that we can represent g(z) as the conditional expectation function
Here, p(Z) is a set of prespecified basis functions, which, given that these are no longer structural objects, but rather an approximation to such, can be tailored to ease interpretability. We consider two such classes of projections. In the first, we project the score for a given pairwise comparison onto demographic covariates, creating a traditional CATE or group average treatment effect (GATE) object corresponding to a given treatment pair contrast. Note that the object of interest here is, therefore, an approximation of the parameter defined earlier as it involves comparisons between particular pairs of treatments, conditional on a set of pretreatment covariates (or covariate groupings). In the second, we project the full set of scores (across all comparisons) down onto the full vector of treatment components to target estimands analogous to the MATE constructs described earlier (a more complex set of basis functions could allow for additional nonlinearities and interactions in their effects). This procedure is similar in spirit to the projection and marginalization used in Grimmer et al. (2017) but following instead the linear projection suggested in Semenova and Chernozhukov (2021).16
5. Preliminary Analysis: Assessment of Balance and Positivity
As noted in Section 4, identification of the pairwise ATEs and other causal estimands holds under the two key assumptions comprising strong ignorability: unconfounded assignment (A1) and sufficient overlap (A2). The unconfounded assignment condition is satisfied definitionally here by the firm’s targeted (algorithmic) marketing policy. Unlike the case of online display ads, for example, there is no selection here on the part of the recipients (activity bias) or role for a downstream intermediary (e.g., an ad auction platform optimizing performance) to further impact the assignment mechanism (delivery bias). However, the overlap condition is likely to be more contentious as a sufficiently sharp targeting criteria (e.g., one with no plausible source of residual randomization) could lead to some consumer types never meeting the conditions to be served certain emails.
To assess whether such deterministic assignment (or an otherwise degenerate statistical process) is in play here, we recovered separate binary assignment rules (propensity scores) for each of the 34 emails over the full (pooled) population of email list members (i.e., whether each consumer was or was not sent a particular email). To avoid being misled by excess smoothing, we employed several estimation techniques, including trees and boosted trees, that involve relatively little smoothing and should thereby be well-suited to detect any bright-line rules. Even the most narrowly targeted email (one that mentions the recipient’s birthday) exhibited clear evidence of randomization: only about 80% of the “qualified recipients” (i.e. those whose birthdays fell in that month) were actually sent it. Whereas, in a few other cases, trimming the raw propensities at 0.02 and 0.98 did eliminate a substantial number of observations, sufficiently large sample sizes (>20,000) were retained throughout, indicating that the true assignment mechanism was nondeterministic.17
However, even evidence of residual randomization does not guarantee sufficient covariate balance in the estimation samples to precisely identify all effects. Therefore, to assess the degree of covariate balance, we follow the procedure suggested in McCaffrey et al. (2013) for settings with multiple treatment conditions. In particular, McCaffrey et al. (2013) suggest testing for balance by computing and reporting each covariate’s “population” standardized bias (PSB). For each pretreatment covariate k and treatment condition t , a PSB is given by
|
Table 4. Weighted Means of Pretreatment Covariates for Compound Email Treatments and Unweighted Mean and Standard Deviation of Pooled Population
| Pretreatment covariates | |||||||||||||||
|---|---|---|---|---|---|---|---|---|---|---|---|---|---|---|---|
| Email ID | AR | AW | BD | Age | Inc | OC | CB | CC | POFF | PON | TD | DR | DO | DC | DP |
| 1 | 11.19 | 43.08 | 6.26 | 3.58 | 4.75 | 3.32 | 0.12 | 0.22 | 0.43 | 0.89 | 4.24 | 1,591.21 | 73.74 | 291.71 | 472.49 |
| 2 | 10.86 | 43.54 | 6.26 | 3.58 | 4.75 | 3.52 | 0.11 | 0.23 | 0.42 | 0.89 | 4.34 | 1,611.58 | 61.61 | 281.33 | 489.86 |
| 3 | 12.68 | 42.62 | 6.31 | 3.68 | 4.83 | 4.23 | 0.13 | 0.26 | 0.47 | 0.96 | 4.96 | 1,596.19 | 85.73 | 289.25 | 375.43 |
| 4 | 10.83 | 43.08 | 6.26 | 3.57 | 4.74 | 3.38 | 0.11 | 0.23 | 0.42 | 0.89 | 4.27 | 1,592.35 | 60.64 | 278.04 | 473.79 |
| 5 | 10.27 | 42.49 | 4.00b | 3.28 | 4.57 | 3.20 | 0.11 | 0.21 | 0.40 | 0.87 | 4.09 | 1,506.36 | 61.00 | 271.01 | 472.12 |
| 6 | 10.83 | 43.07 | 6.25 | 3.57 | 4.74 | 3.38 | 0.11 | 0.23 | 0.42 | 0.89 | 4.27 | 1,593.28 | 61.71 | 279.05 | 473.92 |
| 7 | 10.83 | 43.09 | 6.26 | 3.57 | 4.74 | 3.38 | 0.11 | 0.23 | 0.42 | 0.89 | 4.27 | 1,591.66 | 60.83 | 277.90 | 472.84 |
| 8 | 10.80 | 42.96 | 6.26 | 3.57 | 4.74 | 3.36 | 0.11 | 0.23 | 0.42 | 0.89 | 4.26 | 1,593.58 | 63.42 | 281.40 | 476.13 |
| 9 | 13.00 | 50.23 | 6.11 | 3.53 | 4.64 | 4.14 | 0.14 | 0.26 | 0.45 | 0.95 | 5.04 | 1,425.26 | 50.50 | 195.63 | 308.42b |
| 10 | 10.83 | 43.07 | 6.25 | 3.57 | 4.74 | 3.38 | 0.11 | 0.23 | 0.42 | 0.89 | 4.27 | 1,593.30 | 61.68 | 279.04 | 473.98 |
| 11 | 10.78 | 42.71 | 6.26 | 3.58 | 4.74 | 3.46 | 0.11 | 0.23 | 0.43 | 0.89 | 4.26 | 1,607.77 | 76.79 | 303.98 | 486.68 |
| 12 | 13.33 | 57.08a | 6.32 | 3.70 | 4.83 | 4.75a | 0.14 | 0.28 | 0.48 | 1.00 | 5.53a | 1,520.86 | 49.68 | 198.31 | 252.55 |
| 13 | 9.91 | 40.89 | 6.27 | 3.59 | 4.74 | 4.58 | 0.08 | 0.27 | 0.43 | 0.87 | 4.94 | 1,703.59 | 95.65a | 362.85 | 602.36 |
| 14 | 10.83 | 43.08 | 6.26 | 3.57 | 4.74 | 3.38 | 0.11 | 0.23 | 0.42 | 0.89 | 4.27 | 1,593.53 | 61.74 | 279.15 | 474.20 |
| 15 | 10.85 | 43.00 | 6.26 | 3.57 | 4.74 | 3.37 | 0.11 | 0.23 | 0.43 | 0.89 | 4.27 | 1,596.68 | 64.18 | 283.04 | 476.31 |
| 16 | 10.83 | 43.07 | 6.26 | 3.57 | 4.74 | 3.38 | 0.11 | 0.23 | 0.42 | 0.89 | 4.27 | 1,593.60 | 61.58 | 279.01 | 474.42 |
| 17 | 13.37 | 52.64a | 6.32 | 3.70 | 4.84 | 4.57a | 0.14 | 0.28 | 0.48 | 1.00 | 5.43a | 1,516.06 | 50.49 | 199.13 | 260.38a |
| 18 | 11.18 | 47.16 | 6.28 | 3.65 | 4.76 | 4.55a | 0.09 | 0.31a | 0.46 | 0.89 | 5.22a | 1,724.77 | 68.21 | 278.20 | 510.54 |
| 19 | 11.69 | 50.67 | 6.15 | 3.57 | 4.71 | 4.02 | 0.13 | 0.25 | 0.44 | 0.96 | 5.02 | 1,479.97 | 53.73 | 219.62 | 326.20a |
| 20 | 10.84 | 43.10 | 6.26 | 3.57 | 4.74 | 3.38 | 0.11 | 0.23 | 0.42 | 0.89 | 4.27 | 1,593.10 | 61.13 | 278.83 | 474.36 |
| 21 | 10.83 | 43.09 | 6.26 | 3.57 | 4.74 | 3.38 | 0.11 | 0.23 | 0.42 | 0.89 | 4.27 | 1,593.25 | 61.26 | 278.85 | 474.32 |
| 22 | 10.83 | 43.08 | 6.26 | 3.57 | 4.74 | 3.38 | 0.11 | 0.23 | 0.42 | 0.89 | 4.27 | 1,592.92 | 61.12 | 278.54 | 474.44 |
| 23 | 10.83 | 43.08 | 6.25 | 3.57 | 4.74 | 3.38 | 0.11 | 0.23 | 0.42 | 0.89 | 4.27 | 1,593.36 | 61.48 | 278.99 | 474.18 |
| 24 | 10.84 | 43.08 | 6.26 | 3.57 | 4.74 | 3.38 | 0.11 | 0.23 | 0.42 | 0.89 | 4.27 | 1,592.48 | 60.95 | 278.36 | 473.84 |
| 25 | 12.96 | 45.18 | 6.17 | 3.59 | 4.70 | 4.28 | 0.14 | 0.27 | 0.46 | 0.96 | 5.11a | 1,457.15 | 47.87 | 192.80 | 331.25 |
| 26 | 13.50 | 53.63a | 6.33 | 3.71 | 4.85 | 4.59a | 0.13 | 0.28 | 0.48 | 1.00 | 5.56a | 1,514.84 | 49.93 | 198.63 | 348.30 |
| 27 | 9.98 | 42.22 | 6.29 | 3.56 | 4.71 | 3.00 | 0.07 | 0.23 | 0.40 | 0.87 | 4.16 | 1,622.52 | 80.84 | 331.52 | 588.84 |
| 28 | 9.92 | 42.39 | 6.29 | 3.56 | 4.71 | 2.97 | 0.08 | 0.23 | 0.40 | 0.87 | 4.12 | 1,613.87 | 78.46 | 326.96 | 574.49 |
| 29 | 10.84 | 43.09 | 6.26 | 3.57 | 4.74 | 3.38 | 0.11 | 0.23 | 0.42 | 0.89 | 4.27 | 1,592.21 | 60.75 | 278.11 | 473.49 |
| 30 | 10.84 | 43.10 | 6.26 | 3.57 | 4.74 | 3.38 | 0.11 | 0.23 | 0.42 | 0.89 | 4.27 | 1,591.67 | 60.67 | 277.93 | 473.01 |
| 31 | 10.84 | 43.11 | 6.26 | 3.57 | 4.74 | 3.38 | 0.11 | 0.23 | 0.42 | 0.89 | 4.27 | 1,591.49 | 60.64 | 277.90 | 472.89 |
| 32 | 13.49 | 52.78a | 6.30 | 3.67 | 4.80 | 4.46a | 0.16 | 0.28 | 0.47 | 1.00 | 5.60a | 1,480.41 | 47.76 | 193.34 | 235.92a |
| 33 | 10.84 | 43.10 | 6.26 | 3.57 | 4.74 | 3.38 | 0.11 | 0.23 | 0.42 | 0.89 | 4.27 | 1,591.46 | 60.59 | 277.92 | 473.12 |
| 34 | 10.80 | 42.97 | 6.25 | 3.57 | 4.74 | 3.36 | 0.11 | 0.23 | 0.42 | 0.89 | 4.25 | 1,593.29 | 63.53 | 281.60 | 476.17 |
| Pop. Mean | 10.81 | 42.91 | 6.26 | 3.57 | 4.74 | 3.36 | 0.11 | 0.23 | 0.43 | 0.89 | 4.25 | 1,595.08 | 67.33 | 284.97 | 475.63 |
| Pop. standard deviation | 30.21 | 45.14 | 3.84 | 1.51 | 2.17 | 5.05 | 0.32 | 0.36 | 0.46 | 0.78 | 4.19 | 1,288.81 | 126.29 | 558 | 700.19 |
Note. Pretreatment covariates: AR, ($); AW, ($); BD, Bday; Age, Age; Inc, Income; OC, ; CB, ; CC, Custom_Choice; POFF, ; PON, ; TD, ; DR, ; DO, ; DC, ; DP, .
aPretreatment customer feature variables for which SBtk is greater than 0.20 within a given program.
bSBtk is greater than 0.40.
|
Table 5. Maximum PSB Scores of Pretreatment Covariates for Each Email
| Email number | Maximum PSB scores |
|---|---|
| 1 | 0.05 |
| 2 | 0.05 |
| 3 | 0.17 |
| 4 | 0.05 |
| 5 | 0.59 |
| 6 | 0.04 |
| 7 | 0.05 |
| 8 | 0.03 |
| 9 | 0.24 |
| 10 | 0.04 |
| 11 | 0.07 |
| 12 | 0.32 |
| 13 | 0.24 |
| 14 | 0.04 |
| 15 | 0.02 |
| 16 | 0.05 |
| 17 | 0.31 |
| 18 | 0.24 |
| 19 | 0.21 |
| 20 | 0.05 |
| 21 | 0.05 |
| 22 | 0.05 |
| 23 | 0.05 |
| 24 | 0.05 |
| 25 | 0.21 |
| 26 | 0.31 |
| 27 | 0.16 |
| 28 | 0.14 |
| 29 | 0.05 |
| 30 | 0.05 |
| 31 | 0.05 |
| 32 | 0.34 |
| 33 | 0.05 |
| 34 | 0.03 |
|
Table 6. Maximum PSB Scores of Emails for Each Pretreatment Covariate
| Recipient characteristics | Pretreatment covariates | Maximum PSB scores |
|---|---|---|
| Recency | Days_Reg | 0.13 |
| Days_Open | 0.22 | |
| Days_Click | 0.17 | |
| Days_Pur | 0.34 | |
| Frequency | Order_Count | 0.27 |
| Tot_Dept | 0.32 | |
| Monetary | Ave_Retail_Spend | 0.09 |
| Ave_Web_Spend | 0.31 | |
| Habitual | Catl_Book | 0.15 |
| Custom_Choice | 0.23 | |
| Pur_Off | 0.12 | |
| Pur_On | 0.14 | |
| Demographic | BDay | 0.59 |
| Age | 0.20 | |
| Income | 0.08 |
The one email that exhibited large imbalance is actually quite instructive to consider further. This email was personalized to include a happy birthday message based on the consumer’s self-reported birth month, a sharp targeting criteria that is quite easy to detect empirically. However, even this extreme example does not actually threaten inference. First, as noted, the assignment of this email was revealed to be nondeterministic: only about 80% of individuals whose birth month matched the timing of the email were actually sent it, providing direct evidence of clear residual variation. No consumers whose birth month did not match the timing were sent the email (as one should expect). Thus, we conclude that the “imbalance” here is actually innocuous because (1) there is clear evidence of residual randomization, (2) the nonexclusive nature of the assignment ensures that many of these consumers received other emails either before or after their birthday, and (3) the baseline impact of having a birth month occur in the sample window is controlled for in all treatment outcomes. In other words, exchangability of consumer types is preserved under this assignment for the outcome-relevant variables.
Because we also target component-level effects, it may be instructive to assess the empirical extent of component-level overlap as well. To do so, we examine the degree of balance in the targeting variables (pretreatment covariates) of the consumers who are exposed to each email component (causal heterogeneity factor) relative to the population as a whole. To do so, we repeat the same PSB computation as in Equation (1), only this time, the score is calculated for each covariate k and treatment component t (instead of treatment email). In particular, is now the propensity score weighted mean of the covariate k for treatment component t (recipients for treatment component t in our application), is the estimated propensity score, is an indicator for assignment to treatment t, and and are the unweighted mean and standard deviation of covariate k for the pooled sample. Table 7 contains the weighted means of each pretreatment factor broken out by treatment component along with asterisk(s) indicating the degree to which the balance is affected. The degree of balance is striking. Of the 225 total comparisons, only two (less than 1%) exhibit a standardized mean difference above 0.20, neither of which is above 0.40. Based on the results of these three exercises, we conclude that balance and overlap appear quite strong in our context.
|
Table 7. Weighted Means of Pretreatment Covariates for Heterogeneous Treatment Components and Unweighted Mean and Standard Deviation of Pooled Population
| Treatment components | Pretreatment covariates | |||||||||||||||
|---|---|---|---|---|---|---|---|---|---|---|---|---|---|---|---|---|
| Type | AR | AW | BD | Age | Inc | OC | CB | CC | POFF | PON | TD | DR | DO | DC | DP | |
| Merchandise category | Product | 10.81 | 42.91 | 6.26 | 3.57 | 4.74 | 3.36 | 0.11 | 0.23 | 0.43 | 0.89 | 4.25 | 1,595.66 | 67.36 | 285.13 | 476.38 |
| Clearance | 10.78 | 42.96 | 6.26 | 3.58 | 4.74 | 3.40 | 0.11 | 0.23 | 0.42 | 0.89 | 4.26 | 1,605.01 | 67.12 | 287.51 | 489.53 | |
| Price | Discount | 10.81 | 42.90 | 6.26 | 3.57 | 4.74 | 3.36 | 0.11 | 0.23 | 0.43 | 0.89 | 4.25 | 1,595.11 | 67.31 | 284.96 | 475.7 |
| Dollar rebate | 10.84 | 43.11 | 6.26 | 3.57 | 4.74 | 3.38 | 0.11 | 0.23 | 0.42 | 0.89 | 4.27 | 1,591.55 | 60.61 | 277.86 | 472.9 | |
| Nonprice | Free gift | 10.81 | 42.90 | 6.26 | 3.57 | 4.74 | 3.37 | 0.11 | 0.23 | 0.43 | 0.89 | 4.26 | 1,596.73 | 67.31 | 285.37 | 477.63 |
| Free shipping | 10.82 | 43.07 | 6.26 | 3.57 | 4.74 | 3.38 | 0.11 | 0.23 | 0.42 | 0.89 | 4.27 | 1,591.67 | 60.66 | 278.03 | 474.11 | |
| 50% off shipping | 11.63 | 49.81 | 6.09 | 3.46 | 5.06 | 4.19 | 0.14 | 0.28 | 0.43 | 0.95 | 5.50* | 1,561.49 | 41.96a | 301.16 | 408.38 | |
| Free returns | 10.81 | 42.91 | 6.26 | 3.57 | 4.74 | 3.36 | 0.11 | 0.23 | 0.43 | 0.89 | 4.25 | 1,594.72 | 66.74 | 284.45 | 475.72 | |
| Noninformative semantic choices | Personalized | 10.90 | 44.53 | 5.66 | 3.51 | 4.71 | 3.59 | 0.12 | 0.23 | 0.42 | 0.89 | 4.45 | 1,596.55 | 59.75 | 276.82 | 472.99 |
| Mystery | 10.82 | 42.91 | 6.26 | 3.57 | 4.74 | 3.36 | 0.11 | 0.23 | 0.43 | 0.89 | 4.25 | 1,595.88 | 67.38 | 285.16 | 476.10 | |
| Extra | 10.82 | 42.92 | 6.26 | 3.57 | 4.74 | 3.36 | 0.11 | 0.23 | 0.42 | 0.89 | 4.25 | 1,594.67 | 66.17 | 283.92 | 475.72 | |
| Exclusive | 10.84 | 43.12 | 6.26 | 3.58 | 4.74 | 3.38 | 0.11 | 0.23 | 0.43 | 0.89 | 4.27 | 1,606.22 | 66.77 | 286.77 | 486.03 | |
| Exclaim | 10.81 | 42.91 | 6.26 | 3.57 | 4.74 | 3.36 | 0.11 | 0.23 | 0.43 | 0.89 | 4.25 | 1,595.29 | 67.31 | 285.00 | 475.89 | |
| Sale | 10.82 | 42.91 | 6.26 | 3.57 | 4.74 | 3.36 | 0.11 | 0.23 | 0.43 | 0.89 | 4.25 | 1,596.02 | 67.40 | 285.21 | 476.17 | |
| Code | 10.81 | 42.91 | 6.26 | 3.57 | 4.74 | 3.36 | 0.11 | 0.23 | 0.43 | 0.89 | 4.25 | 1,595.02 | 67.22 | 284.85 | 475.58 | |
| Population parameters | Mean | 10.81 | 42.91 | 6.26 | 3.57 | 4.74 | 3.36 | 0.11 | 0.23 | 0.43 | 0.89 | 4.25 | 1,595.08 | 67.33 | 284.97 | 475.63 |
| Standard deviation | 30.21 | 45.14 | 3.84 | 1.51 | 2.17 | 5.05 | 0.32 | 0.36 | 0.46 | 0.78 | 4.19 | 1,288.81 | 126.29 | 558 | 700.19 | |
Note. Pretreatment covariates: AR, ($); AW, ($); BD, Bday; Age, Age; Inc, Income; OC, ; CB, ; CC, Custom_Choice; POFF, ; PON, ; TD, ; DR, ; DO, ; DC, ; DP, .
aPretreatment customer feature variables for which SBtk is greater than 0.20 within a given program.
Finally, we also explore the validity of the key aspects of the “no carryover” assumption discussed earlier. In particular, neither the raw outcomes nor the recovered pairwise ATE estimates display evidence of periodicity (see Online Figures A8–A13). Second, a simple examination of the impact of the two prior emails (or the full count of all exposures) on the three focal outcomes for the baseline email (which was sent to the largest number of recipients) revealed no statistically significant effects of prior exposure on current outcomes. We consequently conclude that our setting satisfies the stronger sequential exchangability assumption so long as we condition upon the full set of RFM and other engagement variables in the firm’s information set.
6. Empirical Results
Having now introduced both our empirical setting and framework and assessed the overall degree of overlap and balance in our application, we now turn to estimation of the pairwise ATEs and subsequent projection of the recovered orthogonalized scores onto the treatment components and pretreatment covariates. In order to highlight the ability of our procedure to obtain valid and precise ATEs and then use the embedded ITE signals in an orthogonal projection step to obtain the component-wise effect of email characteristics on behavior, we proceed in four stages. First, we begin by considering a simple comparison of two specific emails to demonstrate that correcting for targeting is materially important. Next, we present the full set of recovered pairwise ATEs in our sample, highlighting the clear heterogeneity in consumer response to the combinations of email characteristics included in the emails as well as our estimator’s precise inferential performance at each stage of the funnel. Third, we shift to obtaining estimates (marginal effects) of the email characteristics and demonstrating the importance of accounting for the features that comprise the promotions. We also recover estimates of the heterogeneous response to the underlying components and discuss their implications for targeting. We conclude with an off-policy evaluation exercise aimed at demonstrating how the firm can increase engagement and profitability by modifying its targeting policy.
6.1. Motivation: A Single Pairwise ATE Example
We begin the discussion of our empirical results by demonstrating that our doubly robust ML approach allows us to recover sensible and precise ATEs despite strong targeting. To do so, we consider a pair of emails that are nearly identical save for a 10% difference in the discount amount offered, but targeted to different consumer segments. The first offered a 20% off deal on clearance items, whereas the second was for 30% off. Our goal is to recover the unbiased lift of the 10% discount differential between these two emails as that is the only difference between the deals (i.e., the task is akin to a simple A/B test).
In Table 8, we summarize both the naive conversion rates between the two emails and highlight the clear selection in the pretreatment targeting variables. Examining the raw conversion rates for these two emails, one is inclined to conclude that the 20% off email is superior to the 30% one as the conversion rates for the 20% off case are larger for all stages of the conversion funnel. However, after examining the pretreatment covariates, it is clear that the 20% off email was targeted to more engaged consumers. For example, both the Days_Open and Days_Pur are significantly lower for the 20% versus the 30% off email, indicating more recent engagement. Thus, without accounting for the targeting decision of the firm, interpreting these simple differences in these conditional means as causal very likely misattributes the engagement of the individual to how lucrative the email deal is for conversion outcomes.
|
Table 8. Comparison of Consumer Response and Pretreatment Covariates of Two Deals in Clearance Category Before Correcting for Endogenous Targeting
| Pretreatment covariates | Customer getting 30% off | Customer getting 20% off | |||
|---|---|---|---|---|---|
| Response and characteristics | Mean | Standard deviation | Mean | Standard deviation | |
| Response | Open Rate | 0.0793 | 0.2702 | 0.145 | 0.3521 |
| Pur. Rate | 0.0006 | 0.0244 | 0.0021 | 0.0461 | |
| Pur. Amount | 0.0408 | 2.3396 | 0.1265 | 3.5598 | |
| Recency | Days_Reg | 1,767.37 | 1,224.62 | 1,512.56 | 1,310.98 |
| Days_Open | 202.17 | 280.17 | 41.55 | 66.34 | |
| Days_Click | 534.99 | 704.61 | 72.47 | 81.14 | |
| Days_Pur | 963.12 | 837.94 | 124.74 | 102.43 | |
| Frequency | Order_Count | 0.90 | 2.16 | 5.14 | 5.72 |
| Tot_Dept | 1.63 | 2.73 | 6.21 | 4.02 | |
| Monetary | AoV_Retail | 6.87 | 25.43 | 13.90 | 33.16 |
| AoV_Web | 21.00 | 39.98 | 58.61 | 41.89 | |
| Habitual | Catl_Book | 0.08 | 0.27 | 0.13 | 0.33 |
| Custom_Choice | 0.16 | 0.36 | 0.29 | 0.46 | |
| Pur_Off | 0.36 | 0.48 | 0.49 | 0.50 | |
| Pur_On | 0.77 | 0.42 | 1.00 | 0.01 | |
| Demographic | BDay | 6.20 | 3.58 | 6.35 | 3.5 |
| Age | 3.39 | 1.54 | 3.75 | 1.25 | |
| Income | 4.60 | 2.26 | 4.89 | 2.04 | |
| Number of customers | 577 K | 655 K | |||
To illustrate the ability of our framework to mitigate such biases, we apply the first part of our approach (outlined in Section 4.1) to this pair of emails to recover the unbiased pairwise ATE at each stage of the conversion funnel. As noted, we train two distinct random forest algorithms, each comprised of 1,000 trees, to characterize the treatment propensity as well as the expected outcomes for these two cases for each stage of the conversion funnel. Using these predictions, we then calculate the appropriate score function. To further ensure that our results are robust to extreme values obtained in the score function step, we trim the data set at the 0.01 and 0.99 levels of the treatment propensities (Crump et al. 2009, Lee et al. 2011, Jacob 2019). Using the remaining score functions, we compute simple averages and take the difference to calculate the ATEs between these two emails at each stage of the funnel. From this exercise, we find the pairwise ATE between the 30% and 20% off deals is estimated to be approximately 3.10% at the open stage, 0.91% at the purchase stage, and 0.41 at the purchase amount stage (t-statistics for these estimates are 7.58, 48.11, and 15.15, respectively, indicating strong power). Given that the estimated ATEs are positive in all stages of the conversion funnel, this indicates that the treatment email (offering 30% off clearance items) is in fact the better performing deal overall. With this first example, we highlight the usefulness of the doubly robust method in our setting and provide face validity for our subsequent analyses.
6.2. The Full Collection of ATEs (Across All Emails)
Given that we are able to recover the pairwise ATE between any pair of emails in our sample, our next step is to apply the procedure to the full set to see if there are differences in their outcomes relative to a fixed baseline email. By comparing how each email performs relative to a single chosen email (rather than enumerating all pairs separately), we can more easily see whether there are certain key characteristics that are driving some emails to perform better or worse than others. The particular email used as baseline (number 34) was not highly targeted, exhibiting a demographic profile quite similar to the full (pooled) population.19
For each of the 33 remaining emails, we employ our doubly robust estimation framework and obtain the pairwise ATE of each given treatment email versus the baseline (details on the estimation steps followed for our unified framework are provided in the online appendix). Figure 1 plots these 33 estimated ATEs in order of lowest to highest response at the open stage of the conversion funnel along with their associated 95% error bars. Any email shown to have a negative ATE apparently includes some combination of individual components that render it worse than the baseline case. Similarly, those emails with a positive ATE are shown to outperform the control. The pattern of heterogeneous performance is quite similar to recent meta-studies of display ad effects (Johnson et al. 2017, Gordon et al. 2022) though the lift here is relative to that of the baseline email rather than a no treatment condition. The goal of the later orthogonal score projection exercise is to identify the particular email components that are leading to these differential performance outcomes.
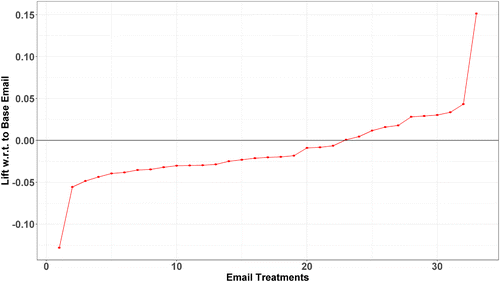
From the plot in Figure 1, we see there is significant heterogeneity in the open stage driven by the combination of causal heterogeneity factors (email components) present in the emails. We keep the same ordering in the subsequent two plots that instead consider the incidence of purchase and purchase amounts as the focal outcomes (Figures 2 and 3, respectively). There are a few takeaways from this series of figures. First, our baseline email is one of the better performing emails in the sample. Focusing on the open stage of the conversion funnel, only 10 other emails out of 33 outperform it. Overall, the range of these effects go from −0.128 to 0.152. Note that these are quite large effect sizes, comparable or larger in magnitude than similar conversion outcomes examined in the context of large-scale digital advertising at Facebook by Gordon et al. (2019). Given the very tight distribution of the included error bars, many of these relative lifts are statistically different from one another and all are significantly different from the baseline email.
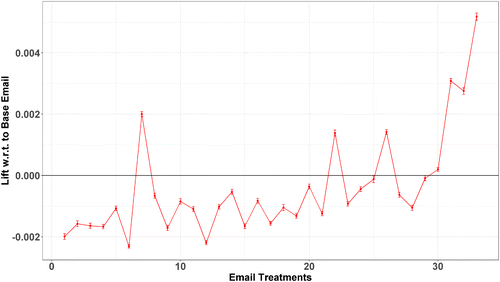
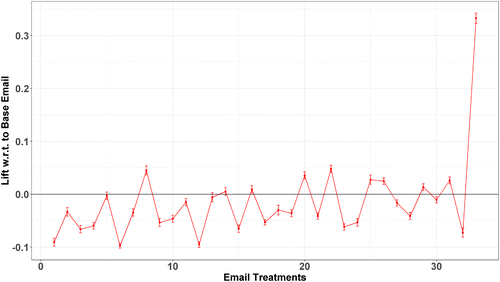
By comparing the ordering from the open stage to the differential in the purchase amount (compare Figures 1 and 3), we see that not all emails that have superior performance in driving opening rates result in higher purchase amounts. The pattern is generally increasing, but clearly nonmonotonic. There are 10 treatment emails that have positive ATEs compared with our baseline email in the open stage. Half of these 10 treatment emails instead have negative ATEs in the purchase amount stage. Therefore, we observe that certain email promotions are able to drive engagement but not necessarily action at the end of the funnel. This variation is not only important for our second stage analysis, but also important for the marketing manager to appreciate as it suggests that using upper funnel outcomes as a proxy for lower level ones can be misleading. In particular, it indicates that the increasing use of upper funnel “proxies” to offset perceived issues of power further down the funnel may be more problematic in practice than is currently appreciated (Johnson 2020).
To better understand how these patterns in the ordering of ATEs helps aid in our identification of email characteristic’s effects, we focus on a small subset of the 33 emails (see Table 9). These four individual emails all have one dimension that is the same, a 40% off discount (that is also shared with the baseline email). However, there are other notable departures. We see the email that includes personalization (number 9) and the one in the clearance category (number 18) each perform better than the baseline email, whereas the two emails in the product category (numbers 3 and 20) both perform worse than it. The observed covariation between characteristics and performance helps explain the patterns we see in Figures 1–3. After using the doubly robust approach to account for targeting, clearance categories are seen to perform better than nonclearance, whereas personalization drives even higher engagement. Further, we see that including multiple promotions tends to increase the engagement of individuals and, thus, result in higher ATEs. We turn now to a systematic analysis of these component effects.
|
Table 9. ATEs at Three Stages of the Conversion Funnel for Four Emails Having One Common Treatment Component: 40% Discount
| Heterogeneous treatment components | Conversion funnel ATE | |||||||||||
|---|---|---|---|---|---|---|---|---|---|---|---|---|
| Product | Clearance | Discount | Free shipping | Personalized | Extra | Exclaim | Happy | Code | Open | Purchase | Pur Amt | |
| 3 | 1 | 0 | 0.4 | 0 | 0 | 1 | 1 | 0 | 0 | −0.0437 | −0.0016 | −0.0659 |
| 9 | 0 | 0 | 0.4 | 0 | 1 | 1 | 1 | 1 | 1 | 0.0433 | 0.0028 | 0.0725 |
| 18 | 0 | 1 | 0.4 | 0 | 0 | 1 | 1 | 0 | 1 | 0.0336 | 0.0031 | 0.0261 |
| 20 | 1 | 0 | 0.4 | 1 | 0 | 0 | 0 | 0 | 1 | −0.0485 | −0.0011 | −0.0026 |
6.3. Orthogonal Score Projection: Causal Heterogeneity of Treatment
The full collection of pairwise ATEs reveals clear heterogeneity in the impact of different email promotions at all levels of the purchase funnel, whereas the simple exercise reported earlier suggests that this heterogeneity is likely driven by the particular content and framing of the included deals. To examine these heterogeneous effects in a systematic manner—and highlight the pitfalls associated with not doing so—we turn now to identifying the marginal effects of the full set of email characteristics that comprise our compound treatments. In particular, we use the methodology from Section 4.2 to project the orthogonalized scores (ITE signals) onto the differences in email components between each treatment email and the chosen control. Table 10 presents the results of our analysis of the effect of heterogeneous treatment components on open rates, purchase rates, and purchase amounts. Note that each set of orthogonalized signals (score functions) underlying the estimates for each outcome are unconditional on the previous stages of the conversion funnel. As such, the coefficients can be interpreted as describing how much a given treatment component increases (or decreases) the likelihood of opening an email or purchasing a product as well as how much they spend.
|
Table 10. Homogeneous Effect of Heterogeneous Treatment Components on Open Stage, Purchase Stage, and Purchase Amount
| (1) | (2) | (3) | |||||
|---|---|---|---|---|---|---|---|
| Type | Variables | (Open) | (Purchase) | (Pur. amount) | |||
| (Intercept) | −0.0488*** | (0.0016) | −0.0030*** | (0.0002) | −0.1680*** | (0.0191) | |
| Characters | −0.0011*** | (0.000) | 0.0000** | (0.000) | −0.0027*** | (0.0004) | |
| Merchandise category | Product | −0.0161*** | (0.0008) | 0.0003* | (0.0001) | −0.0034 | (0.01) |
| Clearance | 0.0657*** | (0.0011) | 0.0047*** | (0.0002) | 0.1660*** | (0.0128) | |
| Price | Discount | −0.0524*** | (0.0024) | 0.0025*** | (0.0003) | 0.0985*** | (0.0262) |
| Product: Discount | 0.0282*** | (0.0029) | −0.0058*** | (0.0004) | −0.1429*** | (0.0315) | |
| Discount: Clearance | 0.3511*** | (0.0077) | 0.0170*** | (0.0011) | 0.2411** | (0.0834) | |
| Dollar rebate | 0.0276*** | (0.0019) | 0.0028*** | (0.0002) | 0.1501*** | (0.0198) | |
| Nonprice | Free gift | 0.0399*** | (0.0011) | 0.0021*** | (0.0001) | 0.0571*** | (0.0138) |
| 50% off shipping | −0.0249*** | (0.0015) | −0.0009*** | (0.0002) | −0.1117*** | (0.0182) | |
| Free shipping | 0.0246*** | (0.0011) | 0.0003* | (0.0002) | 0.0721*** | (0.0148) | |
| Free returns | −0.0168*** | (0.0013) | −0.0011*** | (0.0002) | −0.0399* | (0.0162) | |
| Noninformative semantic choices | Personalized | 0.0940*** | (0.0010) | 0.0047*** | (0.0002) | 0.1134*** | (0.0115) |
| Mystery | 0.0154*** | (0.0018) | 0.003*** | (0.0003) | 0.1305*** | (0.0210) | |
| Extra | −0.0012 | (0.0013) | 0.0012*** | (0.0002) | 0.0117 | (0.0156) | |
| Exclusive | 0.0055*** | (0.0009) | −0.0028*** | (0.0001) | −0.0237* | (0.0097) | |
| Exclaim | 0.0124*** | (0.0006) | −0.0011*** | (0.0001) | −0.064*** | (0.0071) | |
| Sale | −0.0259*** | (0.0009) | 0.0014*** | (0.0001) | 0.0808*** | (0.0125) | |
| Code | 0.0159*** | (0.0008) | 0.0007*** | (0.0001) | 0.0293** | (0.0090) | |
| Observations | 3.795 M | 3.795 M | 3.795 M | ||||
| (Adjusted) R2 | 0.010 | 0.006 | 0.003 | ||||
Note. Robust standard errors are in parentheses for columns (1)–(3).
.p < 0.10; *p < 0.05; **p < 0.01; ***p < 0.001.
Table 10 organizes the individual promotion component effects by overall treatment type. Starting with the nonprice promotion group, we see that different promotions have quite different impacts, including both positive and negative marginal effects. Chatterjee and McGinnis (2010) suggest that the use of nonprice promotions, specifically those with free content, should increase engagement and outcomes. Whereas free gift and free shipping promotions increase engagement at all stages of the funnel (which aligns with the finding of Yi and Yoo (2011) showing positive brand valuation through the use of nonprice promotions), 50% off shipping and free returns actually reduce engagement throughout. This strong heterogeneity reveals the importance of breaking these treatments out by type. For example, were one to instead pool all four together into a single nonprice grouping (e.g., by computing the average pairwise ATE across all emails that include a nonprice inducement), the resulting measure—a pooled effect that yields a composite coefficient of –0.0012—suggests that nonprice promotions do not provide a meaningful lift from the baseline email (which instead contained a large price promotion). Note that this small impact is quite similar in magnitude to the average across the four nonprice promotion coefficients reported in Table 10, which further controls for the remaining components. This means that the poor performing treatment components are not just weak relative to the baseline, but actually reduce engagement relative to their noninclusion. Clearly, aggregating these distinct treatment components into a composite “nonprice” promotion effect masks what are in fact significant lifts that actually differ not just in magnitude, but direction as well. By isolating the direct impact of the actual intervention, we find that, whereas some promotions work quite well, others are instead quite counterproductive.
Moreover, focusing only on the open stage of the conversion funnel is also problematic in assessing the true magnitude of a nonprice promotion’s effect. For example, we note that both free gift and free shipping increase engagement, which is consistent with the existing literature (Chatterjee and McGinnis 2010, Park et al. 2018). Examining the exact size of each effect, free gift has a larger effect on harnessing engagement in the open stage. However, the key driver of the primary outcome to the firm, the purchase amount, is free shipping. The effects of these two nonprice promotions are materially different from one another with free shipping having the largest effect on purchase amount out of all the nonprice promotions despite the muted (but positive) effect on the open and purchase stages. This contrast of distinct effects across the conversion funnel at the component level is not addressed in the empirical literature but is critical for understanding the mechanisms that drive promotion performance.
Looking next at the components that constitute noninformative semantic choices, we again find quite striking causal heterogeneity. Personalization is especially effective at driving engagement at each level of the funnel and yields the largest overall (binary) effect, which is congruent with the findings of Sahni et al. (2018) regarding the inclusion of a recipient’s name. Whereas a contest structure (mystery) produces a similar lift at the purchase amount stage, its impact on opening rates and purchase incidence is more muted.20 Interestingly, specifying a deal as “exclusive” or simply adding an exclamation point to the end of the subject line increases opening rates but actually suppresses action at the purchase end of the funnel, perhaps explaining some of the reversals observed in the overall pairwise ATEs. Similarly, designating an item or set of items as being on sale reduces engagement at the top of the funnel but yields quite strong effects at the bottom, revealing a nuanced selection over who is drawn in that is reminiscent of the results in Liaukonyte et al. (2015) regarding TV ad content. Once again, as with the nonprice components, our results clearly demonstrate that it’s the actual promotion content that matters, not just running a promotion per se.
Turning finally to category and price promotions, we see that designating a particular product to promote generally has a negative (though muted) impact on engagement, whereas clearance is strongly positive. This suggests that the restrictive nature of featuring a specified item reduces engagement, whereas the less constrained clearance designation instead enhances it. The impact of discounts is surprisingly nuanced.21 Larger discounts actually suppress engagement at the opening stage when applied either to a general category or a particular product type and instead have a strong positive effect when coupled with a clearance designation. The overall negative effect persists though purchase amount for the product designation but reverses for the general category. In contrast, the positive effect for clearance persists across all stages of the funnel. This suggests that how discounts are actually framed and positioned is critical for performance. Tying them to a particular product appears to create a negative connotation—perhaps reflecting the perceived quality of the product—whereas connecting them to clearance engenders a strong positive association (i.e., that of a deal whose payoff is time sensitive). In contrast, a simple dollar rebate increases engagement at all stages (i.e., acts more like a pure price effect).
Once again, it is useful to contrast these disaggregated effects with what one would conclude from incorrectly pooling these distinct components together. For example, were one to instead specify discounts as operating entirely on their own (i.e., without the interaction with the product and discount dummies), the resulting parameter estimate for the opening stage (, t-stat = –23.867) suggests (incorrectly) that larger discounts suppress open rates when, in fact, the opposite is true for clearance items, and the (true) negative effect for products is larger in magnitude than this attenuated composite. Whereas the aggregated effects do comport with existing literature (Diamond and Johnson 1990, Kalwani et al. 1990, Krishna et al. 1991, Sinha and Smith 2000, Zeelenberg and Putten 2005), they are clearly masking important causal heterogeneity in the mechanism, which is not studied in depth within the digital promotions literature. Rather than targeting ill-defined composite effects, our decomposition allows both researcher and manager to correctly quantify the impact of complex interventions.
6.4. Orthogonal Score Projection: Heterogeneous Effects of Engagement
Whereas the previous section focuses exclusively on heterogeneity of treatment, we turn now to quantifying heterogeneity in the treatment effect itself. To aid interpretation, we sought a low-dimensional representation of consumer types that focuses on the information contained in past purchasing behavior. In particular, we use the pretreatment covariates to cluster customers into prespecified segments that define a low-dimensional set of GATE parameters that are straightforward to interpret. The clusters are identified using a standard K-means algorithm on the 15 pretreatment covariates included earlier; using the popular “elbow” heuristic approach, we found two clusters to be optimal (Kodinariya and Makwana 2013). From Table 11, which provides summary statistics for the two clusters, it is evident that customers in one cluster are far more engaged with the company that those in the other (Gopalakrishnan and Park 2021). We, thus, label the customers belonging to the more engaged cluster as High Engagement (HE) and refer to the remaining cluster as Low Engagement (LE).
|
Table 11. Summary Statistics of Pretreatment Covariates in Heterogeneous Customer Segments
| High engagement | Low engagement | ||||
|---|---|---|---|---|---|
| Recipient characteristics | Pretreatment covariates | Mean | Standard deviation | Mean | Standard deviation |
| Recency | Days_Reg | 1,522.83 | 1,298.8 | 1,679.65 | 1,271.80 |
| Days_Open | 37.59 | 69.01 | 102.14 | 163.70 | |
| Days_Click | 135.59 | 290.93 | 459.83 | 721.16 | |
| Days_Pur | 143.60 | 144.93 | 864.31 | 871.48 | |
| Frequency | Order_Count | 5.65 | 5.91 | 0.68 | 1.04 |
| Tot_Dept | 7.01 | 3.78 | 1.02 | 1.42 | |
| Monetary | Ave_Ret_Spend | 16.53 | 37.5 | 4.12 | 15.86 |
| Ave_Web_Spend | 67.47 | 45.27 | 14.15 | 22.17 | |
| Habitual | Catl_Book | 0.13 | 0.34 | 0.09 | 0.28 |
| Custom_Choice | 0.30 | 0.46 | 0.14 | 0.35 | |
| Pur_Off | 0.51 | 0.50 | 0.32 | 0.47 | |
| Pur_On | 0.99 | 0.11 | 0.78 | 0.42 | |
| Demographic | BDay | 6.35 | 3.49 | 6.15 | 3.59 |
| Age | 3.77 | 1.23 | 3.35 | 1.57 | |
| Income | 4.89 | 2.07 | 4.57 | 2.26 | |
| Number of customers | 681 K | 683 K | |||
An individual’s underlying engagement level is a key construct that firms frequently use to segment and target marketing promotions. In leveraging our ability to recover heterogeneous treatment effects, we proceed in the spirit of Ascarza (2018) by assessing how heterogeneity in overall engagement affects the promotional performance of the firm’s marketing efforts. Having clustered individuals into two distinct segments based on engagement, we project the same collected scores (ITE signals) as earlier onto the treatment components of each email once again but now do so separately by segment. Tables 12 and 13 contain the results for the effects of the various promotional offers and noninformative semantic choices on all three response outcomes, conditional on the engagement level of the customer.
|
Table 12. Effect of Heterogeneous Treatment Components on Open Stage, Purchase Stage, and Purchase Amount for High-Engagement Customers
| (1) | (2) | (3) | |||||
|---|---|---|---|---|---|---|---|
| Type | Variables | (Open) | (Purchase) | (Pur. amount) | |||
| (Intercept) | −0.0668*** | (0.0024) | −0.0042*** | (0.0004) | −0.2534*** | (0.0328) | |
| Characters | −0.0018*** | (0.0001) | 0.000*** | (0) | −0.0038*** | (0.0007) | |
| Merchandise category | Product | −0.0301*** | (0.0013) | 0.0001 | (0.0002) | −0.0147 | (0.0174) |
| Clearance | 0.1127*** | (0.0018) | 0.0087*** | (0.0003) | 0.2293*** | (0.0252) | |
| Price | Discount | −0.0655*** | (0.0036) | 0.0018** | (0.0006) | 0.1064* | (0.0453) |
| Product: Discount | 0.0217*** | (0.0044) | −0.0045*** | (0.0007) | −0.1661** | (0.0542) | |
| Discount: Clearance | 0.6575*** | (0.0120) | 0.0380*** | (0.0018) | 0.4765** | (0.1558) | |
| Dollar rebate | 0.0426*** | (0.0029) | 0.0032*** | (0.0004) | 0.2140*** | (0.0356) | |
| Nonprice | Free gift | 0.0612*** | (0.0016) | 0.0022*** | (0.0003) | 0.0895*** | (0.0240) |
| 50% off shipping | 0.0036 | (0.0022) | −0.0010** | (0.0004) | −0.1334*** | (0.0318) | |
| Free shipping | 0.0263*** | (0.0017) | 0.0007* | (0.0003) | 0.1334*** | (0.0256) | |
| Free returns | −0.0218*** | (0.0019) | −0.0014*** | (0.0003) | −0.0960*** | (0.0278) | |
| Noninformative semantic choices | Personalized | 0.1102*** | (0.0016) | 0.0061*** | (0.0003) | 0.2981*** | (0.0209) |
| Mystery | 0.0169*** | (0.0029) | 0.0035*** | (0.0005) | 0.1991*** | (0.0368) | |
| Extra | −0.0097*** | (0.0020) | 0.0011** | (0.0003) | 0.0415 | (0.0271) | |
| Exclusive | −0.0132*** | (0.0014) | −0.0023*** | (0.0002) | −0.0312. | (0.0171) | |
| Exclaim | 0.0130*** | (0.0010) | −0.0007*** | (0.0002) | −0.0712*** | (0.0124) | |
| Sale | −0.0322*** | (0.0014) | 0.0015*** | (0.0002) | 0.1231*** | (0.0220) | |
| Code | 0.0306*** | (0.0012) | 0.0012*** | (0.0002) | 0.0621*** | (0.0159) | |
| Observations | 1.930 M | 1.930 M | 1.930 M | ||||
| (Adjusted) R2 | 0.016 | 0.008 | 0.005 | ||||
Note. Robust standard errors are in parentheses for columns (1)–(3).
.p < 0.10; *p < 0.05; **p < 0.01; ***p < 0.001.
|
Table 13. Effect of Heterogeneous Treatment Components on Open Stage, Purchase Stage, and Purchase Amount for Low-Engagement Customers
| Type | Variables | (1) | (2) | (3) | |||
|---|---|---|---|---|---|---|---|
| (Open) | (Purchase) | (Pur. amount) | |||||
| (Intercept) | −0.0323*** | (0.0020) | −0.0017*** | (0.0002) | −0.0754*** | (0.0176) | |
| Characters | −0.0005*** | (0.000) | 0.0000*** | (0.0000) | −0.0014*** | (0.0004) | |
| Merchandise category | Product | −0.0005 | (0.0010) | 0.0006*** | (0.0001) | 0.0104 | (0.0092) |
| Clearance | 0.0229*** | (0.0013) | 0.0013*** | (0.0001) | 0.1067*** | (0.0107) | |
| Price | Discount | −0.0458*** | (0.0030) | 0.0027*** | (0.0003) | 0.0797*** | (0.0239) |
| Product: Discount | 0.0399*** | (0.0036) | −0.0064*** | (0.0004) | −0.0977** | (0.0303) | |
| Discount: Clearance | 0.0594*** | (0.0096) | −0.0007 | (0.0010) | 0.0414 | (0.0668) | |
| Dollar rebate | 0.0059* | (0.0024) | 0.0022*** | (0.0002) | 0.0760*** | (0.0162) | |
| Nonprice | Free gift | 0.0183*** | (0.0013) | 0.0017*** | (0.0001) | 0.0196 | (0.0127) |
| 50% off shipping | −0.0619*** | (0.0019) | −0.0007*** | (0.0002) | −0.0953*** | (0.0138) | |
| Free shipping | 0.0245*** | (0.0014) | 0.0002 | (0.0001) | 0.0084 | (0.0137) | |
| Free returns | −0.0153*** | (0.0016) | −0.0009*** | (0.0002) | 0.0196 | (0.0149) | |
| Noninformative semantic choices | Personalized | 0.0760*** | (0.0013) | 0.0033*** | (0.0001) | −0.0740*** | (0.0093) |
| Mystery | 0.0121*** | (0.0023) | 0.0024*** | (0.0002) | 0.0569** | (0.0196) | |
| Extra | 0.0073*** | (0.0016) | 0.0013*** | (0.0002) | −0.0200 | (0.0146) | |
| Exclusive | 0.0229*** | (0.0011) | −0.0029*** | (0.0001) | −0.0051 | (0.0092) | |
| Exclaim | 0.0138*** | (0.0008) | −0.0013*** | (0.0001) | −0.0518*** | (0.0065) | |
| Sale | −0.0218*** | (0.0011) | 0.0011*** | (0.0001) | 0.0325** | (0.0107) | |
| Code | 0.0050*** | (0.0010) | 0.0002. | (0.0001) | −0.0063 | (0.0088) | |
| Observations | 1.864 M | 1.864 M | 1.864 M | ||||
| (Adjusted) R2 | 0.007 | 0.005 | 0.003 | ||||
Note. Robust standard errors are in parentheses for columns (1)–(3).
.p < 0.10; *p < 0.05; **p < 0.01; ***p < 0.001.
For the HE group, we see effects that are, in general, significantly larger than those of the LE segment. Returning to our prior example of price discounts on clearance goods, we see that the HE group has a large positive (and precisely estimated) effect at each stage of the funnel. For the LE group, only the impact on the open stage is statistically significant. The effects at all stages are quite muted relative to those for the HE group, a pattern we revisit in the policy analysis. Broadly, the contrast between groups reveals that overall engagement is a strong moderator for many component effects as previously shown by Ascarza (2018) in the context of churn but repeated here in the context of both price and nonprice promotions. We note that, a priori, one might expect the effects to go the other way here if, for example, consumers in the HE group were more knowledgeable about the promotional tactics of the firm and, thus, exhibited more subdued effects. Instead, the experiences of the HE group, as embodied in their engagement level, tend to amplify their response, both positive and negative, to many different types of deals.
We also note two departures from the aforementioned amplification pattern that illustrates both additional opportunities for targeting and differential effects across the funnel. First, the impact of personalization on open rates and purchase incidence is positive and significant across both groups (not surprising given the earlier results). However, at the purchase amount stage, it is only the HE segment that sees an increase in spend—the LE segment actually reduces spend—indicating a tension between increasing awareness and driving bottom-line results for those disengaged types. Personalization is a clear win for the HE segment but more of a mixed bag for the LE group with whom the firm has apparently failed to forge a strong connection. The second departure is in the nonprice promotion category. Here, we see that the most effective inducements depend on type. For the HE group, free gifts dominate the top of the funnel, whereas for the LE types, it is free shipping. On the negative side, it is the LE groups that drive disengagement at the top of the funnel from the 50% off shipping promotion, whereas both types see reduced purchase and spend.
Overall, the key takeaway from this section is the marked difference in all effects across the groups, whereas the central theme of the previous section is the importance of the context. For our final empirical exercise, we now demonstrate how off-policy evaluation can allow the firm to leverage knowledge of both types of heterogeneity to both identify and evaluate opportunities to generate higher profits through improved targeting.
6.5. Better Targeting: Leveraging Segmentation and Orthogonal Scores to Increase Profitability
A powerful feature of debiased estimation is how seamlessly it connects doubly robust approaches to off-policy evaluation (OPE; Dudík et al. 2011; 2014). OPE methods allow firms to predict the performance of new policies by reweighting observed outcomes to reflect the proposed shift in individual assignments. The key inputs to OPE are the propensity and outcome models estimated alongside a candidate alternative policy with which to compare the policy or policies currently in place. By doing so, we can demonstrate the practical relevance (economic significance) of the earlier parameter estimates and calibrate the potential impact on bottom-line profits. To provide a simple indication of the scope for improvements, we return to the earlier example of the 20% versus 30% off clearance emails discussed in Section 6.1. Recall that these two emails differ only in their discount amount (a 10% differential), whereas all other characteristics of the emails remain the same. However, we found that the firm sent the 30% off email to customers that were relatively disengaged and the 20% off email to those who were more engaged. The results from the previous section suggest that this may have been a mistake as the disengaged customers are relatively unresponsive to discount amounts, whereas the highly engaged are very sensitive to them. In other words, given our earlier findings, a natural question to ask is whether the firm should be sending the better offers to the less engaged consumers or whether there is a potential opportunity to improve performance by switching their targeting strategy. Furthermore, focusing on optimizing an email from the clearance category presents a unique opportunity in that the firm’s central goal in this instance is, arguably, to simply maximize revenue (by clearing stock), which is the outcome we directly observe.22 Given the doubly robust structure in place and estimates already in hand, the off-policy evaluation exercise is straightforward: we use the doubly robust estimates to compare performance across two different policy regimes, one observed and one counterfactual. Following Dudík et al. (2011), we again use separate samples for estimation and prediction and scale up the predicted effects to the full population.
Doing so, we find that, under the current (factual) policy, the firm nets approximately $49,702 from these two emails. However, by using a targeting approach based on the set of RFM variables we use to distinguish the high and low engagement segments and sending the 30% off email instead to the high types and 20% off to the low engagement group, we achieve a predicted (counterfactual) revenue of $56,623. The differential lift, approximately 11% greater revenue, is primarily drawn from switching the 30% off deal to the high engagement customers as it is their behavior that drives the overall response.
Though this is a simple exercise, it shows the power of our approach in leveraging a high-dimensional treatment object coupled with observational data. Applying the doubly robust machine learning methods to observational data that satisfies the unconfoundedness condition allows us to obtain unbiased and precise measures of heterogeneous treatment effects that have tangible value to the firm. Further, projecting ITE signals down onto the email components, we can see a clear pattern of relative differentials in outcomes across a variety of complex treatment objects. This insight allows us to identify treatment components within emails that may be more or less enticing for driving engagement at multiple levels of conversion. Given that many marketing interventions are complex combinations of different design elements, this approach should have wide appeal for both observational and experimental studies. Furthermore, we show how using simple segmentation strategies and then applying this new knowledge to gain more granular estimates of the causal effect of our compound treatment objects aides us, and thereby the firm, in increasing profitability through better targeting decisions.
7. Conclusion
We develop and implement a unified framework for estimating the heterogeneous effects of the heterogeneous treatments embedded in compound marketing interventions. We build upon recent advances in causal machine learning techniques to nonparametrically account for both the endogenous targeting decision of the firm and the diverse responses of individuals to treatment. Our methodology is applied to the digital promotion domain, specifically 34 different email campaigns. We measure the effectiveness of individual treatment components (both promotional and semantic choices) present in the subject lines of these emails across the conversion funnel. We find precise and economically significant effects of these treatment components all the way down the funnel despite the challenge of endogenous treatment and the presence of complex, compound treatments.
The scalability of our ML-based approach affords practitioners and academics alike the opportunity to better understand and improve upon current marketing practice. By accounting for contextual cues, semantic choices, and promotions present in compound email treatments collectively, our second stage projection yields substantive insights not found in the existing literature on digital promotions. For example, by decomposing the overall effect of promotions, we find that some free giveaways (essentially price cuts) actually reduce engagement, whereas others enhance it. If one were to instead treat them collectively, the composite effect would be small, but positive—superficially consistent with prior analyses but obscuring the true mechanism of effect.
Further, by exploring the effects of these components conditional on a customer’s engagement level with the firm, our results also show congruence with other studies in the promotional literature; namely, the efficacy of our components is enhanced if the individual is a high-engagement type. Whereas this finding is generally true across our components, there are a noted few that show differential effects based on engagement level. We view these component effects as opportunities for managers to better target their customers, conditional on their level of engagement with different promotional and semantic cues. To show how materially impactful the insights from this study can be on profitability, we apply our insights to a clean counterfactual that compares two promotions observed in our study that focus on the same contextual cues but for which the observed targeting policy is revealed to be deficient through our analysis. Through the use of off-policy evaluation and constructs already provided by our unified framework, we demonstrate how leveraging the insights from our study to better target treatments can increase the revenue (profitability) of the firm by approximately 11%.
Although our application leverages observational data, our unified approach works seamlessly with either fully randomized trials or a mixture of both trial and observation. Applications exploiting both types of design would constitute a welcome topic of future research.
The authors acknowledge helpful comments from Alex Belloni, Yufeng Huang, Sanjog Misra, Saayan Mitra, Federico Rossi, Hema Yoganarasimhan, Guang Zeng, and Ting Zhu as well as seminar participants at Johns Hopkins, the London Business School, the University of Southern California, the Simon Business School, and the 2021 Marketing Science Conference. All remaining errors are our own. All authors certify that they have no affiliations with or involvement in any organization or entity with any financial or nonfinancial interest in the subject matter or materials discussed in this manuscript. The authors have no funding to report.
1 Given a fixed focal population of interest, the choice of baseline is an arbitrary normalization.
2 Our approach is also valid for analyzing RCTs. In particular, if a firm has conducted several RCTs examining particular subsets of treatment components, a manager could follow the same procedure to perform a combined analysis of the full superset even if each study was conditionally (as opposed to marginally) randomized. Doing so systematically allows one to further examine interactions between components, both building upon and exploiting prior results.
3 Note that, with observational data as opposed to a strict (conditionally) randomized experiment, it is important to also test and evaluate an additional positivity condition that ensures each treatment condition occurs with nonzero probability throughout the target population. We discuss this at length and provide empirical evidence of its validity in our particular application.
4 Note that all of the emails have an embedded code that allows us to track all subsequent consumer actions arising from each email.
5 In targeting emails to consumers, the firm does not monitor individual responses to previous deals, but chooses to condition only upon more aggregate information, such as the last time any email was opened and recent total spend.
6 Because of confidentiality constraints, we cannot report the full subject lines of each email.
7 In particular, using the typical effect sizes found in our later analysis, and the outcome standard deviations reported here, the average value of Cohen’s d at each stage of the funnel is 0.09 for open, 0.24 for purchase, and 0.12 for purchase amount, roughly two orders of magnitude larger than the “unfavorable” levels reported in Lewis and Rao (2015). Moreover, these values imply that the minimum sample sizes required to obtain an expected t-statistic of three for a null hypothesis of no relative effect would be 2,114, 310, and 1,274, respectively, which are quite small indeed.
8 HV refer to the compound treatment bundle as a “package of treatments” and provide the example of job training programs, which may be distinguished by differing period lengths (e.g., months) of training, varying quality of instruction, and so forth. Imai and Ratkovic (2013) consider the effects of different “get out the vote” mobilization strategies on subsequent voting behavior. The voter mobilization strategies include various combinations of personal visits, phone calls, and mailings as well as different appeals to “civic duty.” Each strategy is treated as a separate treatment. Imai and Strauss (2011) further consider optimal policy decisions based upon the estimated heterogenous treatment effectss. Grimmer et al. (2017) explore the heterogeneous response to heterogeneous written claims of credit by political candidates in a conjoint-type experiment implemented via Mechanical Turk. The components there are the inclusion of certain key words or phrases that tout a candidate’s accomplishments.
9 Factorial designs allow the effects of several factors (as well as their interactions) on a response variable to be measured experimentally. Of course, such designs suffer from a curse of dimensionality when the set of factors is too large, requiring the use of factorial designs or response surface methods instead (Cook et al. 2002). The approach used here is very much in the spirit of the response surface approach (Box and Wilson 1951).
10 The conditions for identification of the ITEs are that (1) there are no carryover effects of treatment, (2) the individual treatment effect does not depend on time, and (3) the counterfactual outcome under no treatment does not depend on time (Hernán and Robins 2020). In the context of the email campaigns examined here, we claim that large carryover effects are unlikely given the nature of the promotions, which are geared toward triggering an immediate purchase as opposed to building more long-term awareness or brand capital. Moreover, the time window is quite short and the volume of emails quite high. Whereas consumer’s attitudes toward various digital market campaigns likely evolve over time (as wear-out sets in) such processes likely unfold over longer horizons than that considered here.
11 One could similarly construct pairwise treatment effect estimands for the treatment on the treated. However, given the large number of treatments and the added challenge of specifying what it means to be “treated” when there is no control condition, focusing on the ATE and CATE seems more practical in our setting. The ATEs also have a simpler policy interpretation here as they involve statements that concern the full population of consumers.
12 Unconfounded assignment is also referred to as selection on observables, no unobserved confounders, or conditional exchangeability across the statistics, econometrics, biostatistics, and epidemiology literatures.
13 The requirement that there is no interference across units is also known as the stable unit treatment value assumption. Note that we must also assume that there exists a unique version of each treatment. See Imbens and Rubin (2015) or Hernán and Robins (2020) for further details regarding the conditions required for identification under unconfounded assignment. In the context of the email campaigns considered here, the various deals included in the email offers require a unique (embedded) code to redeem, limiting their ability to be shared across consumers.
14 Failures of overlap can be either random (e.g., a result of small sample sizes) or structural (because of a deterministic feature of the assignment mechanism). It is failures of the latter type that threaten identification.
15 Results that instead employed a LASSO regression for the propensity and outcome models are both qualitatively and quantitatively similar.
16 It is also similar in spirit to Imai and Ratkovic (2013), who place separate LASSO constraints on the pretreatment and causal heterogeneity parameters to recover a sparse representation of the CATE, and to the approach developed by Hitsch and Misra (2018), who project fitted treatment effect estimates (from either a nearest neighbor or CF procedure) onto demographic features. The key difference from the latter is that we project the treatment effect estimations down onto both the features of the population as well as the treatment components themselves (to capture both treatment effect heterogeneity and heterogeneous treatments in a single framework).
17 We also performed robustness exercises that involved dropping the few emails for which sufficient overlap might be in doubt and find the results to be materially unchanged. We return to this discussion later.
18 As noted, we also conducted a robustness check that involved dropping the five emails with maximum PSB scores above 0.25 from the analysis and found no material change in the second stage analysis (though these emails clearly no longer have pairwise ATE estimates). These results are contained in Online Tables 15–17, which can be compared with Tables 10, 12, and 13 as discussed in the context of the main results.
19 Because of the linearity of the expectations operator, the choice of baseline email does not affect the analysis and can be selected for expositional purposes.
20 However, the two stages together imply that impact on purchase amount conditional on purchase is actually stronger than that of personalization.
21 Our modeling framework allows for the easy use of interaction terms within the second stage projection. However, because of data limitations and support in our observed component space, we limit our interaction to be between merchandise category and the discount percentage (if present) in the email subject line.
22 Note that, absent more detailed information on costs and profit margins, we generally cannot assess the extent of profit improvement across the broad run of emails.
References
- (2003) E-customization. J. Marketing Res. 40(2):131–145.Crossref, Google Scholar
- (2018) Retention futility: Targeting high-risk customers might be ineffective. J. Marketing Res. 55(1):80–98.Crossref, Google Scholar
- (2016) Recursive partitioning for heterogeneous causal effects. Proc. Natl. Acad. Sci. USA 113(27):7353–7360.Crossref, Google Scholar
- (2019) Machine learning methods that economists should know about. Annual Rev. Econom. 11:685–725.Crossref, Google Scholar
- (2019) Estimating treatment effects with causal forests: An application. Observational Stud. 5(2):37–51.Crossref, Google Scholar
- (2009) Real-time evaluation of email campaign performance. Marketing Sci. 28(2):251–263.Link, Google Scholar
- (1951) On the experimental attainment of optimum conditions. J. Roy. Statist. Soc. B 13(1):1–45.Crossref, Google Scholar
- (2010) Customized online promotions: Moderating effect of promotion type on deal value, perceived fairness, and purchase intent. J. Appl. Bus. Res. 26(4).Crossref, Google Scholar
- (2017) Generic machine learning inference on heterogenous treatment effects in randomized experiments. Technical report, National Bureau of Economic Research, Cambridge, MA.Google Scholar
- (2018) Double/debiased machine learning for treatment and structural parameters. Econom. J. 21(1):C1–C68.Crossref, Google Scholar
- (2013) Statistical Power Analysis for the Behavioral Sciences (Academic Press, New York).Crossref, Google Scholar
- (2002) Experimental and Quasi-Experimental Designs for Generalized Causal Inference (Houghton Mifflin, Boston).Google Scholar
- (1958) Planning of Experiments (Wiley, Hoboken, NJ).Google Scholar
- (2009) Dealing with limited overlap in estimation of average treatment effects. Biometrika 96(1):187–199.Crossref, Google Scholar
- (1990)
The framing of sales promotions: An approach to classification . Goldberg ME, Gorn G, Pollay RW, eds. Advances in Consumer Research, vol. 17 (Association for Consumer Research, Provo, UT), 494–500.Google Scholar - (2011) Doubly robust policy evaluation and learning. Proc. 28th Internat. Conf. Internat. Conf. Machine Learn., 1097–1104.Google Scholar
- (2014) Doubly robust policy evaluation and optimization. Statist. Sci. 29(4):485–511.Crossref, Google Scholar
- (2021) The impact of coupons on the visit-to-purchase funnel. Marketing Sci. 40(1):48–61.Link, Google Scholar
- (2022) Close enough? A large-scale exploration of non-experimental approaches to advertising measurement. Preprint, submitted January 18, https://arxiv.org/abs/2201.07055.Google Scholar
- (2019) A comparison of approaches to advertising measurement: Evidence from big field experiments at Facebook. Marketing Sci. 38(2):193–225.Link, Google Scholar
- (2017) Estimating heterogeneous treatment effects and the effects of heterogeneous treatments with ensemble methods. Political Anal. 25(4):413–434.Crossref, Google Scholar
- (2007) Econometric evaluation of social programs, Part I: Causal models, structural models and econometric policy evaluation. Handbook of Econometrics, vol. 6, 4779–4874.Crossref, Google Scholar
- (2006) Estimating causal effects from epidemiological data. J. Epidemiology Community Health 60(7):578–586.Crossref, Google Scholar
- (2020) Causal Inference: What If (Chapman & Hall/CRC, Boca Raton, FL).Google Scholar
- (2018) Heterogeneous treatment effects and optimal targeting policy evaluation. Preprint, submitted February 6, https://dx.doi.org/10.2139/ssrn.3111957.Google Scholar
- (1986) Statistics and causal inference. J. Amer. Statist. Assoc. 81(396):945–960.Crossref, Google Scholar
- (2013) Estimating treatment effect heterogeneity in randomized program evaluation. Ann. Appl. Statist. 7(1):443–470.Crossref, Google Scholar
- (2011) Estimation of heterogeneous treatment effects from randomized experiments, with application to the optimal planning of the get-out-the-vote campaign. Political Anal. 19(1):1–19.Crossref, Google Scholar
- (2015) Causal Inference in Statistics, Social, and Biomedical Sciences (Cambridge University Press, Cambridge, MA).Crossref, Google Scholar
- (2019) Group average treatment effects for observational studies. Preprint, submitted November 7, https://arxiv.org/abs/1911.02688.Google Scholar
- (2020) Inferno: A guide to field experiments in online display advertising. Preprint, submitted May 15, https://dx.doi.org/10.2139/ssrn.3581396.Google Scholar
- (2017). The online display ad effectiveness funnel & carryover: Lessons from 432 field experiments. Preprint, submitted December 11, 2015, https://dx.doi.org/10.2139/ssrn.2701578.Google Scholar
- (1990) A price expectations model of customer brand choice. J. Marketing Res. 27(3):251–262.Crossref, Google Scholar
- (2013) Review on determining number of clusters in k-means clustering. Internat. J. 1(6):90–95.Google Scholar
- (1991) Consumer perceptions of promotional activity. J. Marketing 55(2):4–16.Crossref, Google Scholar
- (2014) Modeling customer opt-in and opt-out in a permission-based marketing context. J. Marketing Res. 51(4):403–419.Crossref, Google Scholar
- (2011) Weight trimming and propensity score weighting. PLoS One 6(3):e18174.Crossref, Google Scholar
- (2015) The unfavorable economics of measuring the returns to advertising. Quart. J. Econom. 130(4):1941–1973.Crossref, Google Scholar
- (2015) Television advertising and online shopping. Marketing Sci. 34(3):311–330.Link, Google Scholar
- (2013) A tutorial on propensity score estimation for multiple treatments using generalized boosted models. Statist. Medicine 32(19):3388–3414.Crossref, Google Scholar
- (1923) Statistical problems in agricultural experimentation. J. Roy. Statist. Soc. 2(2):107–180.Google Scholar
- (2018) The effects of mobile promotions on customer purchase dynamics. Internat. J. Res. Marketing 35(3):453–470.Crossref, Google Scholar
- (1958) The estimation of the parameters of a linear regression system obeying two separate regimes. J. Amer. Statist. Assoc. 53(284):873–880.Crossref, Google Scholar
- (1995) Semiparametric efficiency in multivariate regression models with missing data. J. Amer. Statist. Assoc. 90(429):122–129.Crossref, Google Scholar
- (1978) Bayesian inference for causal effects: The role of randomization. Ann. Statist. 6(1):34–58.Crossref, Google Scholar
- (1980) Randomization analysis of experimental data: The Fisher randomization test. J. Amer. Statist. Assoc. 75(371):591–593.Google Scholar
- (2018) Personalization in email marketing: The role of noninformative advertising content. Marketing Sci. 37(2):236–258.Link, Google Scholar
- (2017) Do targeted discount offers serve as advertising? Evidence from 70 field experiments. Management Sci. 63(8):2688–2705.Link, Google Scholar
- (2021) Debiased machine learning of conditional average treatment effects and other causal functions. Econom. J. 24(2):264–289.Crossref, Google Scholar
- (2000) Consumers’ perceptions of promotional framing of price. Psych. Marketing 17(3):257–275.Crossref, Google Scholar
- (2011) Targeted Learning: Causal Inference for Observational and Experimental Data (Springer Science & Business Media, New York).Crossref, Google Scholar
- (2007) Super learner. Statist. Appl. Genetics Molecular Biol. 6(1):1–21.Google Scholar
- (2018) Estimation and inference of heterogeneous treatment effects using random forests. J. Amer. Statist. Assoc. 113(523):1228–1242.Crossref, Google Scholar
- (2011) The long-term effects of sales promotions on brand attitude across monetary and non-monetary promotions. Psych. Marketing 28(9):879–896.Crossref, Google Scholar
- (2020) Design and evaluation of personalized free trials. Technical report, University of Washington, Seattle.Google Scholar
- (2005) The dark side of discounts: An inaction inertia perspective on the post-promotion dip. Psych. Marketing 22(8):611–622.Crossref, Google Scholar
- (2017) Dynamically managing a profitable email marketing program. J. Marketing Res. 54(6):851–866.Crossref, Google Scholar