


The Sequence Effect in Panel Decisions: Evidence from the Evaluation of Research and Development Projects
Abstract
We examine how groups fall prey to the sequence effect when they make choices based on informed assessments of complex situations, for example, when evaluating research and development (R&D) projects. The core argument is that the temporal sequence of selection matters because projects that appear in a sequence following a funded project are themselves less likely to receive funding. Building on the idea that selecting R&D projects is a demanding process that drains participants’ mental and emotional resources, we further theorize the moderating effect of the influence of the timing of the panel meeting on the sequence effect. We test these conjectures using a randomization in sequence order from several rounds of R&D project selection at a leading professional service firm. We find robust support for the existence of a sequence effect in R&D as well as for the moderating effect. We further explore different explanations for the sequence effect and how it passes from the individual to the panel. These findings have broader implications for the literature on innovation and search in general and on group decision making for R&D, specifically, as they suggest that a previously overlooked dimension affects selection outcomes.
Allocating scarce resources among competing opportunities is the essence of organizational decision making. Both individuals and groups make such choices in all walks of organizational life, including hiring employees (Raza and Carpenter 1987, Keller 2018), acquiring other firms (Vermeulen and Barkema 2001, Chakrabarti and Mitchell 2013), forming alliances (Ahuja 2000), financing start-ups (Astebro 2004, Guler 2007), and developing new products (Berg 2016). Regarding the latter, one important decision is which research and development (R&D) projects to fund. Selecting R&D projects is of vital importance as these projects create opportunities to renew the organization through the development of new products, processes, and services and enable the absorption of knowledge from outside the firm (Cohen and Levinthal 1990). They are also fraught with market and technical uncertainty, leading to a high rate of failure (Freeman and Soete 1997). To decide which projects to fund, organizations collect ideas for R&D projects over a period of time to present to a panel of senior people responsible for selecting the most promising ones (Rotemberg and Saloner 2000).
Prior research has gone to great lengths to understand R&D project selection to help firms improve it. Literature has studied how the selection is influenced by the quality of ideas (Mueller et al. 2011, Kornish and Ulrich 2014, Siler et al. 2015, Boudreau et al. 2016), the use of portfolio approaches and stage gates (Cooper 1990, Klingebiel and Rammer 2014, Brasil and Eggers 2019), and several contextual factors—for example, the people suggesting and pitching the ideas (Elsbach and Kramer 2003, Brooks et al. 2014), the people evaluating the ideas (Reitzig and Sorenson 2013, Loewenstein and Mueller 2016, Criscuolo et al. 2017, Mueller et al. 2018), the presentation of ideas (Tsay 2013, Falchetti et al. 2018, Lu et al. 2019), the interplay between idea generation and selection (Harvey and Kou 2013), past and current decisions (Helfat 1994), and feedback (Wooten and Ulrich 2017).
We contribute to this stream of research by examining the role of the temporal sequence of decisions in the selection of R&D projects. Although the literature has acknowledged that R&D decisions are liable to be made in the context of other decisions (Klingebiel and Rammer 2014, Brasil and Eggers 2019), little attention has been paid to the temporal sequence of these decisions. Indeed, the innovation literature tends to treat these decisions as temporally independent of each other; that is, the sequence has no bearing on the outcomes. This is problematic as research in psychology (Pepitone and DiNubile 1976, Plous 1993), behavioral finance (Hartzmark and Shue 2018), and behavioral economics (Tversky and Kahneman 1974, Bhargava and Fisman 2014, Chen et al. 2016, Bindler and Hjalmarsson 2019) suggests that the sequence does influence the outcomes. It remains unclear, however, whether this finding applies to settings—such as the evaluation of R&D projects—in which panels make choices based on informed assessments of complex situations.
Exploring the role of sequence in R&D project selection and uncovering its causal effects is challenging because the order is often not random. Selection processes are usually designed to be efficient for evaluators, either by sequencing decisions based on the anticipated quality of the ideas or by screening ideas initially and removing those below an expected threshold value. We circumvent this problem by drawing on a unique data set in which, to ensure fairness, the sequence of evaluated projects is random. Sometimes it is based on the surname of the applicant and sometimes on the application identification number produced by the online R&D management system. Either method may be used sometimes in descending order, sometimes in ascending order, and sometimes in a totally random order. The ordering principle is unknown to the panel and the applicant who proposed the project. Using this random order as a quasi-experiment allows us to identify the causal effects of the sequence on the decision to fund an R&D project. These data afford a unique window into decision making by a panel inside an organization and allow us to develop new insights about how temporal sequence matters in a situation in which it should, were the meritocratic ideal upheld, have no effect on the outcome.
We integrate the literature on innovation with research on decision making to develop a prediction about how the temporal sequence shapes panels’ selection decisions. After documenting a clear and economically meaningful sequence effect, we explore the mechanisms driving the effect and how it passes from the individual to the panel. Turning to how timing moderates the sequence effect, we demonstrate that the sequence effect in R&D decision making is stronger if the decision is made later in the meeting. These findings have broad implications for the literatures on innovation and search and on group decision making in contexts characterized by uncertainty, such as R&D projects.
Theory and Hypotheses
Evaluation and Selection of R&D Projects
Deciding how to allocate resources across R&D projects has tremendous implications for a firm’s knowledge trajectory, performance, and even survival. R&D selection decisions tend therefore to be made by panels of senior members of the organization who invest significant time and effort in it. These panels are designed to represent different parts of the organization and act as the delegated authority in the collective interests of the organization. As obtaining a quorum of appropriate individuals requires significant coordination, these panels meet quarterly or annually, and membership is relatively stable. To ensure a rigorous process, information about the projects is often standardized and disseminated in enough time for each evaluator to review before the meeting. Panel members are expected to review all aspects of the R&D project—including the applicant and the team, the project’s technical and business objectives, and its feasibility—and to assess it against a set of preset and agreed-upon criteria (Cooper 1998).
Given the uncertainty of R&D, there are often conflicts between panel members, mainly about what problems to address with the resources at hand. These discussions often center on an idea’s technical viability and market opportunity. Panel members will be aware of the escalating costs and time delays characteristic of most innovative efforts and of how statements of market opportunities may be based on partial and often unrealistic assumptions (Freeman and Soete 1997). Moreover, different senior leaders in the firm may hold contrasting visions about how markets and technologies will develop; these differences will be reflected in their evaluation of the R&D projects and the credibility they assign to the information proffered about them (Helfat 1994). These disputes might even spill over into acrimony and lead to tensions that interfere with more reasoned and calculative judgments of an idea’s merits. Accordingly, the R&D decision-making process often drains and sometimes exhausts the participants’ mental and emotional resources.
To help organizations improve the process, researchers have explored various aspects of it (e.g., Berg 2016, Loewenstein and Mueller 2016, Criscuolo et al. 2017, Mueller et al. 2018, Lu et al. 2019). Although this literature notes that there are multiple ideas being evaluated, it gives only modest attention to how the temporal sequence of evaluations might affect the decisions being made.
Understanding Sequence Effects in Individual Decision Making
Although the impact of temporal sequence in decision making is often absent in the conversation about the selection of innovation, research in psychology (Pepitone and DiNubile 1976, Kenrick and Gutierres 1980, Plous 1993, Damisch et al. 2006), behavioral finance (Hartzmark and Shue 2018), and behavioral economics (Tversky and Kahneman 1974, Chen et al. 2016, Bindler and Hjalmarsson 2019) has highlighted that the sequence in which individuals make decisions affects the decision outcomes. This research has discussed four explanations for sequence effects: the law of small numbers, contrast effects, quota models, and learning. All four explanations agree that individuals overemphasize recent information as a cognitive shortcut when dealing with complex or uncertain situations, but each proposes a different channel by which the sequence effect emerges. We will discuss each explanation in turn.
The law of small numbers describes the tendency of people to overestimate the likelihood that a short sequence will be representative of the general population of sequences or to underestimate the likelihood that the order in which things will happen is random (Laplace 1814, Tversky and Kahneman 1971, Rabin 2002, Rabin and Vayanos 2010). A well-known example is the prediction about the toss of a coin. Although heads and tails are equally likely, people tend to predict heads when the last coin flip was tails. The law of small numbers is often associated with gambling situations in which people make incorrect predictions about the next outcome based on incorrect inferences from past observations. This idea is thus also known as the gambler’s fallacy. Although prior research mainly examines the law of small numbers in the context of gambling (Rapoport and Budescu 1992, Clotfelter and Cook 1993, Terrell 1994, Dohmen et al. 2009, Suetens et al. 2016), the concept has recently also been applied to complex decisions. However, this use of the concept differs from its canonical treatment in two important ways. First, instead of just focusing on predictions, Chen et al. (2016) study complex decisions that entail both an element of prediction and an investigation of the merits of the current case. Controlling for quality, they find evidence for negative autocorrelation between individual’s consecutive decisions in the context of refugee asylum decisions, loan application reviews, and Major League Baseball home plate umpire calls on pitches. They argue that in such complex decisions, a decision maker affected by the law of small numbers may believe that a consecutive sequence of good or bad events (such as a string of safe loans or bad pitches) is unlikely to occur by chance. Thus, the decision maker approaches the subsequent event with a prior belief that it is more likely to be negative if the previous one was positive. As it is fair to assume that decisions under uncertainty are at least partially influenced by the decision maker’s priors, these priors then lead to negatively autocorrelated decisions. Second, instead of focusing on streaks, Chen et al. (2016) acknowledge that it is the previous decision—not only a streak—that is important. Although a sequence of coin tosses is composed of repeated homogeneous events, a sequence of complex decisions is composed of heterogeneous events. Research in psychology has shown that people find it harder to remember heterogeneous series than homogenous ones (Poirier and Saint-Aubin 1995). Hence, they are more likely to remember the outcome of the last event than to remember earlier outcomes. In addition, in complex decisions, one must investigate the decision at hand thoroughly, which requires time and attention. In such a situation, one is more likely to remember the last decision and take it into account than older decisions, which may have faded out of recall (Aldrovandi et al. 2015).
The second explanation for a negative autocorrelation among consecutive decisions is a contrast effect, that is, the transient contrastive inference of recent context on subsequent decisions (Bhargava and Fisman 2014). A contrast effect occurs when the value of a previously observed signal inversely biases perception of the next signal. Empirical evidence for the contrast effect has been found across many settings, including crime judgment (Pepitone and DiNubile 1976), speed dating (Bhargava and Fisman 2014), professional investment (Hartzmark and Shue 2018), assessment of job performance (Smither et al. 1988), and home searches (Simonsohn and Loewenstein 2006). When deciding which R&D initiative to fund, the decision maker perceives the quality of the current case more negatively if the previous case was of high quality.
Third, it is also possible that decision makers base their decision on a quota model. This model states that decision makers work toward achieving a certain quota of expected outcomes (Bhargava and Fisman 2014, Chen et al. 2016). These quotas could be in reference to a range of formal outcomes, such as the total allocation of funding, or of informal outcomes, such as the gender or location of applicants. In the R&D context, quotas could also relate to expected features of the portfolio of R&D projects, such as the mix of short- and long-term projects and the allocation amongst divisions (Klingebiel and Rammer 2014). Previous decisions in the sequence might then lead evaluators to discount the value of the focal decision because they have already allocated funding to other projects in the same investment category. In this case, this decision is not based purely on a judgement of the project itself but instead on an expectation about the features of the expected pool of decisions. A quota model can therefore lead to a negative decision when the prior proposal was supported, as a positive decision would create an imbalance in the expected resource allocation.
Another reason why a previous positive funding decision may be followed by a negative one is learning, which applies when decision makers are inexperienced and need to form expectations about expected outcomes (Bhargava and Fisman 2014, Chen et al. 2016). That is, when selectors begin evaluating projects, they believe a certain fraction of projects to be good and build a screening function that corresponds to their beliefs about the fraction of good projects in the pool. Over time, they learn and update their screening function depending on the quality of projects they have seen. However, during this learning period, they may (dis)favor a project based on where it appears in the sequence. This can be unfortunate: Decision makers should indeed learn over time, but adjusting the screening function from project to project is an irrational updating behavior.
Main Effect: The Sequence Effect in Group Decision Making
Although most research on sequence effects is at the individual rather than group level, important organizational decisions like selecting R&D projects are made by groups rather than individuals (Tindale et al. 2003). March and Simon (1958) were early to acknowledge that group decision making deserves particular attention. They argued that because groups involve communication between individuals, “many of the steps that would otherwise take place inside the individual brain become visible to the observer” (March and Simon 1958, p. 181). Groups enable deliberative and integrative decision-making processes, allowing different members to voice their opinions and shape the views of other members. Many organizations have therefore thought that groups overcome some of the biases of individuals. However, the extent to which group decision making can overcome individual biases remains questionable. For instance, research on social evaluations has convincingly shown that organizations often deviate from their meritocratic ideals (Castilla 2008, Lamont 2009, Castilla and Benard 2010). The implication is that although a panel should justify their decisions based on objective performance criteria that should leave no room for other aspects (e.g., the sequence effect), even groups can suffer from biases in their decision making. Research has, for example, shown that panels display preferences toward individuals with particular characteristics (Aadland et al. 2019) or that panels tend to select against novel ideas when they originate from someone they know (Criscuolo et al. 2017).
Research in social psychology has also illustrated that groups do not always overcome their members’ individual biases. Tindale (1993, p. 121), for example, concludes that “groups do not always check errors” and that they can even make more severe errors than individuals. In short, this research suggests that shared belief systems can cause groups to make errors, particularly in situations characterized by high uncertainty, such as innovation projects (Kerr and Tindale 2004). In the R&D context, evaluators with a shared commitment to an agreed-upon technology roadmap might favor a project in a domain aligned with the roadmap, even if certain members are aware of significant problems with the project itself. Indeed, the benefits of information diversity can only be achieved if group members openly share their knowledge and concerns. But group members often prefer instead to go along with the person introducing the decision or to base their decisions on shared belief systems or understandings (Brodbeck et al. 2007). Research has shown that groups tend to focus on shared information in their deliberations rather than on information held by one or a few members. As a result, shared information is usually given greater priority, repetition, and credence in discussions (Stasser and Titus 1985, Brodbeck et al. 2007). Interactive group decision making is thus “better understood as rationale construction rather than as information collection,” whereby group members explain their choices to each other to gain confidence in their mutual decisions (Heath and Gonzalez 1995, p. 305).
Although group decision making can sometimes mitigate bias associated with individual decision making (Stasser and Titus 1985), we suggest that when decision making occurs in sequence, groups are also liable to the same problems inherent in individual decision making. The requirement to evaluate a diverse and broad range of ideas and projects in a limited time may also lead panels to use simple decision-making heuristics, such as the recency heuristic. The extent to which the sequence effect plays out at the group level depends on at least three factors described below: (a) the structure of decision making (Cyert and March 1963, Csaszar and Eggers 2013), (b) the pattern of communications (Simon 1947), and (c) the relationships among group members (Simon 1947).
First, there are many possible decision-making structures, typically based on voting or averaging, by which groups can indicate their collective preferences (Csaszar and Eggers 2013). These approaches provide a credible means of finding agreement among diverse representatives, helping the group’s decisions to reflect the different knowledge and experiences of its members. Although aggregating the views of individuals may smooth or reduce biases arising from an individual member (Becker et al. 2017, Newham and Midjord 2019), these approaches may prove ineffective if a large share of members of the group share a bias, such as the sequence effect. Indeed, aggregating even amplifies such a bias if each decision maker is affected by it. Thus, the aggregation benefits of group decision making may not help to attenuate sequence effects arising from individual-level biases, but rather reinforce them.
Second, if a decision is not made by a simple aggregation of individual views but is rather the outcome of intense deliberation, then it is critical to understand the pattern of communication among group members (Simon 1947). In R&D decision making, as in many other areas of collective decision making, applications are often introduced to the panel by a member. Those members play an important role in framing the subsequent discussion, as they act as key advisors about what issues the group should consider with respect to the project. In doing so, they are liable to highlight positive and negative aspects, weaving together their own insights with available external information. Their own views of the project may be subtly reflected in their tone and presentation (Bonaccio and Dahal 2006). The way the introducer frames a proposal may be influenced not only by its merits and risks but also by the outcome of the previous decision. If introducers are liable to a sequence effect, this might affect their own view of the project, which may then shape the attitudes of others. Thus, the sequence effect may be transmitted from the individual to the panel.
Third, the outcome—including any manifestation of a sequence effect—also depends on the relationships between the panel members. For example, if there are different levels of seniority or if some voices are more prominent than others because of differences in expertise, the panel’s decision is largely influenced by such a senior or prominent person. If this person’s voice undergoes a sequence effect, we expect to see a sequence effect at the group level (Tarakci et al. 2016, Greer et al. 2018). In addition, as these panels decide on multiple projects, the panel members may also consider the dynamic nature of their relationship and give in to one member’s strong opinion on one case in the expectation that the favor will be returned on a future case. In this case, the sequence effect will also pass from the individual to the group.
In line with our reasoning, Bindler and Hjalmarsson (2019) provide evidence for just such biases in group decision making by showing positive sequence effects caused by assimilation in jury decisions in nineteenth-century England. Accordingly, we suggest that within R&D project funding decisions, panel members will be influenced by their prior funding decisions. If they have already funded a project in the focal sequence of projects, that decision will negatively affect their decision to fund the following project. We therefore hypothesize the following:
Priorpositive funding decisions negatively affect the panel’s funding of the subsequent project.
Moderation Effect: How Timing Shapes the Sequence Effect in Group Decision Making
Sequence effects emerge as individuals and groups show increased sensitivity to recent outcomes (Barron and Leider 2010). Although this increased sensitivity may lead to decision-making bias, it is almost inevitable. Selecting R&D projects is a demanding process, potentially exhausting and draining of participants’ mental and emotional resources as they deliberate on various options. Taking into account all the relevant information to properly evaluate these projects consumes attention (Simon 1957). The long and intensive decision-making sessions involving multiple panel members demand considerable executive function and self-control (Baumeister 2002, Ocasio 2011). Executive function is a set of cognitive control processes that mediate attention and memory (Kaplan and Berman 2010). They are heavily involved in planning, decision making, and dealing with challenging situations (Norman and Shallice 1986), among others. Self-control is the capacity to overcome selfish impulses to act in a socially desirable way and to bring behavior in line with long-term goals and interests (Baumeister et al. 2007).
Decision making in groups requires a significant level of self-control as panel members must treat each project with similar care and attention despite naturally having greater interest in some projects than in others. Panel members must ensure that the R&D selection process is procedurally fair and deliberative (McFarlin and Sweeney 1992), ensuring its legitimacy to the various stakeholders, including those applying for funding as well as others in the organization who will scrutinize the decisions. Further, when panel members engage in heated debates, they must ensure that they treat each other with respect and understand the arguments of their counterparts, even when these views diverge from their own or from the perceived interests of their own part of the organization. Executive functions and self-control also interact with each other and draw on a common resource (Kaplan and Berman 2010). This resource is limited and depletes over repeated exertions, like the strength of a muscle (Baumeister et al. 1994). Empirical evidence for this effect has been found across multiple studies in both the laboratory (Baumeister et al. 1998) and the field (Danziger et al. 2011). Thus, the longer a meeting lasts, the lower the attentiveness of panel members and therefore the likelier they become to draw on decision-making heuristics. We therefore hypothesize the following:
The negative impact of a positive prior funding decision on the funding decision of the focal project is stronger later in panel deliberations.
Methods
Research Context
We study the selection of R&D projects by a panel of senior people inside a large, multinational professional service firm (PSF). PSFs account for a sizeable part of the modern economy, larger, in fact, than the manufacturing sector in most advanced economies. PSFs are knowledge-intensive organizations, employing highly educated staff who apply their knowledge and skills to solve clients’ problems (Teece 2003). Professional practice is rooted in deep expertise, developed either by extensive formal and informal training or through on-the-job response to clients’ needs (Abbott 1988). Although most learning in PSFs takes place “on-line” through working on client-funded projects, PSFs also often invest in “off-line” learning via R&D and other innovation-related activities (Gann and Salter 2000, Criscuolo et al. 2017).
As is often the case in PSFs, the R&D initiatives in our research context are wide ranging. They are designed to improve performance, develop new areas of expertise, deepen and extend the firm’s market knowledge, explore technological trends and technical tools, or integrate diverse sets of knowledge. Despite their importance, these projects are modest in terms of the financial resources required to carry them out. For example, one proposal in the study aimed at developing new software to predict the behavior of glazing under blast-loading arising from bomb attacks and industrial explosions; the requested funding was £48,000. The organization also uses these funds to invest in its knowledge infrastructure, such as electronic communities of practice, internal workshops, and events for specific internal communities or interests. Funds also enable staff to engage in extrarole activities, such as attending conferences, collaborating with university partners, and attending trade fairs. These initiatives, too, tend to be small in cost and scope. For example, one proposal requested £10,000 to set up an electronic community of practice for rail engineers.
PSFs often allow high individual autonomy (Malhotra et al. 2006, Von Nordenflycht 2010); R&D in this organization is largely a bottom-up activity, relying on individuals and teams to bring forward ideas for central support. These ideas are described in formal applications to an organization-wide R&D investment fund. Although applicants are required to describe how the initiative might benefit the organization, they typically provide indirect statements of future value with little or no clear financial prospectus. Many of the initiatives are designed to generate new knowledge, the value of which is hard to predict and may only be realized through future engagements with clients (Hertog 2000). Moreover, because many of the work activities and value-added activities of professional service workers are themselves unmeasured (other than hours billed out to external clients, and even those are costs on a raw-hours basis), it is hard to know ex ante which investments will generate the highest return in productivity or market development (Teece 2003).
This organization’s approach to R&D selection has several distinctive features. First, the panels deciding on the allocation of funds to R&D initiatives operates based on consensus, reaching a collective view about a project’s merits. Second, the panels are composed of both senior business and senior technical leaders and maintain a degree of stability in membership from year to year. All members are treated equally, and either business or technical leaders may introduce projects. Third, the entire R&D process is transparent to all members of the organization, as all R&D applications, comments, selection panel membership, and decisions are kept on the organization’s intranet, rendering the decision makers involved in the R&D process accountable to the wider organization. Fourth, although the R&D budget is designed to be aligned with the organization’s needs, the diversity of the organization’s professional practices makes it difficult to use structured allocations or to weigh projects in different areas against one another. In effect, the bottom-up nature of the R&D project-generation process is reflected in the selection process, providing space for individuals and teams in any area of the firm’s activities to bid for resources. Indeed, the organization deliberately does not use formal R&D portfolio or program management tools, although it carefully monitors project overlap, allocations across practice areas, and the progress of funded projects. Fifth, the funding constraints faced by the R&D panels are modest. Interestingly, in most years, the organization struggles to fully spend its allocated R&D budget, because many applicants fail to deliver their R&D projects within the financial year, given their other work pressures. This, though, provides the panel the luxury of making allocation decisions without a strong budget constraint, as it can be expected that many of the funding projects are not likely to be completed in the same financial year. Finally, as senior and technical experts, the panel members are expected to—and do—use their expert judgement. As a result, the panels do not rely on scoring systems or other means of quantifying uncertain and largely qualitative judgements. One of the interviewed panel members explained some of the key features of an R&D application that influence its funding decision:
[Y]ou'd expect to see the aim, the benefits to [the company], the team properly worked out, the budget properly accounted for and responsibilities and then deliverables set out quite clearly. […] Good impact, so some notion about how it's going to benefit clients and how it's going to benefit the firm. Then, as I've mentioned, the usual good project characteristics … applying common sense rules to whether it looked right, and endorsement. So, if you've got a senior person or somebody else you knew who knew their business saying, “Actually, this is rather good, I've got clients asking for this, if we knew that we could do [it].
In our study, we focus on a panel in the organization that has overall responsibility for leading technical development and reports directly to the chief executive officer. This panel is the primary unit for allocating organizational resources to innovation, with delegated powers over the budget. The panel manages the largest share of the firm’s R&D budget and therefore receives the highest number of applications out of the organization’s eight selection panels. In addition, the sequence of decision making in this panel is random to ensure fairness to the different units. In some instances, the panel secretary ordered the proposals based on the applicant’s surname, in others on the application identification number produced by the online R&D management system. Either method could be used sometimes in descending order, sometimes in ascending order, and sometimes in a totally random order. Tests reported later confirm that this indeed led to random sequences.
The panel meets four times a year, with some of these meetings spread across multiple days because of the high number of proposals and the availability of the members. Therefore, our study includes 16 meeting days: 6 in 2006, 4 in 2007, and 6 in 2008. The panel has five people: the R&D director, the director of the knowledge management department, and the three directors responsible for overseeing investment in the three main practice areas. During our sample period, at least one senior manager would step down each year to allow a new member onto the panel, which results in four sets of members on this panel. All members have the same seniority level—the highest ranked below the board in the organization. Each director is responsible for building a case for projects in his or her practice area, but the decision of whether to fund a given project is a collective one. Therefore, we are studying a group decision-making process, but one in which an individual—the introducer—starts and leads the discussion.
The panel secretary gathers all the proposals and supporting documents in a printed booklet and distributes it to the members a few days before the meeting. Panel members conduct a detailed individual assessment of each project based on their own knowledge and experience, using the supporting information provided by the applicants and the additional comments posted on the R&D project management system. They often consult colleagues, especially when evaluating a project outside their own area of expertise. One panel member comments:
I would often then sound people out to try and get the business leaders’ views, or the technical leader’s view, on which was the priority so that it wasn't just down to me, given that I wouldn't necessarily be an expert in that subject. That could take quite some time … I'd do that over several days prior to the meeting.
This approach was especially necessary when they had to evaluate projects that were outside their area of expertise.
Data
This paper builds on and extends Criscuolo et al. (2017), as it draws from parts of the same data set focusing on a subsample of R&D decisions where there is a quasi-random sequence of decisions. Our primary data are all R&D project applications submitted between 2006 and 2008. The applicant must describe the project’s aims and its expected benefits and risks and must specify the project manager, project director, and all other team members. The application documents, together with comments from other members of the organization, are stored in an open and searchable R&D project management system.
During our sample period, the selection panel made 604 funding decisions. However, the number of deliberations is 763, as a project may be re-evaluated if there was not sufficient information offered at the first evaluation to properly judge its potential benefit.1 We decided to include these projects to derive the variables, which are constructed using the sequence of the allocation process; but we excluded them from our regression analysis unless a final funding decision was made on them. As the theoretical reasoning hinges upon what happened in the prior decision, we needed to drop the first decision in each of the 16 meetings. Our final sample thus includes 588 funding decisions.
We also had access to the booklet prepared by the secretary of the panel. It contained all the material stored in the R&D project management system and was used to help with the assessment process. The secretary explained to us that projects were discussed in the order in which they appeared in the booklet:
I print all the applications out … and even though it feels like a waste of paper, [the panel members] have said the book … is really beneficial. So, my task is really to create the list, to then order it by the [practice areas] … Then at a face-to-face meeting, we go through them.
The secretary ordered the projects first alphabetically by the name of the practice area in which the proposal was classified (acoustics, bridges, electrical, and so on), without making any judgment on the quality of the applicant or the project. Within each practice area, the secretary ordered the applications sometimes by the applicant’s surname and sometimes by the application identification number produced by the R&D management system—and in either case, sometimes in descending order, sometimes in ascending order, and sometimes in a totally random order. The order of assessment was not known to the applicants themselves, as this document was not shared outside the panel. Both features reassure us that the projects are not ordered in a systematic way and that applicants cannot game the system.
The funding allocation was a sequential process in which a decision was made on each application before moving on to the next one, as confirmed by one of the panel members.
[T]ypically, we would adjust the money as we went through [the booklet]. Sometimes, we'd get to the end and we'd spent more money than we could afford and then we would go back through and maybe shave some money off. But that was quite rare.
We collected further data from the R&D department’s internal records on the annual budget that the panel managed, the names of the panel members in our sample period, the R&D roadmap formulated in 2006, and the list of practice areas for which the panel had decided to preallocate some funding. From the human resources database, we learned the year the applicant entered the organization. Finally, we gathered information on the panel members’ skills profiles from the organization’s expertise location system, on which all staff are encouraged to declare their expertise on their internal online profiles and keep them up to date.
We complemented our quantitative data with some qualitative insights. One of the research team attended a selection meeting, during which the panel evaluated 22 applications. We conducted 29 interviews: 21 with applicants (both successful and unsuccessful); 4 with members of the panel, including the director of the R&D department; and 4 with members of four other panels. The interviews were semistructured, and each lasted between 30 minutes and one hour. We asked the interviewees to describe the application process, the selection process, the criteria used to allocate funding, and the sources of disagreement among panel members.
Dependent Variable
A project application can be rejected, fully funded, or partially funded. Our dependent variable therefore measures the share of requested funding awarded. The variable equals zero if the application is rejected and one if the application is fully funded. In our sample of 588 proposals, 28.7% are rejected and 37.8% are fully funded. To assess the robustness of our results, we also tested the impact of a prior positive funding decision on the likelihood that a proposal is funded, a dummy variable equal to one if the application received any funding and zero otherwise.
Independent Variables
Prior Funding Decision
Our main independent variable captures the funding decision made before the focal decision. We can measure the outcome of a prior funding decision either as a dichotomous variable—whether the prior proposal received funding (prior proposal funded)—or as a continuous variable—the amount of funding awarded to the previous application (prior funding awarded). Because of the high skewness of the last variable, we log-transformed it to reduce the impact of outliers on our results. To derive these variables, we used the order in which projects appear in the secretary’s booklet. If a decision regarding a project application was postponed, we consider this to be a decision not to fund. Because postponing a project is often a difficult decision that takes as much time and mental energy as rejecting a project, we wanted to ensure that this was captured in our prior-funding-decision variable.
Timing
To test Hypothesis 2, we measured timing by a variable (order of assessment) capturing the order in which the project was assessed during the panel meeting. The number of proposals in each meeting varies greatly because the panel receives more applications in the first call of each financial year, so we used the log-transformed version of this variable to reduce the impact of outliers.
Control Variables
To exclude alternative explanations that could drive the funding decision, we include control variables at the level of (a) the R&D portfolio, (b) the panel, (c) the proposal, and (d) the applicant.
R&D Portfolio Level
First, because the annual R&D budget could constrain a funding decision, we control for the budget left prior to each meeting (funding left prior to each meeting).
Second, although our case study organization did not use any formal R&D portfolio tools, it is likely that panel members are quite aware of the portfolio when making funding decisions. They might compare the content of each project proposal to what they have already funded in that meeting. We therefore derived a measure of similarity between a focal project and all the proposals previously evaluated in the same meeting (R&D portfolio similarity), using well-established methods of information retrieval. We convert each application to lowercase; remove punctuation, white spaces, and nonalphabetical characters; and remove “stop words” such as “if,” which have little informational value. We also stemmed the text to its root form to allow comparisons between seemingly similar words. Each application is then converted into a “bag of words” or a vector of words agnostic for the order of words. We also weighted the occurrences of words by using inverse-document term frequency (Martin and Jurafsky 2009), which allows for two applications to be more similar to the extent that they use rare words. We then derived the average similarity between the focal project and all the funded projects that had already been evaluated in the focal meeting.
Third, to enable all domain areas to gain access to the available funding, the panel decided to set aside a portion of the budget for certain disciplines. We account for this by including the variable domain without preallocated funding, which is one if an application belongs to an engineering domain for which the company did not set money aside and zero otherwise. Although this variable should account for the tendency of panel members to unconsciously follow a quota model in their funding allocation amongst the proposals in a given domain area, we include an additional variable, proposals in same domain area, which more directly controls for the number of other proposals in the same domain as the focal proposal that were eventually assessed in the same panel meeting.
Panel Level
We control for the number of postponed proposals in each meeting because such a decision might be controversial and impose additional cognitive burden on the selectors. Although we exclude the first project of each meeting from our sample because prior proposal funded would be undefined, we need to control for some potential anchoring effects; that is, the pattern of decision making in a meeting could be strongly influenced by the first project considered. To this end, we include a dummy variable (first proposal large) that equals one if the first application in a meeting requested a large amount of funding, that is the requested funding is equal to or greater than the 75th percentile of the distribution of funding requested in our entire sample and is zero otherwise.
Proposal Level
One aim of the panel is to ensure that their funding decisions align with the organization’s R&D roadmap. To capture this driver, we extracted from the R&D roadmap a list of 239 keywords (single words, pairs, and triplets) that identify strategic areas for the company. We then checked whether these keywords appeared in a given application and constructed a dummy variable (alignment with R&D strategy) equal to one if an application included at least one of these keywords and zero otherwise. Within the R&D database, projects are classified into two categories: investment and operational projects. The former aim at developing new capabilities or tools that help engineers perform better and more quickly, whereas the latter mostly aim to support extrarole activities, such as attending conferences and organizing internal events to showcase the use of a given tool. Because evaluating the potential benefits of investment projects might require more attention, time, and effort of the selectors, we include a dummy variable (investment proposal) equal to one if an application refers to an investment project and zero otherwise. We expect investment proposals to receive a smaller fraction of the requested funding.
Applicants do not always manage to carve out time from their external consulting jobs to carry out funded projects and may therefore need to submit another project proposal in order to complete the project during the subsequent financial year. Because almost all resubmitted proposals are funded and the decisions regarding their approval are mostly an administrative formality, we include a dummy variable that equals one if a project is a resubmitted proposal and zero otherwise.
Once an application form is filled in and made available on the R&D management system, anybody in the organization can comment on it. Positive comments, especially from senior people, might influence the panel’s decision making, as might negative comments questioning the project’s value. To identify whether a comment is supportive or unfavorable, two of us independently coded the content of the comments. A third author reviewed the discrepancies between the two coders and resolved them. Of the 588 projects in our sample, 387 received no comments and the remainder received 325 comments, of which 310 were positive and 15 were negative. We use this information to build two variables, endorsement and opposition, which measure the number of characters in all positive and all negative comments, respectively, received by a proposal. Because both variables are skewed, we include in our models the log-transformed version of them.
The amount of funding awarded to a project might also depend on the amount of detail provided in the proposal, so we control for the length of a proposal (length of proposal), measured as the number of characters in the body of the application. Both the proposal duration, measured in months, and the proposal size, expressed in the log-transformed amount of funding requested, can negatively affect the share of funding awarded because longer and more costly projects reduce the R&D budget and are perceived as riskier. We control more directly for risk by coding the text in the application that describes potential risks in delivering the project, for example, challenges in acquiring and processing relevant data, complexity in modelling a particular process, or the uncertainty of setting up an external collaboration or of securing the involvement of key inhouse experts. The resulting variable (risky proposal) was coded one if the applicant identified some delivery risk and zero otherwise.
Applicant Level
R&D projects allow all employees—but especially recent hires—to set aside time to develop their skills and deepen their knowledge of specific areas. We thus include a variable, applicant tenure, which is the applicant’s number of years in the organization. Applicant research experience is the logarithm of the sum of all R&D funding that the applicant had received from any of the eight panels up to the year preceding the focal application.
We also need to control for unobserved heterogeneity of the composition of the four panels in our sample period. One option would be to include panel fixed effects. However, this would lead to a negative correlation between any two funding decisions by the same panel and therefore cause a negative bias to the estimate of prior proposal funded. We therefore follow the approach used by Chen et al. (2016) and include the average funding rate of a given panel in all meetings excluding the focal meeting. This leave-out mean thus controls for the panel’s tendency to fund projects and avoids an upward bias in the estimate of prior proposal funded because the previous and current decisions are both positively correlated with that tendency.2 Finally, to control for changes in funding decisions across time, we include year fixed effects. Table 1 reports the main descriptive statistics and the pairwise correlations of our variables.
Testing for Random Ordering and Serial Autocorrelation in the Quality of the Applications
A key assumption of our study is that the order of the proposals is indeed random. To test for the random nature of the sorting procedure described above, we performed nonparametric tests for random ordering following the approach proposed by Bindler and Hjalmarsson (2019). These tests allow us to compare the runs in the actual sequence of projects in each meeting with runs obtained by randomly reshuffling the same number of projects. Runs in this context are streaks in a sequence of events. For example, if there are 10 projects in a meeting, 5 of which are aligned with the R&D strategy (A) and 5 not aligned (N), and the panel assesses these projects by first considering all the aligned projects and then all the nonaligned projects (AAAAANNNNN), this sequence has two runs. But if the panel makes decisions based on the order AANANAANAA, this sequence has seven runs. For each meeting, we simulated a random order of the projects 10,000 times and obtained a probability distribution of the number of possible runs. Then we compare the probability of observing in our data the same or a lower number of runs than in the simulated distribution. If the order of projects with certain characteristics—say, alignment with R&D strategy—is random, we would expect the distribution of the p-values of these tests in a histogram to be as close as possible to a uniform distribution. A peak at zero would indicate that all the aligned projects are ordered first, whereas a peak at one would indicate that aligned and nonaligned projects alternate. In both instances, the presence of peaks would suggest that the sequence is not random; the projects were either intentionally sorted based on their alignment with the R&D strategy or intentionally mixed based on the same characteristic. A peak at one, however, can result from the presence of only a very few aligned projects in a meeting and should not be interpreted as the consequence of nonrandom ordering. We therefore excluded two meeting days (with 20 applications).
We performed these nonparametric tests using the variables that vary from project to project within a meeting and that have a statistically significant impact on the dependent variable based on Model 1 in Table 2 (alignment with R&D strategy, resubmitted proposal, endorsement, length of proposal, and proposal size). Before running these tests, we transformed the length of the proposal and the endorsement variables into dichotomous variables using a mean split. For the proposal size, we derived a dummy variable equal to one if the amount of funding requested by the applicant is above the 75th percentile of the distribution of funding requested in a meeting. We visualized these tests’ p-values in histograms. Overall, the histograms look uniformly distributed, considering that some of the peaks are driven by the small number of projects with a given characteristic (for example, some meetings considered only one resubmitted project or one endorsed project). This supports our assumption that the projects are randomly ordered.
|

Table 1. Descriptive Statistics and Pairwise Correlations (N = 588)
| Variable | Mean | S.D. | Min | Max | 1 | 2 | 3 | 4 | 5 | 6 | 7 | 8 | 9 | 10 | 11 | 12 | 13 | 14 | 15 | 16 | 17 | 18 | 19 | |
|---|---|---|---|---|---|---|---|---|---|---|---|---|---|---|---|---|---|---|---|---|---|---|---|---|
| 1 | Share of requested funding awarded | 0.55 | 0.42 | 0 | 1 | |||||||||||||||||||
| 2 | Prior proposal funded | 0.59 | 0.49 | 0 | 1 | −0.07 | ||||||||||||||||||
| 3 | Order of assessment | 3.14 | 0.9 | 0.69 | 4.5 | 0.02 | 0.05 | |||||||||||||||||
| 4 | Funding left prior to each meeting | 3.91 | 3.79 | −2.27 | 11 | 0.17 | −0.05 | 0.07 | ||||||||||||||||
| 5 | R&D portfolio similarity | 0.17 | 0.05 | 0 | 0.36 | 0.02 | 0.22 | 0.15 | −0.08 | |||||||||||||||
| 6 | Domain without preallocated funding | 0.26 | 0.44 | 0 | 1 | 0.05 | 0.07 | 0.00 | 0.00 | 0.07 | ||||||||||||||
| 7 | Proposals in same domain area | 4.69 | 5.6 | 0 | 20 | −0.12 | −0.14 | 0.02 | 0.22 | −0.06 | −0.30 | |||||||||||||
| 8 | Number of postponed proposals | 1.68 | 2.49 | 0 | 8 | 0.05 | 0.03 | 0.24 | 0.28 | −0.12 | 0.00 | 0.10 | ||||||||||||
| 9 | First proposal large | 0.26 | 0.44 | 0 | 1 | −0.04 | 0.00 | −0.06 | 0.07 | 0.18 | 0.08 | 0.15 | −0.40 | |||||||||||
| 10 | Alignment with R&D strategy | 0.44 | 0.5 | 0 | 1 | 0.09 | 0.04 | 0.02 | −0.07 | 0.14 | 0.14 | −0.17 | 0.02 | −0.02 | ||||||||||
| 11 | Investment proposal | 0.78 | 0.42 | 0 | 1 | −0.08 | 0.03 | 0.00 | −0.14 | 0.14 | 0.12 | −0.23 | −0.03 | 0.02 | 0.16 | |||||||||
| 12 | Resubmitted proposal | 0.16 | 0.37 | 0 | 1 | 0.20 | 0.06 | 0.00 | 0.27 | 0.03 | −0.03 | 0.04 | 0.05 | 0.06 | 0.04 | −0.12 | ||||||||
| 13 | Endorsement (log) | 1.95 | 2.77 | 0 | 7.7 | 0.06 | 0.10 | −0.06 | −0.12 | 0.12 | 0.04 | −0.12 | −0.08 | 0.01 | 0.05 | −0.03 | 0.03 | |||||||
| 14 | Opposition (log) | 0.16 | 0.98 | 0 | 7.68 | −0.05 | 0.03 | −0.05 | −0.10 | 0.00 | 0.10 | −0.05 | 0.00 | 0.03 | 0.08 | 0.04 | −0.02 | 0.00 | ||||||
| 15 | Length of proposal | 2.99 | 1.8 | 0.33 | 12.72 | 0.03 | 0.08 | 0.13 | −0.02 | 0.37 | 0.19 | −0.25 | −0.05 | 0.02 | 0.32 | 0.22 | 0.13 | 0.08 | 0.06 | |||||
| 16 | Project duration | 219.3 | 125.3 | 0 | 811 | 0.01 | −0.05 | 0.02 | 0.21 | −0.04 | −0.10 | 0.15 | 0.07 | −0.02 | −0.06 | −0.08 | 0.11 | 0.01 | −0.03 | −0.06 | ||||
| 17 | Proposal size | 9.16 | 0.82 | 6.11 | 11.46 | −0.34 | 0.04 | 0.10 | −0.01 | 0.15 | 0.07 | −0.16 | 0.00 | −0.01 | 0.02 | 0.15 | 0.03 | 0.05 | 0.07 | 0.29 | 0.13 | |||
| 18 | Risky proposal | 0.59 | 0.49 | 0 | 1 | −0.07 | −0.02 | −0.02 | −0.06 | 0.02 | 0.10 | −0.16 | −0.05 | 0.08 | 0.06 | 0.11 | −0.05 | 0.06 | 0.00 | 0.13 | −0.01 | 0.07 | ||
| 19 | Applicant tenure | 8.8 | 8.47 | 0 | 36 | 0.05 | 0.07 | 0.01 | 0.05 | −0.05 | −0.22 | 0.09 | 0.15 | −0.02 | −0.18 | −0.20 | 0.17 | 0.08 | −0.03 | −0.21 | 0.12 | 0.08 | −0.09 | |
| 20 | Applicant research experience (log) | 1.01 | 2.85 | 0 | 10.6 | 0.05 | 0.02 | 0.08 | 0.11 | −0.01 | 0.02 | −0.02 | 0.10 | −0.02 | −0.04 | 0.05 | 0.12 | 0.04 | −0.02 | −0.08 | 0.12 | 0.08 | −0.04 | 0.12 |
Notes. Correlations greater than |0.4| are significant at 5%. S.D., standard deviation.
We further need to exclude that there is serial autocorrelation in the quality of the projects, as this could also explain our results. To test for the presence of a negative autocorrelation in quality, we follow Chen et al. (2016) and derive a proxy for a project’s quality by estimating a logit model predicting the probability that the project is funded, using as controls only those variables that capture features of the project or the applicant. We normalized the predictions from this first-stage model by the average quality of projects evaluated in a meeting. Finally, we regress this measure of project quality against prior proposal funded and cluster the errors by panel and introducer. The coefficient for this variable is positive and statistically significant (β = 0.032, p = 0.011), which indicates that project quality is positively, rather than negatively, autocorrelated.
Estimation Procedure
We test our hypotheses using a Tobit model, which is appropriate when the dependent variable is continuous but bounded—in our case, between zero and one. We cluster the errors by each panel and introducer, which allows for dependence of funding decisions made on multiple projects by the same panel and introducer. We use a logit model to test the effect on our alternative dependent variable, proposal is funded, which is a dummy variable.
|
Table 2. Regression Models Predicting Funding Decision
| Controls | Hypothesis 1 | Hypothesis 1 alternative dependent variable | Hypothesis 1 alternative independent variable | Hypothesis 2 | Hypothesis 2 alternative dependent variable | Hypothesis 2 alternative independent variable | |
|---|---|---|---|---|---|---|---|
| Tobit 1 | Tobit 2 | Logit 3 | Tobit 4 | Tobit 5 | Logit 6 | Tobit 7 | |
| R&D portfolio level controls | |||||||
| Funding left prior to | 0.051** | 0.051** | 0.028 | 0.052** | 0.051** | 0.03 | 0.053*** |
| each meeting | (0.02) | (0.02) | (0.03) | (0.02) | (0.02) | (0.03) | (0.02) |
| R&D portfolio | 0.513 | 1.124 | 0.852 | 1.116 | 0.078 | −0.793 | 0.148 |
| similarity | (1.15) | (1.12) | (2.87) | (1.12) | (0.91) | (2.35) | (0.94) |
| Domain without preallocated funding | 0.082 | 0.092 | 0.3 | 0.093 | 0.106 | 0.332 | 0.109 |
| (0.13) | (0.14) | (0.41) | (0.14) | (0.14) | (0.41) | (0.14) | |
| Proposals in same | −0.047*** | −0.051*** | −0.075*** | −0.051*** | −0.049*** | −0.074*** | −0.049*** |
| domain area | (0.01) | (0.01) | (0.02) | (0.01) | (0.01) | (0.02) | (0.01) |
| Panel level controls | |||||||
| Number of postponed | −0.019 | −0.017 | 0.067 | −0.017 | −0.016 | 0.068 | −0.017 |
| proposals | (0.03) | (0.03) | (0.06) | (0.03) | (0.03) | (0.06) | (0.03) |
| First proposal large | −0.122 | −0.123 | 0.18 | −0.132 | −0.115 | 0.203 | −0.133 |
| (0.14) | (0.14) | (0.25) | (0.14) | (0.14) | (0.25) | (0.14) | |
| Alignment with | 0.146** | 0.145*** | 0.390*** | 0.135** | 0.161*** | 0.421*** | 0.142*** |
| R&D strategy | (0.06) | (0.05) | (0.15) | (0.05) | (0.05) | (0.15) | (0.05) |
| Proposal level controls | |||||||
| Investment proposal | −0.129 | −0.137 | −0.452 | −0.136 | −0.118 | −0.41 | −0.119 |
| (0.13) | (0.13) | (0.38) | (0.13) | (0.13) | (0.38) | (0.13) | |
| Resubmitted | 0.428*** | 0.451*** | 1.980*** | 0.449*** | 0.460*** | 2.029*** | 0.457*** |
| proposal | (0.14) | (0.14) | (0.50) | (0.14) | (0.14) | (0.48) | (0.13) |
| Endorsement (log) | 0.026** | 0.028** | 0.027 | 0.028** | 0.031** | 0.031 | 0.031** |
| (0.01) | (0.01) | (0.04) | (0.01) | (0.01) | (0.04) | (0.01) | |
| Opposition (log) | −0.038 | −0.033 | −0.106 | −0.034 | −0.028 | −0.108 | −0.03 |
| (0.04) | (0.04) | (0.11) | (0.04) | (0.05) | (0.11) | (0.04) | |
| Length of proposal | 0.053* | 0.050* | 0.159* | 0.052* | 0.062** | 0.180** | 0.064** |
| (0.03) | (0.03) | (0.08) | (0.03) | (0.03) | (0.08) | (0.03) | |
| Project duration | 0.000 | 0.000 | 0.000 | 0.000 | 0.000 | 0.000 | 0.000 |
| (0.00) | (0.00) | (0.00) | (0.00) | (0.00) | (0.00) | (0.00) | |
| Proposal size | −0.601*** | −0.607*** | −0.571*** | −0.609*** | −0.596*** | −0.564*** | −0.601*** |
| (0.10) | (0.10) | (0.17) | (0.10) | (0.10) | (0.18) | (0.10) | |
| Risky proposal | −0.163 | −0.170* | −0.336* | −0.169* | −0.152* | −0.309* | −0.152* |
| (0.10) | (0.10) | (0.18) | (0.10) | (0.09) | (0.17) | (0.09) | |
| Applicant level controls | |||||||
| Applicant tenure | 0.009 | 0.01 | 0.01 | 0.01 | 0.011 | 0.01 | 0.011 |
| (0.01) | (0.01) | (0.01) | (0.01) | (0.01) | (0.01) | (0.01) | |
| Applicant research experience (log) | 0.015 | 0.015 | 0.06 | 0.016 | 0.012 | 0.052 | 0.013 |
| (0.02) | (0.02) | (0.05) | (0.02) | (0.02) | (0.05) | (0.02) | |
| Order of | 0.071 | 0.076 | 0.158 | 0.072 | 0.295** | 0.523** | 0.270** |
| assessment (log) | (0.05) | (0.06) | (0.12) | (0.06) | (0.12) | (0.25) | (0.12) |
| Independent variables | |||||||
| Hypothesis 1: Prior | −0.303** | −0.451* | 0.750* | 1.282 | |||
| proposal funded | (0.12) | (0.25) | (0.42) | (1.02) | |||
| Hypothesis 1: Prior | −0.033** | 0.077* | |||||
| funding awarded | (0.01) | (0.05) | |||||
| Hypothesis 2: Prior proposal funded × Order of assessment | −0.330** | −0.552* | |||||
| (log) | (0.13) | (0.29) | |||||
| Hypothesis 2: Prior funding awarded × Order of assessmen (log) | −0.034** | ||||||
| (0.01) | |||||||
| Constant | 5.451*** | 5.574*** | 5.081*** | 5.585*** | 4.839*** | 3.942** | 4.914*** |
| (0.97) | (0.99) | (1.68) | (0.99) | (0.91) | (1.78) | (0.92) | |
| σ | 0.929*** | 0.917*** | 0.919*** | 0.907*** | 0.910*** | ||
| (0.12) | (0.12) | (0.12) | (0.12) | (0.12) | |||
| Observations | 588 | 588 | 588 | 588 | 588 | 588 | 588 |
| Log-likelihood | −557.868 | −552.619 | −299.572 | −553.07 | −547.746 | −297.173 | −548.882 |
| Log-likelihood ratio test (degrees of freedom) | 10.498(1)*** | 9.745(1)*** | 4.799(1)** | 8.376(1)*** | |||
Notes. All models include fixed effects for financial years and leave-out mean. Standard errors are clustered by panel and introducer. Log-likelihood ratio test compares Model 2 to Model 1, Model 5 to Model 2, Model 6 to Model 3, and Model 7 to Model 4.
*p < 0.10; **p < 0.05; ***p < 0.01.
Results
Table 2 presents our main results. Model 1 is our baseline model, which includes control variables only. In Model 2, we introduce our main independent variable, prior proposal funded. In line with our prediction, the coefficient is significant and negative (β=−0.303,p<0.05), suggesting that a positive funding decision has a negative effect on the funding outcome for a subsequent project. Our coefficient estimates indicate that if a proposal is assessed after a positive funding decision, the predictive share of funding request awarded for those applications that are funded decreases by 23%.3 We assess the robustness of our results for the first hypothesis by using proposal is funded as an alternative dependent variable. As shown in Model 3, we find that a prior positive funding decision reduces the share of funding for the subsequent project. In Model 4, we include an alternative specification for our independent variable. The coefficient for the variable prior funding awarded is significant and negative (β = −0.033, p < 0.05).
Following Bhargava and Fisman (2014), we further corroborated our results by performing a placebo test. We created 10,000 simulated datasets in which, for each meeting, the projects are randomly reordered. For each simulated data set, we derived prior proposal funded and re-estimated 10,000 times Model 3 in Table 2. We then rank-ordered the 10,000 coefficient estimates from the simulated datasets and located the original coefficient estimate from the real data set within this distribution. This allows us to derive a p-value of the null hypothesis that the decision to fund a project preceding the focal one has no impact on the focal funding decision. As illustrated in Figure 1, we found that the original coefficient estimate from the real data lies inside the fifth percentile of the kernel density distribution of the coefficient estimates from the simulated data. This shows that the original coefficient estimate is statistically significantly larger in absolute value than those obtained using the randomly ordered datasets (p < 0.05), which further supports Hypothesis 1.
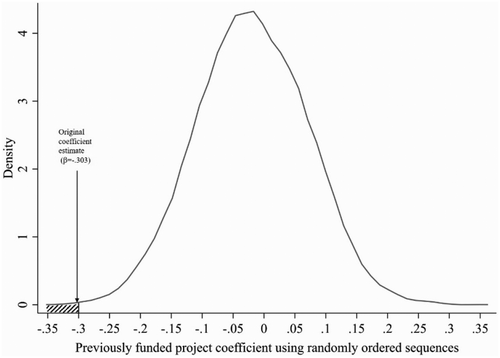
Notes. The figure illustrates the results from our placebo test. It shows the distribution of the prior proposal funded coefficient estimates obtained by estimating the same model specification as in Model 3 in Table 2 but using 10,000 simulated data sets in which the order of the proposals has been randomly reshuffled. The original coefficient estimate of prior proposal funded derived from the real order of the projects (β = −0.303), shown in Model 3 in Table 2, lies in the shaded area, which indicates the 5th percentile of the distribution.
Testing for the Moderating Effect of Timing
We report the findings of our moderation hypothesis in columns 5–7 in Table 2. We predict in Hypothesis 2 that the negative effect of a positive prior funding decision is stronger when projects are evaluated later in the panel deliberations. The negative and significant effect of the interaction term between prior proposal funded and the timing variable in Model 5 (β=−0.330, p<0.05) supports Hypothesis 2. The sequence effect is stronger later in the meeting when the panel is more fatigued. These findings demonstrate that when group members are under mental strain due to the length of the deliberations, sequence effects are stronger. Specifically, we found that the share of funding awarded when a proposal is evaluated after a positive funding decision and toward the end of a meeting will decrease by 55%.4 We also find evidence for a negative and significant interaction in a robustness test with the alternative dependent variable proposal is funded, as shown in column 6 of Table 2 (β = −0.552, p < 0.10) and in one with our alternative specification of the independent variable, as reported in column 7 in Table 2 (β = −0.034, p < 0.05).
Exploring Different Explanations for Sequence Effects
Table 3 reports the results of several tests to identify which of the four explanations is driving the sequence effect in our data. Although we do not report the coefficient estimates of control variables in Table 3, all models, apart from Models 5 and 8, include the same control variables as the specification shown in Model 1 in Table 2, together with fixed effects for financial year and a leave-out mean. In Model 5, we include all control variables except funding left prior to each meeting, as this variable is highly correlated with funding left prior to each decision. Model 8 has only control variables at the R&D portfolio and panel levels, as the control variables at the applicant and proposal levels are used to predict proposal quality.
|
Table 3. Tobit model predicting share of requested funding awarded: Testing alternative explanations
| Law of small numbers | Contrast effect | Quota model | Learning | |||||||||
|---|---|---|---|---|---|---|---|---|---|---|---|---|
| Independent variables | 1 | 2 | 3 | 4 | 5a | 6 | 7 | 8b | ||||
| Prior proposal funded | −0.319*** | −0.340** | −0.319*** | −0.293** | −0.297** | −0.360*** | −0.254** | |||||
| (0.12) | (0.14) | (0.12) | (0.12) | (0.12) | (0.13) | (0.10) | ||||||
| Both lag-2 and prior proposal funded | −0.436*** | |||||||||||
| (0.13) | ||||||||||||
| Prior proposal quality | 0.652** | |||||||||||
| (0.33) | ||||||||||||
| Prior proposal endorsement | 0.000(0.00) | |||||||||||
| Prior proposal opposition | −0.001*** | |||||||||||
| (0.00) | ||||||||||||
| Funding left prior to each decision | 0.069*** | |||||||||||
| (0.02) | ||||||||||||
| Number of prior large proposals funded | −0.018** | |||||||||||
| (0.01) | ||||||||||||
| Lag-2 proposal funded | −0.169** | |||||||||||
| (0.08) | ||||||||||||
| Lag-3 proposal funded | −0.024 | |||||||||||
| (0.06) | ||||||||||||
| Quality difference between prior proposals and focal one | 2.999*** | |||||||||||
| (0.42) | ||||||||||||
| Constant | 5.772*** | 5.653*** | 5.362*** | 5.582*** | 5.542*** | 5.488*** | 6.181*** | 0.888** | ||||
| (0.99) | (1.02) | (1.12) | (0.98) | (0.98) | (0.99) | (1.15) | (0.45) | |||||
| σ | 0.901*** | 0.893*** | 0.944*** | 0.904*** | 0.910*** | 0.916*** | 0.889*** | 0.986*** | ||||
| (0.12) | (0.12) | (0.12) | (0.12) | (0.12) | (0.12) | (0.11) | (0.13) | |||||
| Observations | 575 | 575 | 576 | 588 | 588 | 588 | 560 | 588 | ||||
| Log-likelihood | −533.709 | −528.922 | −539.345 | −546.655 | −549.128 | −551.997 | −511.915 | −581.435 | ||||
Notes. All models (apart from the exceptions mentioned in notes (a) and (b) include all control variables at the R&D-portfolio, panel, proposal, and applicant levels as well as fixed effects for financial years and leave-out mean. Standard errors are clustered by panel and introducer.
a This model does not include funding left prior to each meeting, as it is highly correlated with funding left prior to each decision.
b This model only includes control variables at the R&D-portfolio and panel levels, as the control variables at the applicant and proposal levels are used to predict proposal quality.
*p < 0.10; **p < 0.05; ***p < 0.01.
Law of Small Numbers
We first test whether our results are consistent with the law of small numbers. If so, the negative impact should be stronger after a longer sequence of positive funding decisions. We thus added to Model 2 in Table 3 a dummy variable equal to one if both lag-1 and lag-2 projects have been funded (both lag-2 and prior proposals funded) and compare its coefficient estimate with that of prior proposal funded in Model 1.5 We find that the coefficient for both lag-2 and prior proposals funded is negative and statistically significant and adds to explanation beyond prior proposal funded alone (F-test = 2.19, one-side p = 0.069). This indicates that a focal project will be awarded a smaller share of the requested funds if the prior two projects have been funded.
Contrast Effect
The negative autocorrelation between two consecutive decisions could also be driven by a contrast effect. The contrast effect emerges when decision makers evaluate the information they receive not in isolation but by contrasting it with what they have observed previously. In our context, if the previous project was of high quality, then the following one will receive less funding because panel members will compare it with the previous project. Thus, contrast effects are due to perceptual errors (Chen et al. 2016). The bias arising from the law of small numbers, however, is due to expectation errors; that is, seeing a sequence of events leads agents to hold mistaken beliefs about the quality of subsequent events. Thus, if panel members have funded the previous project, they will erroneously expect the focal project to be of low quality (Chen et al. 2016). It is very difficult to distinguish between these explanations when we can observe the outcome of the decision-making process but cannot observe the time before or after seeing the next project when the belief about its quality was created.
To check whether our results are driven by the contrast effect, we followed the procedure proposed by Bhargava and Fisman (2014) and include in Model 3 both a variable, prior proposal quality, that captures the quality of the preceding project in a sequence and proposal- and applicant-level control variables to control for the quality of the focal project. We derived a measure of the quality of the previous project by using the prediction of a logit model estimating the likelihood of a project being funded, using as controls all our proposal- and applicant-level variables. In Model 4, we control for the quality of the previous application by including prior proposal endorsement and prior proposal opposition, measured as the length of positive and negative comments, respectively. The negative effect of prior proposal funded remains significant even after including these additional controls. Interestingly, in Model 3, we find that the quality of the previous project has a positive, rather than negative, effect on the share of funding awarded to the focal project. Although this result goes against the expectations of a contrast effect, it provides some evidence for an assimilation effect. Similarly, in Model 4, we find that although a prior proposal’s endorsement does not affect the share of funds awarded to the focal project, the prior proposal’s opposition has a strong negative effect. This is consistent with prior research on the assimilation effect that shows that knowledge of poor performance appears to influence raters more than knowledge of good performance (Smither et al. 1988).
Quota Model
Our finding of a sequence effect may also be driven by a quota model, in which the panel has an implicit quota for the number of projects they need to fund in a year or a meeting. Even though the company we study does not restrict the number of projects that can be funded in a given quarter or year, funding decisions could still be constrained by the annual R&D budget, which would result in negative autocorrelation, given that a positive prior funding decision reduces the funding still available. Although our main analysis controls for the funding left prior to each meeting, we want to provide additional evidence that this explanation is not driving our findings. We therefore perform additional tests, reported in Table 3 in Models 5–7. First, in Model 5, we control for the remaining budget after each decision in a meeting (funding left prior to each decision) and find that the coefficient for prior proposal funded remains negative and significant.
Second, if one assumes that agents are more likely to remember large disbursements and are subject to a quota, panel members should be sensitive to the number of very large projects they have funded but not to the order in which these investments were made in a given meeting. We defined a large project in relation to the remaining R&D budget; thus, we counted how many projects prior to the focal project have received funding equal to or greater than the 75th percentile of the unallocated R&D budget (number of prior large proposals funded).6 Although this variable is negative and significant in Model 6, the coefficient for prior proposal funded is still negative and significant, suggesting that the panel members are still influenced by their most recent decision.
Third, if the quota model explained our results, we would expect to find that a positive funding decision has an impact on the current decision regardless of whether that positive decision was the previous one or prior to that. We therefore added in Model 7 two dummy variables equal to one if the project in the second (third) previous position in the sequence has been funded (lag-2 proposal funded, lag-3 proposal funded) and tested whether their coefficients were statistically different from and greater than the coefficient of prior proposal funded. Figure 2 presents the coefficient estimates and confidence intervals for these three dummy variables and shows that the sequence effect decays quite sharply as the time between the decision to fund the focal proposal and the decision to fund previous proposals increases. Although the coefficient of lag-2 proposal funded is negative and significant, it is smaller than that for prior proposal funded (F = 2.34, one-side p = 0.063), whereas the coefficient of lag-3 proposal funded is not significant and is smaller than that for prior proposal funded (F = 4.93, one-side p = 0.013). This suggests that panel members are more influenced by the decisions they made more recently than by those made in the more distant past, which is inconsistent with a quota model explanation for our findings.

Notes. The figure shows the coefficient estimates of previously funded variables reported in column 7 in Table 3. The dots show the point estimates; the vertical lines indicate the corresponding 95% confidence intervals; the horizontal dashed line indicates zero.
Finally, one could argue that selectors may be implicitly limiting the number of proposals approved in each engineering domain. Two control variables in our main model account for this. First, we control for the presence of other proposals in the focal project’s domain area (proposals in same domain area). Second, we account for whether the focal project is in a domain for which a specific share of the R&D budget has been preallocated (domain without preallocated funding). Funding decisions related to proposals in these targeted areas may have been driven by the aim of spending the full preallocated quota. Overall, we can conclude that the quota model is not a strong explanation for our findings.
Learning
Our result could also be explained by learning, that is, by panel members updating their beliefs about the quality threshold required to award funding as they evaluate projects over the course of a meeting, which could result in negative autocorrelation in funding decisions. Although our evaluators are highly experienced, we attempt to account for this explanation directly. To this end, we derive the average quality of projects assessed prior to the focal proposal and then, in Model 8, include the difference between the focal project quality and the average quality (quality difference between prior and focal proposal). This variable is positive and significant as predicted from a learning argument; but we still find evidence of a sequence effect, which suggests that it cannot be explained by learning alone.
Testing How an Individual-Level Sequence Effect Passes to the Panel Level
We discussed, in our theory section, three factors that may explain how the sequence effect passes from the individual to the group level, namely, (a) the structure of decision making (Cyert and March 1963, Csaszar and Eggers 2013), (b) the pattern of communications (Simon 1947), and (c) the relationships among group members (Simon 1947). Because panel decisions in our research context are the outcome of a discussion rather than an aggregation based on voting or averaging, we focus, in our post hoc analysis, on the pattern of communication and the relationships among group members.
In the first analysis, we explore the extent to which the pattern of communication allows the sequence effect to move from the individual to the group. Through our observations, we realized that introducers do indeed play the important role described in the theory section and might therefore be a source of the sequence effect. If so, then differences in their workload could translate into differences in the strength of the sequence effect. The idea is that panel members who have to introduce more projects face a higher cognitive burden and are therefore more likely to rely on heuristics—such as focusing on the last few outcomes—as cognitive shortcuts (Tversky and Kahneman 1974, Kahneman et al. 1982) and thus to fall prey to the sequence effect. A heavy workload is liable to lead the introducer to put less time and effort into carefully framing and articulating a given project to the other panel members, resulting in a less-informed deliberation about its merits. This might make the panel more likely to follow the suggestion of the introducer. In line with this reasoning, we find a negative and significant interaction effect between our main independent variable, prior proposal funded, and the workload of the introducer, measured as the log of the number of characters in the applications he or she was responsible for introducing in a meeting. Our coefficient estimate (β = −0.269, p < 0.05) suggests that the share of funding awarded to a proposal assessed after a positive funding decision will decrease by 29% if the application is introduced by a panel member with a heavy workload.
In a second analysis, we explore the extent to which the relationships among group members affect the transmission of the sequence effect from the individual to the group (Simon 1947). Although the panel members in our organization are all at the same level of seniority, they differ in their areas of expertise. We use these differences to explore whether the sequence effect is stronger if the introducer knows more than the other panel members about the application’s engineering domain. In line with our idea, we found that an interaction between prior proposal funded and the difference in proposal expertise between introducer and panel is negative and significant.7 Our coefficients’ estimates (β = −0.037, p < 0.10) indicate that the share of requested funding awarded decreases by 36% when the introducer has greater expertise in the project area than other panel members and the project follows a positive funding decision.
Discussion
Examining random sequences of decisions for R&D projects, we show that groups fall prey to a sequence effect. Across different specifications, we show that a previously funded project reduces the focal project’s likelihood of being funded. After establishing the main effect, we found that the level of attention among panel members shapes the sequence effect; it is stronger when the panel is more fatigued. We further explored potential mechanisms related to the law of small numbers, contrast effects, quota models, and learning effects. Building on Chen et al. (2016), who study individual complex decision making under uncertainty, our findings differ from those using tosses of a coin in that we focus on the previous decision rather than on a streak. In our additional tests, we show that the sequence effect in our setting appears to be driven by the previous two decisions. We further examine how the sequence effect may pass from the individual to the panel. Our findings have important implications for research on innovation and search and on group decision making for R&D. We elaborate on the implications for these literatures below.
Implications for the Literature on Innovation and Search
Building on the seminal insights in the behavioral theory of the firm (Cyert and March 1963), recent research on search has extended the theory’s interest from the generation of new alternatives to the selection of alternatives (Knudsen and Levinthal 2007). By analyzing how a group can be affected by the sequence effect, we complement the insightful models that have clarified how to structure the search for innovation. In organizations, few decisions are made in isolation. Rather, they are pooled so that multiple decisions can be made together, in order to obtain a quorum of appropriate decision makers and to save their time. In the behavioral theory of the firm, decision makers are not rational calculators of probabilities but are affected by time pressure and the number of tasks that they are working on (Cohen and March 1974, Olsen 1976, March and Weissinger-Baylon 1986).
Recent empirical work has also challenged the view that having more options is inherently helpful by suggesting that crowding can lead to information overload (Piezunka and Dahlander 2015, Criscuolo et al. 2017, Frakes and Wasserman 2017). In this paper, we proposed an additional mechanism that can affect the evaluation of projects even when crowding and alternative claims of attention are moderate—namely, the sequence. Drawing on a random sequence, we show that, in group settings, a focal selection decision can be strongly affected by the prior decision. Our estimates indicate that the share of funding awarded to an R&D proposal would decrease by 23% if it happened to be evaluated after a proposal that was funded. Although the idea of negative autocorrelation between decisions in high-stakes field settings has been shown in the context of baseball umpires, credit loans, and asylum judges (Chen et al. 2016), we show that this effect also occurs in organizational contexts in which the decisions have major effects on both individuals and the organization. This implies that theories of search and selection would do well to consider a search process as a series of events rather than as a single independent event that can be maximized after meeting certain decision criteria.
Building on the idea in the behavioral theory of the firm (Simon 1957, Ocasio 2011) and the social psychology literature (Baumeister et al. 1998, Vohs et al. 2008) that attention is finite, we proposed that timing moderates the sequence effect. Panel meetings to allocate funds to R&D projects are often exhausting; our work suggests that the sequence effect is stronger later in the meeting, when the panel is more fatigued. This in turn suggests that seemingly small contingencies involving where a project happens to fall in a sequence can partly affect whether it receives funding. Crowding or alternative claims of attention (Cyert and March 1963, Hansen and Haas 2001, Haas et al. 2015) have been shown to affect whether a project gets attention or funding (Criscuolo et al. 2017). We offer a new insight that sequence effects ought to be considered in tandem and can even occur when crowding is low.
Implications for the Literature on Group Decision Making in R&D
Research has focused on sequence effects in contexts in which decisions are made by individuals rather than by a group (Chen et al. 2016, Hartzmark and Shue 2018). Yet organizations often compose groups to overcome problems that individual decision makers face. Canonically, group selection is designed to encourage more deliberative and reasoned choices. Such collective decision making plays an important social role in organizations by helping affirm shared responsibilities and building legitimacy for the decision itself. We contribute to the literature by analyzing situations characterized by uncertainty and high stakes—such as innovation—on which there is scant research.
As our results suggest, the use of groups will not remove the sequence effect, a finding that echoes previous findings that groups have difficulty upholding meritocratic ideals (Aadland et al. 2019). Our research thus paints a picture of projects that are not evaluated by rational managers exclusively in light of the cold facts but by human beings under time and resource pressure, operating in a cloud of uncertainty. In that sense, the empirical work on microdecisions nicely complements the modelling approach to extend the behavioral theory of the firm (Argote and Greve 2007). These managers are subject to a range of biases and heuristics that lead them to deviate from rational model of decision making. Moreover, by investigating the attentional factors of the panel that shape the sequence effect, we cast more light on when that effect is more salient.
Research on how internal structures affect type I and type II errors for innovation projects has used simulations (Knudsen and Levinthal 2007, Csaszar and Eggers 2013, Reitzig and Maciejovsky 2015). These studies paved the way for how to organize internally using polyarchies and hierarchies (Sah and Stiglitz 1986, Csaszar 2012) and have illuminated the errors that result from these organizational structures. In practice, however, hybrid models between these different ends of the spectrum are common (Csaszar and Eggers 2013). Our work extends this literature by considering how sequence effects play out in such a hybrid model, specifically, a decision-making panel. Although constructed to remove bias and reduce the chance of mistakes, a decision-making panel is still affected by a sequence effect. The goal of an information aggregation perspective taking all viewpoints into consideration to make a purely merit-based decision may not come to pass.
Our findings highlight a sequence effect whereby, in a random sequence, the previous decision affects the current one.8 In the results section, we elaborate on alternative explanations stemming from (a) the law of small numbers, (b) contrast effects, (c) a quota model, and (d) learning. Much of the earlier work has elaborated on one or another of these mechanisms, but our paper shows how they relate to one another. The key finding is that we observe a law of small numbers effect, which is at play alongside an assimilation effect and a learning effect. In addition, this law of small numbers effect is somewhat different from that found in canonical work that considered streaks of events. Our empirical examination shows that, in our context, it is not long streaks but rather the previous decision or the previous two decisions that matter. These findings suggest that several of the four effects mentioned above are not mutually exclusive. This is interesting itself and can be useful for current research on decision making in the context of innovation.
Allocative decisions in organizational settings often involve constraints on finite resources. Our tests directly measure the quota effect of having a lower budget available in the next decision. Controlling for this, we still find a sequence effect.
Implications for Practice
An important managerial implication of our research is that small process changes can make big differences. The problem is, in economic terms, quite significant: if a proposal is assessed after the panel has decided to fund a previous project in the sequence, the panel will award to the focal project 23% less than the requested funds. But changing the process to reduce or ameliorate this effect would be relatively inexpensive. Information aggregation suggests that one aggregates the viewpoints of panel members. Although randomized ordering for decision making can help ensure fairness, it does not overcome biases arising from the decision sequence if all panel members have the same sequence.
A first approach in designing interventions is to know whether there is a problem, which we have tried to establish here. A range of process changes could nudge panels to overcome biases in selection. First, decision makers could be taken through a checklist to raise their awareness of biases, including sequence effects. Such a pretreatment effect has been effective with doctors, pilots, and other professionals (Gawande 2011); it seems equally important for R&D evaluators. Second, evaluators could be asked to evaluate each project independently before deciding as a panel and each evaluator could be exposed to a different random order. It would also seem desirable to ask panel members to share their own written evaluations independently to fully reap the benefits of diversity (Criscuolo et al. 2017), rather than just skimming through the proposals prior to the meeting. Third, the tendency in panel decision making, where there are many choices to be made with limited time and resources, is to “press on through.” But in doing so, panels may be more likely to fall prey to sequence effects. Accordingly, creating time and space for group decision making “resets” may help evaluators break away from the influence of the most recent past decisions and start a new sequence with no sequence effect at work.
Limitations and Avenues for Future Research
This research is limited by several elements of our research design; these, in turn, may inspire future research. First, our case organization does not possess significant information about the outcomes that have arisen from both funded and unfunded R&D projects, and we are therefore unable to demonstrate the financial and material losses that might be associated with sequential group decision making. Other settings with richer information on such outcomes might provide estimates of the economic magnitude of the sequence effect.
Second, because we focus on a single organization, it is hard to generalize to other settings and contexts. However, our ability to find results consistent with those of laboratory-based studies and other unrelated field settings provides a degree of corroboration for our study. Future research in other decision-making environments with high uncertainty—such as venture capital funding, alliances, and hiring—might provide a richer and extended corollary.
Third, our case study organization does not use formal R&D portfolio analysis, nor did it use any complex or quantitative decision-support tools to help guide fund allocation. It may be that the use of such tools combats biases in selection; future research could examine contexts in which such aids are in use to determine what effect (if any) they have on sequence effects.
Fourth, in the study of sequence effects, it remains difficult to separate out, in the empirical analysis, the different theoretical explanations at play. Contrast effects and the law of small numbers are, empirically, nearly indistinguishable. Although we found evidence consistent with some aspects of the law of small numbers, further research with more refined research designs is required to tease out what mechanism is driving the observed behavior.
Fifth, although we control for some characteristics of the applicant, we did not investigate how differences in race, gender, or other disadvantaged group characteristics interact with the sequence effect. Given that research on social evaluations has shown that even organizations that want to promote meritocracy show strong biases against women and minorities (Castilla 2008, Castilla and Benard 2010), this omission in our paper opens up an interesting avenue for investigation. Future research could, for example, explore how the sequence shapes social comparison, potentially increasing or decreasing the bias in organizational decision making toward disadvantaged groups.
For too long, organizational selection has largely been something of a black box, with only the observed outcomes of these choices being investigated. We therefore know relatively little about the paths not taken and on how the decision-making processes and the people involved shape the choices researchers can observe. In this area, we believe there is rich opportunity for researchers to collaborate with organizations to collect field data and conduct experiments on biases in R&D selection, furthering the goal of making management research more engaged with practice (Van de Ven 2007). For example, in our case study organization, our findings spurred a reappraisal of their current decision-making processes. Encouraging organizations to give managerial attention to the microdynamics of selection in R&D could also help them overcome their tendency to focus on what they already know and already can do, enabling them to explore new areas. Indeed, our research suggests that even minor changes in selection could yield significant changes in the outcomes of selection. As organizations become more aware that how they choose shapes what they choose, the potential to enrich and steer organizational selection to the desired ends could be greatly enhanced.
The authors are listed alphabetically and contributed equally. The authors especially acknowledge Gino Cattani for his encouragement, commentary, and excellent guidance throughout the revision process as well as the constructive and insightful feedback from their three reviewers. The authors thank Gianluca Carnabuci, Christoph Grimpe, and Martin Schweinsberg as well as conference and seminar participants at Academy of Management Annual Meeting 2019, DRUID19 conference, École Polytechnique Fédérale de Lausanne, Erasmus University, Liverpool University, SKEMA Business School Sophia Antipolis, and Katholieke Universiteit Leuven for helpful comments. The authors are indebted to their industrial partner for their time and support for this research. The authors have no conflicts of interest with the industrial partner.
1 On average, 20% of our project proposals were postponed. The share per meeting ranged from 0%–42%.
2 To assess the robustness of our results, we also estimated our models with and without panel fixed effects and found results consistent with those reported here.
3 This is the marginal effect of prior proposal funded on the expected value of truncated outcome (E(y|y>0,x)), which in our context is how much share of requested funding a proposal receives if the panel decides to support it. We could derive the effect of our main independent variables on other outcomes (e.g., change in the censored outcome or change in the probability of being zero), but we believe that the change in the truncated outcome is the most relevant here.
4 This is the marginal effect of prior proposal funded on the expected change of the truncated outcome when the moderator variable is set equal to mean plus one standard deviation above the mean.
5 The coefficient estimates of prior proposal funded in Model 1 of Table 3 differs from that reported in Model 3 of Table 2 because the number of observations is different, as we dropped the first two project applications evaluated in each meeting. Dropping the first two observations yields the same sample used in Model 2 of Table 3, which allows us to compare the coefficients.
6 We experimented with different ways of classifying a proposal as “large” by considering (a) the 75th percentile of the distribution of the funds awarded to all projects in our sample and (b) the 75th percentile of the share of funds awarded to a proposal with respect to funds available to invest prior to the start of a given meeting. We obtained consistent results.
7 To derive this variable, we leveraged the employee’s skills descriptions stored in the organization’s expertise location system, from which we derived a list of the 574 most frequent keywords (those with 10 or more occurrences) representing the main expertise of the organization. Based on the co-occurrences of these keywords in the skills descriptions, we computed a cosine similarity matrix, which allows us to capture the degree of similarity between a panel member’s skills profile and a project description, even if the same words are not mentioned in these two texts. Once the cosine between all possible combinations of keywords in the introducer’s and the project’s vectors, on the one hand, and in the other panelists and project vectors, on the other hand, were calculated, we could derive our variable as the difference between them.
8 We are grateful to two anonymous reviewers who pointed this out.
References
- (2019) Friends, favours and cliques: Relational mechanisms of recognition in peer-based tournament rituals. Acad. Management J. 62(3):883–917.Crossref, Google Scholar
- (1988) The System of Professions: An Essay on the Division of Labor (University of Chicago Press, Chicago).Crossref, Google Scholar
- (2000) Collaboration networks, structural holes, and innovation: A longitudinal study. Admin. Sci. Quart. 45(3):425–455.Crossref, Google Scholar
- (2015) Retrospective evaluations of sequences. Experiment. Psych. 62(5):320–334.Crossref, Google Scholar
- (2007) A behavioral theory of the firm—40 years and counting: Introduction and impact. Organ. Sci. 18(3):337–349.Link, Google Scholar
- (2004) Key success factors for technological entrepreneurs’ R&D projects. IEEE Trans. Engrg. Management 51(3):314–321.Crossref, Google Scholar
- (2010) The role of experience in the gambler’s fallacy. J. Behav. Decision Making 23(1):117–129.Crossref, Google Scholar
- (2002) Ego depletion and self-control failure: An energy model of the self’s executive function. Self Identity 1(2):129–136.Crossref, Google Scholar
- (1994) Losing Control: How and Why People Fail at Self-Regulation (Academic Press, San Diego).Google Scholar
- (2007) The strength model of self-control. Current Directions Psych. Sci. 16(6):351–355.Google Scholar
- (1998) Ego depletion: Is the active self a limited resource? J. Personality Soc. Psych. 74(5):1252–1265.Crossref, Google Scholar
- (2017) Network dynamics of social influence in the wisdom of crowds. Proc. Natl. Acad. Sci. USA 114(26):E5070–E5076.Crossref, Google Scholar
- (2016) Balancing on the creative highwire: Forecasting the success of novel ideas in organizations. Admin. Sci. Quart. 61(3):433–468.Crossref, Google Scholar
- (2014) Contrast effects in sequential decisions: Evidence from speed dating. Rev. Econom. Statist. 96(3):444–457.Crossref, Google Scholar
- (2019) Path dependency in jury decision-making. J. Eur. Econom. Assoc. 17(6):1971–2017.Crossref, Google Scholar
- (2006) Advice taking and decision-making: An integrative literature review, and implications for organizational sciences. Organ. Behav. Human Decision Processes 101(2):127–151.Crossref, Google Scholar
- (2016) Looking across and looking beyond the knowledge frontier: Intellectual distance and resource allocation in science. Management Sci. 62(10):2765–2783.Link, Google Scholar
- (2019) Product and innovation portfolio management. Aldag RJ , ed. Oxford Research Encyclopedia: Business and Management (Oxford University Press, Oxford, UK).Crossref, Google Scholar
- (2007) Group decision making under conditions of distributed knowledge: The information asymmetries model. Acad. Management Rev. 32(2):459–479.Crossref, Google Scholar
- (2014) Investors prefer entrepreneurial ventures pitched by attractive men. Proc. Natl. Acad. Sci. USA 111(12):4427–4431.Crossref, Google Scholar
- (2008) Gender, race, and meritocracy in organizational careers. Amer. J. Sociol. 113(6):1479–1526.Crossref, Google Scholar
- (2010) The paradox of meritocracy in organizations. Admin. Sci. Quart. 55(4):543–576.Crossref, Google Scholar
- (2013) The persistent effect of geographic distance in acquisition target selection. Organ. Sci. 24(6):1805–1826.Link, Google Scholar
- (2016) Decision making under the gambler’s fallacy: Evidence from asylum judges, loan officers, and baseball umpires. Quart. J. Econom. 131(3):1181–1242.Crossref, Google Scholar
- (1993) The “gambler’s fallacy” in lottery play. Management Sci. 39(12):1521–1525.Link, Google Scholar
- (1990) Absorptive capacity: A new perspective of learning and innovation. Admin. Sci. Quart. 35(1):128–152.Crossref, Google Scholar
- (1974) Leadership and Ambiguity: The American College President (Harvard Business School Press, Boston).Google Scholar
- (1990) Stage-gate systems: A new tool for managing new products. Bus. Horizons 33(3):44–54.Crossref, Google Scholar
- (1998) Product Leadership: Creating and Launching Superior New Products (Perseus Books, Cambridge, MA).Google Scholar
- (2017) Evaluating novelty: The role of panels in the selection of R&D projects. Acad. Management J. 60(2):433–460.Crossref, Google Scholar
- (2012) Organizational structure as a determinant of performance: Evidence from mutual funds. Strategic Management J. 33(6):611–632.Crossref, Google Scholar
- (2013) Organizational decision making: An information aggregation view. Management Sci. 59(10):2257–2277.Link, Google Scholar
- (1963) A Behavioral Theory of the Firm (Prentice-Hall, Englewood Cliffs, NJ).Google Scholar
- (2006) Olympic medals as fruits of comparison? Assimilation and contrast in sequential performance judgments. J. Experiment. Psych. Appl. 12(3):166–178.Crossref, Google Scholar
- (2011) Extraneous factors in judicial decisions. Proc. Natl. Acad. Sci 108(17):6889–6892.Google Scholar
- (2009) Biased probability judgment: Evidence of incidence and relationship to economic outcomes from a representative sample. J. Econom. Behav. Organ. 72(3):903–915.Crossref, Google Scholar
- (2003) Assessing creativity in Hollywood pitch meetings: Evidence for a dual-process model of creativity judgments. Acad. Management J. 46(3):283–301.Crossref, Google Scholar
- (2018) Overcoming the liability of novelty: The power of framing. Acad. Management Proc. 2018(1):11077–11089.Google Scholar
- (2017) Is the time allocated to review patent applications inducing examiners to grant invalid patents? Evidence from microlevel application data. Rev. Econom. Statist. 99(3):550–563.Crossref, Google Scholar
- (1997) The Economics of Industrial Revolution (Pinter, London).Google Scholar
- (2000) Innovation in project-based, service-enhanced firms: The construction of complex products and systems. Res. Policy 29(7-8):955–972.Crossref, Google Scholar
- (2011) The Checklist Manifesto: How to Get Things Right (Profile Books, London).Google Scholar
- (2018) Why and when hierarchy impacts team effectiveness: A meta-analytic integration. J. Appl. Psych. 103(6):591–613.Crossref, Google Scholar
- (2007) Throwing good money after bad? Political and institutional influences on sequential decision making in the venture capital industry. Admin. Sci. Quart 52(2):248–285.Crossref, Google Scholar
- (2015) Which problems to solve? Online knowledge sharing and attention allocation in organizations. Acad. Management J. 58(3):680–711.Crossref, Google Scholar
- (2001) Competing for attention in knowledge markets: Electronic document dissemination in a management consulting company. Admin. Sci. Quart. 46(1):1–28.Crossref, Google Scholar
- (2018) A tough act to follow: Contrast effects in financial markets. J. Finance 73(4):1567–1613.Crossref, Google Scholar
- (2013) Collective engagement in creative tasks: The role of evaluation in the creative process in groups. Admin. Sci. Quart. 58(3):346–386.Crossref, Google Scholar
- (1995) Interaction with others increases decision confidence but not decision quality: Evidence against information collection views of interactive decision making. Organ. Behav. Human Decision Processes 61(3):305–326.Crossref, Google Scholar
- (1994) Evolutionary trajectories in petroleum firm R&D. Management Sci. 40(12):1720–1747.Link, Google Scholar
- (2000) Knowledge-intensive business services as co-producers of innovation. Internat. J. Innov. Management 4(4):491–528.Crossref, Google Scholar
- (1982) Judgments Under Uncertainty: Heuristics and Biases (Cambridge University Press, Cambridge, UK).Crossref, Google Scholar
- (2010) Directed attention as a common resource for executive functioning and self-regulation. Perspectives on Psychological Science 5(1):43–57.Google Scholar
- (2018) Posting and slotting: How hiring processes shape the quality of hire and compensation in internal labor markets. Admin. Sci. Quart. 63(4):848–878.Crossref, Google Scholar
- (1980) Contrast effects and judgments of physical attractiveness: When beauty becomes a social problem. J. Personality Soc. Psych. 38(1):131.Crossref, Google Scholar
- (2004) Group performance and decision making. Annual Rev. Psych. 55(1):623–655.Crossref, Google Scholar
- (2014) Resource allocation strategy for innovation portfolio management. Strategic Management J. 35(2):246–268.Crossref, Google Scholar
- (2007) Two faces of search: Alternative generation and alternative evaluation. Organ. Sci. 18(1):39–54.Link, Google Scholar
- (2014) The importance of the raw idea in innovation: Testing the sow’s ear hypothesis. J. Marketing Res. 51(1):14–26.Crossref, Google Scholar
- (2009) How Professors Think (Harvard University Press, Cambridge, MA).Crossref, Google Scholar
- (1814) Essai Philosophique sur les Probabilités (Courcier, Paris).Google Scholar
- (2016) Implicit theories of creative ideas: How culture guides creativity assessments. Acad. Management Discoveries 2(4):320–348.Crossref, Google Scholar
- (2019) Pitching novel ideas to the boss: The interactive effects of employees’ idea enactment and influence tactics on creativity assessment and implementation. Acad. Management J. 62(2):579–606.Crossref, Google Scholar
- (2006) Variation in organizational form among professional service organizations. Res. Sociol. Organ. 24(6):171–202.Crossref, Google Scholar
- (1958) Organizations (John Wiley & Sons, New York).Google Scholar
- (1986) Ambiguity and Command: Organizational Perspectives on Military Decision Making (Pitman Publishing, Marshfield, MA).Google Scholar
- (2009) Speech and Language Processing: An Introduction to Natural Language Processing, Computational Linguistics, and Speech Recognition (Pearson Education, New York).Google Scholar
- (1992) Distributive and procedural justice as predictors of satisfaction with personal and organizational outcomes. Acad. Management J. 35(3):626–637.Google Scholar
- (2011) The bias against creativity: Why people desire but reject creative ideas. Psych. Sci. 21(1):13–17.Crossref, Google Scholar
- (2018) Reframing the decision-makers’ dilemma: Toward a social context model of creative idea recognition. Acad. Management J. 61(1):94–110.Crossref, Google Scholar
- (2019) Do expert panelists herd? Evidence from FDA committees. DIW Berlin Discussion Papers (Berlin), 1–56.Crossref, Google Scholar
- (1986) Attention to action. Davidson RJ, Schwartz GE, Shapiro D, eds. Consciousness and Self-Regulation (Springer, Boston), 1–18.Google Scholar
- (2011) Attention to attention. Organ. Sci. 22(5):1286–1296.Link, Google Scholar
- (1976) Reorganization as a garbage can. March JG, Olsen JP, eds. Ambiguity and Choice in Organizations (Universitetsforlaget, Bergen, Norway), 314–317.Google Scholar
- (1976) Contrast effects in judgments of crime severity and the punishment of criminal violators. J. Personality Soc. Psych. 33(4):448–459.Crossref, Google Scholar
- (2015) Distant search, narrow attention: How crowding alters organizations’ filtering of suggestions in crowdsourcing. Acad. Management J. 58(3):856–880.Crossref, Google Scholar
- (1993) The Psychology of Judgment and Decision-Making (Mcgraw-Hill Book Company, New York).Google Scholar
- (1995) Memory for related and unrelated words: Further evidence on the influence of semantic factors in immediate serial recall. Quart. J. Experiment. Psych. Section A 48(2):384–404.Crossref, Google Scholar
- (2002) Inference by believers in the law of small numbers. Quart. J. Econom. 117(3):775–816.Crossref, Google Scholar
- (2010) The gambler’s and hot-hand fallacies: Theory and applications. Rev. Econom. Stud. 77(2):730–778.Crossref, Google Scholar
- (1992) Generation of random series in two-person strictly competitive games. J. Experiment. Psych. General 121(3):352–363.Crossref, Google Scholar
- (1987) A model of hiring decisions in real employment interviews. J. Appl. Psych. 72(4):596–603.Crossref, Google Scholar
- (2015) Corporate hierarchy and vertical information flow inside the firm—A behavioral view. Strategic Management J. 36(13):1979–1999.Crossref, Google Scholar
- (2013) Biases in the selection stage of bottom‐up strategy formulation. Strategic Management J. 34(7):782–799.Crossref, Google Scholar
- (2000) Visionaries, managers, and strategic direction. RAND J. Econom. 31(4):693–716.Crossref, Google Scholar
- (1986) The architecture of economic systems: Hierarchies and polyarchies. Amer. Econom. Rev. 76(4):716–727.Google Scholar
- (2015) Measuring the effectiveness of scientific gatekeeping. Proc. Natl. Acad. Sci. USA 112(2):360–365.Crossref, Google Scholar
- (1947) Administrative Behavior (The Free Press, New York).Google Scholar
- (1957) Models of Man (John Wiley & Sons, New York).Google Scholar
- (2006) Mistake #3: The effect of previously encountered prices on current housing demand. Econom. J. (London) 116(508):175–199.Crossref, Google Scholar
- (1988) Effect of prior performance information on ratings of present performance: Contrast vs. assimilation revisited. J. Appl. Psych. 73(3):487–496.Crossref, Google Scholar
- (1985) Pooling of unshared information in group decision making: Biased information sampling during discussion. J. Personality Soc. Psych. 48(6):1467–1478.Crossref, Google Scholar
- (2016) Predicting lotto numbers: A natural experiment on the gambler’s fallacy and the hot-hand fallacy. J. Eur. Econom. Assoc. 14(3):584–607.Crossref, Google Scholar
- (2016) When does power disparity help or hurt group performance? J. Appl. Psych. 101(3):415–429.Crossref, Google Scholar
- (1994) A test of the gambler’s fallacy: Evidence from pari-mutuel games. J. Risk Uncertainty 8(3):309–317.Crossref, Google Scholar
- (2003) Expert talent and the design of (professional services) firms. Indust. Corporate Change 12(4):895–916.Crossref, Google Scholar
- (1993) Decision errors made by individuals and groups. Castellan NJ, ed. Individual and Group Decision Making: Current Issues (Lawrence Erlbaum Associates, Mahwah, NJ), 109–124.Google Scholar
- (2003) Group decision making. Hogg MA, Cooper J, eds. The SAGE Handbook of Social Psychology (Sage, London), 381–406.Google Scholar
- (2013) Sight over sound in the judgment of music performance. Proc. Natl. Acad. Sci. USA 110(36):14580–14585.Crossref, Google Scholar
- (1971) Belief in the law of small numbers. Psych. Bull. 76(2):105–110.Crossref, Google Scholar
- (1974) Judgment under uncertainty: Heuristics and biases. Science 185(4157):1124–1131.Crossref, Google Scholar
- (2007) Engaged Scholarship: A Guide for Organizational and Social Research (Oxford University Press, Oxford, UK).Crossref, Google Scholar
- (2001) Learning through acquisitions. Acad. Management J. 44(3):457–476.Crossref, Google Scholar
- (2008) Making choices impairs subsequent self-control: a limited-resource account of decision making, self-regulation, and active initiative. J. Personality Soc. Psych. 94(5):883–898.Crossref, Google Scholar
- (2010) What is a professional service firm? Toward a theory and taxonomy of knowledge-intensive firms. Acad. Management Rev. 35(1):155–174.Crossref, Google Scholar
- (2017) Idea generation and the role of feedback: Evidence from field experiments with innovation tournaments. Production Oper. Management 26(1):80–99.Crossref, Google Scholar
Paola Criscuolo is a professor of innovation management at Imperial College Business School. She received her PhD in the economics of innovation and technological change from Maastricht University. Her research interests include R&D project selection, open innovation, and knowledge transfer both within and across firms.
Linus Dahlander is a professor at ESMT Berlin and the holder of the Lufthansa Group Chair in Innovation. He received a PhD from Chalmers University of Technology and was a postdoctoral fellow at Stanford University. His research focuses on networks, communities, and innovation.
Thorsten Grohsjean is an assistant professor at Bocconi University. He received his PhD from Ludwig-Maximilians-Universität in Munich. He explores how individuals and groups overcome the challenges associated with the development of new knowledge, skills, and abilities. He thereby focuses on the selection of new ideas, employee mobility, and problem solving as the main processes through which individuals develop their human capital and firms their knowledge base.
Ammon Salter is a professor of technology and innovation management at the School of Management, University of Bath. He received his DPhil from Science Policy Research Unit, University of Sussex. His research focuses on open and distributed innovation, R&D management, and university-industry collaboration.

