Can Facebook Ads Prevent Malaria? Two Field Experiments in India
Abstract
This study evaluates a nationwide malaria prevention campaign delivered through social media in India using a district-level cluster-randomized controlled trial. We combine two survey samples () with administrative health records to assess effects on offline malaria-related behaviors and health outcomes. In the survey data, average treatment effects on protective behaviors, care-seeking intentions, and self-reported malaria incidence were small and insignificant. Administrative data similarly showed no detectable effect on overall recorded incidence. Post hoc heterogeneity analysis, however, suggests that detectable effects were concentrated among households with higher socioeconomic status (SES) and in urban areas: For higher-SES households, bednet use increased during the campaign and self-reported malaria incidence declined afterward. In administrative records, monthly malaria incidence in urban areas fell by 6.2 cases per million people, a 33% decline relative to the pretreatment rate. By contrast, estimates for lower-SES households and rural areas, which face higher malaria risk, were small and insignificant. In a second individual-level feed experiment () that made ad delivery and exposure more comparable across SES groups, the ads increased bednet use and timely treatment-seeking intentions, with no detectable differences by SES. These patterns are consistent with delivery frictions contributing to the campaign’s limited average impact, highlighting the importance of better targeting and measurement in social media public health campaigns.
History: Catherine Tucker served as the senior editor.
Funding: This research has received funds from the World Bank’s Development Impact Department (DIME) and Facebook’s Campaigns for a Healthier World initiative.
Supplemental Material: The online appendices and data files are available at https://doi.org/10.1287/mksc.2024.0929.
1. Introduction
With more than 60% of the world’s population active on social media (We Are Social 2025), governments and organizations increasingly rely on these platforms in social marketing campaigns to influence individuals’ beliefs, attitudes, and real-world behaviors.1 The effectiveness of such campaigns is typically assessed using online engagement and direct-response metrics—such as likes, clicks, and website visits—as well as “Brand Lift” surveys that capture short-term effects (Shawky et al. 2019, Athey et al. 2023). Although these methods may be appropriate for evaluating commercial outcomes such as purchase intent or sales (Bart et al. 2014, Johnson et al. 2017), they are often inadequate for assessing the longer-term goals of public-interest campaigns, such as those promoting public health, whose objectives depend on sustained changes in offline behavior that cannot be captured through platform metrics alone.
Beyond measuring effectiveness, another challenge is that ad delivery on social media platforms is often optimized for engagement and cost efficiency rather than for the offline outcomes these campaigns are intended to influence. As a result, even effective messages may be shown disproportionately to users who are more likely to engage or are cheaper to reach, rather than to those for whom the intervention would generate the greatest health benefits (Lambrecht and Tucker 2019, Gordon et al. 2021, Sapiezynski et al. 2022). These concerns have become more salient as changes in privacy regulation and platform policies have reduced access to third-party targeting information and made independent evaluation more difficult (Goldfarb and Tucker 2011, Johnson et al. 2020).
This paper studies these measurement and delivery challenges in the context of a nationwide malaria prevention campaign run on Facebook and Instagram in India. Using a district-level cluster-randomized design, original survey data, and administrative health facility records, we estimate the causal effect of assignment to potential campaign exposure on offline behaviors and health outcomes, including bednet use, treatment seeking, and malaria incidence. We then examine whether engagement-based delivery aligned with the campaign’s public health objectives and use a follow-up individual-level experiment to distinguish limits of message delivery from limits of message content.
Malaria is transmitted by the bite of infected mosquitoes and disproportionately affects poor and rural populations (Dev et al. 2004). The campaign, designed by the public health nongovernmental organization (NGO) Malaria No More (MNM), used behaviorally informed messages to raise malaria awareness and promote both preventive behaviors (e.g., sleeping under mosquito nets) and response behaviors (e.g., seeking timely treatment).2 The campaign ran for six months on Meta platforms and was optimized for engagement with the ads and MNM’s pages. Although this strategy generated substantial platform activity—reaching 130 million people, generating 46 million interactions across 22 Indian states, and delivering an average of 3.6 exposures per user at a total cost of US$202,000—it remains unclear whether it translated into changes in offline behavior and health outcomes.
We focus on three high-malaria-incidence states—Uttar Pradesh, Jharkhand, and Chhattisgarh. As part of our formative research, we administered a scoping survey to social media users recruited through Facebook and Instagram ads, offering mobile credit as an incentive. The survey helped us identify 80 districts in which recruitment through social media was feasible within the study budget and provided information on household socioeconomic conditions and malaria-related risk characteristics that we used to balance treatment assignment across districts. We then partnered with the MNM advertising team to implement a cluster-randomized controlled trial in these districts, randomly assigning half to treatment. To preserve external validity, treated districts received the same advertising content and delivery strategy used in the nationwide campaign. Importantly, MNM relied on standard platform targeting based on available sociodemographic characteristics and optimized delivery for engagement.
To measure the effects of the campaign, we recruited 8,253 individuals across the study districts. Specifically, we recruited respondents into a longitudinal sample () to study outcomes during the intervention period and into a cross-sectional sample () to study outcomes one to three months after the campaign ended. Because respondents in treated districts were not necessarily exposed to the ads, our survey-based estimates capture intent-to-treat effects for populations with a social media presence.
In the longitudinal sample, data were collected using an experience-sampling design, with repeated observations approximately every 17 days over the course of the campaign. Across pooled and panel specifications, the estimated effects on bednet use among households owning at least one bednet are positive but imprecisely estimated. For other protective behaviors, as well as for self-reported fever, timely care-seeking, malaria incidence, and malaria testing during the campaign, we find no evidence of detectable average effects. In the cross-sectional sample, which measures outcomes after the campaign ended, the average effects are similarly limited: We do not detect clear changes in self-reported malaria incidence in the full sample, although we do find some evidence of increased bednet retreatment with insecticide among bednet owners.
We next examine, in a post hoc manner, whether the campaign’s effects varied by baseline household socioeconomic status (SES). It is important to clarify that SES is used here to describe heterogeneity in treatment effects and not to isolate any single underlying channel. The index bundles housing choice, access to health facilities, education, caste status, household size, and other correlated characteristics, some observed and others potentially unobserved, that may shape social media use, digital engagement, and responses to health messages. At the same time, SES is negatively associated with baseline malaria incidence in our data, making it a useful summary measure for studying whether the campaign’s effects differed across groups that were ex ante more and less vulnerable to malaria risk. The results suggest that the campaign’s detectable effects were more concentrated among higher-SES households, defined as those above the median of the SES distribution. In particular, during the campaign, bednet use rose by 6.7 percentage points (p.p.) among higher-SES households, corresponding to an 11% increase relative to the control mean, whereas the estimate for lower-SES households is small and statistically insignificant. After the campaign ended, malaria incidence fell by 0.9 p.p. among higher-SES households, a 56% reduction relative to the control mean, whereas the corresponding estimate for lower-SES households is again small and statistically insignificant. For bednet retreatment with insecticide, the estimates point in the same direction, with a statistically significant increase only among higher-SES households.
We complement the survey evidence with administrative health facility data from the Indian Health Management Information System, which provide an objective measure of malaria incidence at the population level. In pooled specifications across all facilities, the estimated effects on malaria incidence are negative but imprecisely estimated. When we disaggregate by facility type, however, a clearer pattern emerges. Over the nine months following the launch of the campaign, monthly malaria incidence in urban health facilities in treated subdistricts declined by 6.2 cases per million people relative to the control group, corresponding to about 33% of the average pretreatment urban incidence rate. By contrast, we do not detect corresponding effects in rural areas. The campaign did not affect the number of malaria tests conducted, although the urban test positivity rate fell by about 2 p.p. A similar urban-rural contrast persists in subdistricts with higher internet penetration, suggesting that internet access alone is unlikely to explain the rural null effects.
Taken together, the survey and administrative evidence point to limited average effects of the campaign. At the same time, post hoc heterogeneity analyses suggest that the campaign’s detectable impacts were more concentrated among relatively advantaged households and in urban areas, whereas we find little evidence of impacts among poorer and rural populations, which face higher malaria risk. This raises a central question: Do these patterns reflect lower effectiveness of the ad content or lower exposure to the campaign? On the one hand, the campaign content may have been less persuasive for poorer and higher-risk populations, reflecting limitations in the identification of relevant personas or in the tailoring of campaign messages. On the other hand, these populations may simply have been less likely to receive the ads—for example, because platform delivery algorithms prioritized users with higher expected engagement (Lambrecht and Tucker 2019, Sapiezynski et al. 2022)—which would instead point to limitations in targeting and delivery.
To shed light on these mechanisms, we rely on two complementary exercises. First, we study postcampaign ad recall, which provides suggestive evidence on differential exposure: If exposure differed systematically across groups, recall would be expected to differ as well. In the endline survey, treated respondents were 3 p.p. more likely to recall the campaign overall, corresponding to a 26% increase relative to the control mean. When we split the sample by SES, recall rises by 4.7 p.p. among higher-SES respondents compared with a statistically insignificant 1 p.p. among lower-SES respondents. We view this evidence as suggestive rather than conclusive because recall is an imperfect proxy for exposure and may also reflect differences in attention or memory.
Second, we implement a small-scale individual-level feed experiment in which assignment to a remarketing campaign was randomized and the campaign reached most treated respondents, making ad delivery and exposure more comparable across SES groups. Between March and April 2021, after the nationwide campaign had ended, we used Meta’s Custom Audience tool to assign respondents to an individual-level remarketing campaign run by MNM on Facebook and Instagram. The campaign lasted two weeks, reached about 90% of the target audience at least once, and delivered an average frequency of 4.9 ads per person. Two weeks later, we administered a follow-up survey (). The campaign increased bednet use by 6.9 p.p. and timely treatment-seeking intentions by 2.5 p.p., with no evidence that these effects differed by SES.
Taken together, our results suggest that the ad content can affect malaria-related behaviors among users reached by the ads, including lower-SES respondents in the individual-level experiment. The limited average effects of the nationwide campaign are therefore more consistent with targeting and delivery frictions than with uniformly low content effectiveness. Under engagement-based delivery, lower-SES, rural, or otherwise higher-risk users may have been less likely or more costly to reach. This could reflect lower social media use, smaller reachable audiences, poorer internet connectivity, or differences between higher-risk users on the platform and higher-risk users in the broader population. Consistent with this interpretation, our district-level analysis shows that recruitment advertising was cheaper in larger and more populous districts and in districts that were more socioeconomically advantaged and had greater mobile phone penetration. Because the recruitment ads were also optimized for engagement-related objectives, much like the nationwide campaign, these cost patterns are informative about likely delivery dynamics. They suggest that engagement- and cost-based delivery tilted exposure toward relatively advantaged populations, although we cannot separately identify the precise source of this differential exposure.
A cost-effectiveness analysis based on administrative data shows that the cost per officially reported malaria case averted ranges from about US$3.40 in urban areas to US$6.50 overall. Because the true number of malaria cases in India is estimated to be substantially higher than the officially reported number (WHO 2021), the cost per estimated case averted could be considerably lower. Overall, our findings suggest that social media campaigns can be cost-effective public health tools, but engagement-maximizing delivery may not direct exposure toward those with the highest expected health gains. More deliberate targeting may therefore be necessary if such campaigns are to reach the populations most in need of the intervention.
At the same time, our evidence offers a more cautious assessment of campaign effectiveness than studies based on immediate postexposure surveys or Brand Lift designs, such as Athey et al. (2023). A likely reason is that we estimate intent-to-treat effects at the population level, rather than effects conditional on ad exposure, and we focus on medium-term off-platform behaviors and health outcomes rather than on short-term shifts in recall, beliefs, or intentions measured immediately after exposure. In that sense, our results suggest that ad recall and immediate postexposure surveys may provide an incomplete picture of the real-world impact of public health campaigns delivered through social media.
The rest of the paper proceeds as follows. Section 2 describes the paper’s contribution to the literature. Section 3 provides background on the campaign and the intervention. Section 4 outlines the study design, and Section 5 describes the data. Section 6 presents the main results, and Section 7 examines the roles of content effectiveness and ad exposure. Section 8 discusses the implications of the findings, Section 9 presents the cost-effectiveness analysis, and Section 10 concludes.
2. Contribution to the Literature
A growing marketing literature studies the effectiveness of display advertising, documenting positive effects on brand and performance outcomes (Goldfarb and Tucker 2011, Lewis and Reiley 2014, Johnson et al. 2017), as well as important inefficiencies and measurement challenges (Gordon et al. 2021, Johnson 2023). We contribute to this literature by studying advertising effects on off-platform, socially relevant outcomes rather than traditional marketing metrics and by developing an empirical design that combines randomized variation in campaign delivery with survey and administrative data to measure medium-term behavioral and health outcomes.
More specifically, the paper relates to recent work on advertising campaigns with public health objectives in both developed and developing country settings. Digital and social media campaigns have been shown to affect alcohol and tobacco use (Thompson et al. 2013, Wang et al. 2021), vaccination attitudes and behavior (Athey et al. 2023, Evans et al. 2023), physical and eating habits (Carins and Rundle-Thiele 2014), and stigma reduction (Shawky et al. 2019). Relative to this literature, our main contribution is to evaluate a social media campaign using off-platform outcomes measured over a longer horizon. Rather than relying on engagement metrics or short-term Brand Lift surveys,3 we track malaria-related outcomes for up to five months following potential exposure. This difference in estimand and measurement horizon yields a more cautious assessment of campaign effectiveness than studies based on immediate postexposure surveys alone.
Our results also contribute to the literature on algorithmic targeting and ad delivery. Consistent with prior work (Lambrecht and Tucker 2019, Sapiezynski et al. 2022), we show that optimizing delivery for engagement can create a tension between platform performance and real-world impact. The combination of postcampaign recall, the individual-level feed experiment, and district-level correlates of ad costs points to targeting and delivery frictions as an important constraint on campaign effectiveness. In particular, our evidence suggests that engagement- and cost-based delivery may tilt exposure toward users and places that are easier and cheaper to reach rather than toward those with the highest expected health gains, although we cannot isolate the exact source of this differential exposure. More broadly, our study also complements field-based evaluations of traditional malaria interventions—such as the subsidized distribution of antimalarials, rapid diagnostic tests, and insecticide-treated bednets (Tarozzi et al. 2014, Cohen et al. 2015)—by showing what social media campaigns can and cannot achieve when the intervention works through information and platform delivery rather than through the direct provision of prevention or treatment tools.
The paper further speaks to the role of data in both targeting and measurement and thus to the broader privacy debate in digital marketing (Acquisti et al. 2016, Tucker et al. 2018). Our design shows how first-party survey data collected from social media users can be used to evaluate campaign effects and to inform targeting while limiting reliance on third-party data (Rao et al. 2020). In that sense, the paper offers practical guidance for the use of marketing analytics in public policy settings (Davis et al. 2021) and for the design of social media campaigns when privacy and measurement constraints make conventional targeting more difficult.
Finally, the paper contributes to a broader literature on marketing for social impact (Chandy et al. 2021), especially in emerging market settings (Narasimhan et al. 2015). Related work studies consumer literacy (Viswanathan et al. 2021), environmental behavior (Zhang et al. 2021, Brecko and Hartmann 2026), gender norms and violence prevention (Donati et al. 2022), managerial and marketing skills (Bulte et al. 2017, Anderson et al. 2018), and social norms as tools for behavior change (Burchell et al. 2013). Our study adds to this literature by showing both the promise and the limits of social media advertising as a tool for public health interventions at scale.
3. Background and Intervention
3.1. Malaria and COVID-19 in India
Malaria is a mosquito-borne disease caused by parasites and transmitted through the bite of infected mosquitoes. As in many other countries, malaria incidence in India has declined substantially over the last two decades: the number of cases per 1,000 population at risk fell from 19.9 in 2000 to 3.2 in 2020 (World Bank 2022). Despite this progress, malaria remains an important public health challenge. An estimated 93% of India’s population lives in areas at risk for malaria (WHO 2018). In 2020, the disease caused about 7,300 deaths and 4.1 million cases, of which only around 186,000 were officially recorded—roughly 1 in every 22 cases (WHO 2021). This large gap likely reflects a combination of under-reporting, asymptomatic infections, limited access to care, and diagnostic constraints. Malaria also disproportionately affects poorer and rural populations (Dev et al. 2004), and each episode is estimated to result in 11 lost days of work or school (Singh et al. 2019).
The malaria prevention campaign ran from August 2020 to January 2021, during the first year of the COVID-19 pandemic. This was a period of major disruption to India’s health system, including reduced availability of routine services such as malaria testing and treatment. Public health guidance to limit movement and avoid healthcare facilities may have further discouraged care-seeking. At the same time, the overall effect of the pandemic on malaria-related service demand is ambiguous. Reduced mobility and fear of infection may have lowered testing, whereas the expansion of COVID-19 testing and the overlap between malaria and COVID-19 symptoms may have increased the perceived value of diagnostic care. More time spent at home may also have increased time spent online, potentially affecting ad exposure and engagement. These countervailing forces may limit the external validity of our findings, but they are unlikely to threaten their internal validity.
3.2. Social Media Use in India
As of December 2020, the average Indian user spent approximately 2.5 hours per day on social media.4 Although platforms such as Instagram and TikTok had become increasingly popular among younger audiences globally, Facebook remained a primary social media channel for young adults in India during our study period. It had 392 million active users, corresponding to 26.7% of the total population. Around 70% of these users were between ages 18 and 34, and another 21% were between 35 and 64. The platform also exhibited a marked gender imbalance, with about 75% of users identifying as male. Facebook Messenger, which we used to administer our surveys, had comparable penetration and demographic patterns. Instagram had 137 million users, 76% of whom were between 18 and 34 years old. TikTok was also widely used in early 2020, but it was banned in India in June of that year and remained inaccessible during the period of our study.
3.3. Ad Campaign and Its Content
The evaluated malaria prevention campaign, titled Bite Ko Mat Lo Lite (“Don’t Take the Bite Lightly”), was a national initiative implemented across 22 high-malaria-incidence states in India, covering 86% of the country’s population. Although our impact evaluation focuses on three states, the campaign content and delivery strategy in those states mirrored the broader national rollout.
The campaign ran on Facebook and Instagram during the monsoon season and the following months, when malaria transmission is typically elevated. It was designed and implemented by MNM, an international nonprofit, with support from Facebook’s Campaigns for a Healthier World initiative, which provided advertising credits, and from Upswell, a social media marketing firm that provided technical assistance. The evaluation team had no role in designing or managing the campaign.
Rather than encouraging costly household investments or collective prevention efforts, the campaign focused on simple actions individuals could take on their own. Its main objectives were to increase consistent bednet use and to encourage early diagnosis and treatment seeking in response to fever. Some ads also mentioned other preventive measures, such as wearing long sleeves or using repellents, but bednet use and prompt care-seeking remained the campaign’s main behavioral targets. These behaviors are central to malaria policy and research, as reflected in WHO and Indian guidance and in a broad literature on insecticide-treated nets and malaria-related behavior change (Lengeler 2004, Cohen and Dupas 2010, Koenker et al. 2014, WHO 2025).5
The campaign content was informed by two complementary frameworks. First, MNM adopted a persona-based segmentation approach, creating six audience personas that varied by age, gender, and urban versus rural location. These personas were developed using focus groups and were used to tailor language, imagery, and tone across ads.6 Second, the campaign drew on standard health-behavior principles, especially the idea that behavior change is more likely when messages increase motivation, make the recommended action seem feasible, and provide clear prompts to act (Fogg 2009). In practice, the ads emphasized the risks posed by malaria, framed prevention and treatment as manageable everyday actions, and used direct calls to action.
3.4. Campaign Delivery and Engagement Optimization
Campaign delivery took place in two phases. In the first phase, from July to November 2020, MNM used Meta Ad Manager to run a single campaign with the explicit objective of maximizing engagement. The campaign was organized into six ad sets, each corresponding to one of the six personas. Within each ad set, MNM initially placed the creatives designed for that persona. Based on early engagement metrics—including clicks, comments, and reactions—lower-performing ads were turned off and budget was reallocated toward higher-performing creatives. During the first weeks of the campaign, this process narrowed the active set of creatives to 22 ads focused on the campaign’s core messages, which together accounted for at least 73% of total spending.7 This streamlining concentrated attention on a small number of behaviors that the campaign sought to make salient.
In the second phase, from December 2020 to January 2021, MNM again ran a campaign with the objective of maximizing engagement. The campaign retained the same six persona-based ad sets, but these were now populated with the top-performing creatives from the first phase rather than only with creatives tailored to each persona. As a result, in this second phase, all target audiences could receive the creatives that had generated the strongest engagement earlier in the rollout.
This delivery strategy is important for interpreting our results. For a public health campaign, optimizing for engagement is an imperfect objective because it can shift delivery toward users who are more likely to click or react online rather than toward those for whom the expected health gains are greatest. In our setting, MNM used broad demographic targeting criteria based on the personas and then relied on Meta’s algorithm to optimize delivery within those groups. As a result, conditional on being in a targeted audience, the intensity—and likely the mix—of ad exposure was shaped by platform-side engagement patterns that were not observed by the research team.
The same delivery strategy was used in the treated districts of our study. Nationwide, this approach generated an average of 3.6 impressions per reached individual, with peaks of about five, and more than 45 million actions, including clicks, likes, and comments. Although we do not observe individual-level exposure to specific creatives,8 our design allows us to estimate the intent-to-treat effect of the campaign as implemented in practice rather than the effect of any specific ad.
4. Study Design
In coordination with the MNM team, we limited the study to three states—Uttar Pradesh, Chhattisgarh, and Jharkhand—where MNM agreed to postpone the launch of the nationwide campaign until late August 2020. These states resembled the other 19 campaign states on key malaria-burden indicators and had sufficiently high social media penetration. All three were high-burden settings with prior bednet distribution and previous MNM operations.
4.1. District Selection and Sample Recruitment
At the time of the intervention, the three study states comprised 126 districts with a combined population of more than 300 million. Based on power calculations and formative research, we selected 80 districts for inclusion in the study. One district was later dropped because of an implementation issue, leaving a final sample of 79 districts (data sources and processing are described in Section 5.2).
To identify the study districts, we first excluded the three state capitals, which were outliers on multiple dimensions. We then focused on the remaining 123 eligible districts and conducted formative research through a scoping survey in July and August 2020. Participants were recruited using Facebook and Instagram ads, because social media users were the population of interest for the study. Because Meta did not allow district-level ad targeting, we used GIS software to draw expanding circles around each district’s main cities, stopping at district boundaries. These geofenced areas defined the targeting zones for the recruitment ads. Respondents were offered mobile phone credit (US$2.60–3.60) and completed the survey through a Facebook Messenger chatbot hosted on a page we created called “Global Insights” (see Figure C.2 in the Online Appendix). The survey collected demographic and socioeconomic information, as well as measures of household malaria incidence over the previous five years and the previous two weeks. We also recorded recruitment advertising costs by district.
The scoping survey was also used to identify districts in which recruitment through social media was feasible within the study budget. In practice, this meant selecting districts with lower advertising costs—measured by cost per thousand impressions (CPM)—and higher ad engagement, as captured by click-through rates (CTR). This screening made it possible to recruit sufficiently large samples in each district, but it also yielded a socioeconomically skewed set of study districts. Relative to excluded districts, included districts had lower CPM, higher CTR, and lower cost per completed survey (Table D.1 in the Online Appendix). They were also more socioeconomically advantaged, with larger populations and greater internet and mobile phone penetration. However, included and excluded districts remain comparable in terms of self-reported recent malaria cases and administrative malaria positivity rates.
Table 1 further examines district-level correlates of recruitment ad costs across included and excluded districts, reporting both bivariate regressions and a joint specification. The bivariate results show that lower recruitment CPM is associated with higher population density, larger population, a lower share of rural population, a higher share of households living in solid dwellings, greater wealth, and higher internet and mobile phone access. In the joint specification, the predictors of lower recruitment CPM that remain significant at the 10% level are larger population, a higher share of households living in solid dwellings, and a higher share of mobile phone ownership. These patterns are informative for interpreting the later campaign results because the recruitment ads, like the nationwide malaria campaign, were delivered through engagement-optimized advertising.
|

Table 1. District-Level Correlates of Recruitment Advertising Costs
| Variable | Cost per mille, USD (mean CPM = 0.949) | ||||||||
|---|---|---|---|---|---|---|---|---|---|
| (1) | (2) | (3) | (4) | (5) | (6) | (7) | (8) | (9) | |
| log(population density) | −0.346*** | ||||||||
| (0.114) | |||||||||
| log(population) | −0.478*** | −0.338** | |||||||
| (0.133) | (0.145) | ||||||||
| log(area) | 0.085 | −0.090 | |||||||
| (0.080) | (0.101) | ||||||||
| Share rural population | 0.945*** | −0.562 | |||||||
| (0.300) | (0.421) | ||||||||
| Share in solid houses | −0.900*** | −0.656** | |||||||
| (0.291) | (0.327) | ||||||||
| Wealth index | −0.192*** | 0.097 | |||||||
| (0.061) | (0.060) | ||||||||
| Share with internet access | −1.845*** | −0.652 | |||||||
| (0.585) | (0.411) | ||||||||
| Share with mobile phone | −5.198*** | −2.847* | |||||||
| (1.702) | (1.603) | ||||||||
| Constant | −1.623** | 1.263*** | 0.848*** | 0.225 | 1.290*** | 0.950*** | 1.847*** | 5.705*** | 4.877*** |
| (0.816) | (0.118) | (0.074) | (0.202) | (0.148) | (0.045) | (0.318) | (1.589) | (1.621) | |
| Observations | 117 | 117 | 117 | 117 | 117 | 117 | 117 | 117 | 117 |
| Adjusted R2 | 0.325 | 0.418 | −0.003 | 0.099 | 0.069 | 0.129 | 0.189 | 0.383 | 0.466 |
Notes. The table reports OLS coefficients from regressions of cost per mille (CPM), collected during the scoping survey, on district characteristics from DHS and UN data (2019–2021). Each observation is a district. The Wealth Index is provided by the DHS and comprises household assets and access to utilities and services. Only districts with complete data on the variables included in each specification are used. Heteroskedasticity-robust standard errors are reported in parentheses.
*; **; ***.
Once the study districts were selected, we conducted additional analysis to refine the sampling strategy and define stratification criteria. Our goal was to ensure meaningful variation in baseline socioeconomic conditions and malaria risk within the selected districts, so that the study could examine both average effects and heterogeneity across different types of connected households.
Table 2 reports pairwise correlations between malaria incidence and household-level characteristics using the sociodemographic data collected during formative research; Table D.2 in the Online Appendix reports the corresponding Ordinary Least Square (OLS) regression estimates. Several characteristics are significantly associated with malaria incidence, including household size, distance to medical facilities, membership in socially disadvantaged castes, and dwelling type.9 To summarize broader household socioeconomic conditions, we construct an index of SES following the standard Demographic and Health Surveys approach to household wealth measurement,10 using principal component analysis (PCA) of baseline household characteristics; column 3 of Table 2 reports the corresponding factor loadings. In line with prior research (Dev et al. 2004), the index is strongly negatively associated with baseline malaria incidence: A one-standard-deviation increase in SES is associated with a 2.2 p.p. lower probability that any household member had malaria in the previous five years and a 0.4 p.p. lower probability of malaria in the previous two weeks.
|
Table 2. Pairwise Correlations Between Malaria Incidence, Household Characteristics, and SES Index
| Variable | (1) | (2) | (3) |
|---|---|---|---|
| Any HH member had malaria in last five years | Any HH member had malaria in last two weeks | SES index: PC1 loadings | |
| Solid house | −0.056*** | −0.036*** | 0.6590 |
| (0.0000) | (0.0016) | ||
| Semisolid house | 0.031*** | 0.004 | −0.5974 |
| (0.0069) | (0.7370) | ||
| Within 60 min to health facility | −0.038*** | −0.032*** | 0.2596 |
| (0.0009) | (0.0049) | ||
| University degree | 0.045*** | −0.001 | 0.1959 |
| (0.0001) | (0.9621) | ||
| Advantaged caste | −0.043*** | −0.027** | 0.1602 |
| (0.0002) | (0.0190) | ||
| Has air conditioning | −0.023** | 0.003 | 0.2661 |
| (0.0423) | (0.7967) | ||
| Household size | 0.048*** | 0.044*** | −0.0810 |
| (0.0000) | (0.0001) | ||
| SES index (PC1 score) | −0.056*** | −0.031*** | |
| (0.0000) | (0.0062) | ||
| Observations | 7,548 | 7,548 |
Notes. Columns (1) and (2) report Pearson correlation coefficients between baseline malaria incidence and SES components (standardized), as well as the SES index (PC1 score). Column (3) reports PCA loadings for the first principal component (PC1) used to construct the SES index. Baseline responses collected from July 23 to August 19, 2020 are included. p-values in parentheses.
*; **; ***.
To implement the stratification in practice, we used dwelling type, which could be measured with a single survey question during recruitment and provided a simple way to identify households that were more likely to be socioeconomically disadvantaged and at higher malaria risk. In our formative data, households living in solid dwellings had lower past and current malaria incidence than households living in non- and semisolid homes.11 We therefore used dwelling type as an operational recruitment variable, allocating more budget toward recruiting respondents in non- and semisolid dwellings and monitoring sample composition in real time across districts. This helped ensure adequate representation of more vulnerable households in the survey samples while also facilitating comparison with the urban-rural split available in the administrative malaria data.
4.2. Cluster-Level Randomization and Balance Checks
In coordination with MNM, we randomly assigned the campaign across districts in the three study states. Specifically, 39 of the 79 study districts were assigned to treatment (ads) and the remaining 40 to control (no ads) while balancing on a set of preintervention district characteristics. Beyond overseeing the randomization, the evaluation team had no role in campaign implementation.
Figure 1 maps the treatment and control districts. The circles denote the geofenced areas used for both survey recruitment and campaign delivery. All circles within a district were assigned to the same experimental condition and were defined using their centroid coordinates and a fixed radius. We provided these geofenced areas to the MNM advertising team, which excluded the control circles from the nationwide campaign while delivering ads in the treatment circles, as well as in other targeted areas and states. The cluster design offers two main advantages (Hayes and Moulton 2017). First, it accounts for potential spillovers—within households, across social networks (e.g., through shared Facebook content), and through reduced malaria transmission among neighbors—while limiting contamination between treatment and control areas. Second, it allows us to study not only individual-level effects in the survey data but also broader population-level effects in administrative health records, including the effects of collective behavior change on local malaria incidence.
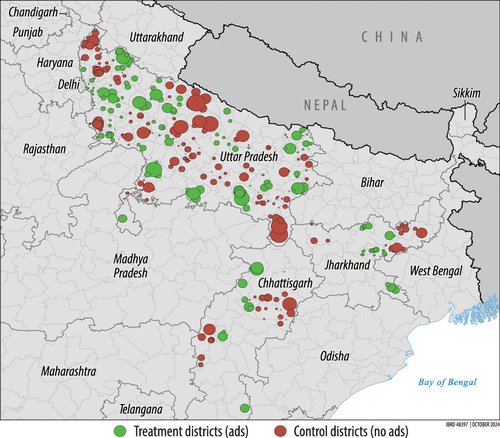
Notes. This map was produced by the Cartography Unit of the World Bank Group. The boundaries, colors, denominations and any other information shown on this map do not imply, on the part of the World Bank Group, any judgment on the legal status of any territory, or any endorsement or acceptance of such boundaries.
Table 3 reports district-level balance checks. The results show that the stratified recruitment and cluster randomization produced treatment and control districts that are well balanced across a range of demographic, socioeconomic, and health indicators from multiple data sources. The table also shows that the sample is evenly split, on average, between districts with higher and lower shares of solid dwellings, consistent with the recruitment strategy described above. Finally, the recruitment campaign achieved an average advertising cost of about US$0.85 per completed survey.
|
Table 3. District Characteristics by Experimental Condition
| Variable | Treatment mean | Control mean | Normalized difference | t-test (p-value) |
|---|---|---|---|---|
| (1) | (2) | (3) | (4) | |
| No. of districts | 39 | 40 | ||
| Panel A: Scoping survey (August 2020) | ||||
| Share living in solid houses | 0.502 | 0.494 | 0.078 | 0.623 |
| Share with university degree | 0.598 | 0.593 | 0.063 | 0.693 |
| Share unemployed | 0.439 | 0.446 | −0.103 | 0.519 |
| Share with malaria in last 2 weeks | 0.017 | 0.016 | 0.072 | 0.652 |
| Share with malaria in last 5 years | 0.190 | 0.184 | 0.051 | 0.750 |
| Average click-through rate (%) | 1.830 | 1.847 | −0.048 | 0.764 |
| Average cost per mille (USD) | 0.764 | 0.758 | 0.050 | 0.756 |
| Average ad cost per survey started (USD) | 0.252 | 0.241 | 0.072 | 0.650 |
| Average ad cost per survey completed (USD) | 0.820 | 0.858 | −0.052 | 0.744 |
| Panel B: Administrative sources (2011–2020) | ||||
| Area (thousand sq km) | 3.434 | 3.773 | −0.149 | 0.352 |
| Population (millions, Census 2011) | 2.757 | 2.629 | 0.077 | 0.629 |
| Population (millions, UN, 2020 estimate) | 2.978 | 2.906 | 0.040 | 0.804 |
| Share of rural population (UN, 2020 estimate) | 0.687 | 0.732 | −0.174 | 0.278 |
| Malaria positivity rate (Sep 2019–Aug 2020) | 0.020 | 0.017 | 0.072 | 0.654 |
| Household size | 5.821 | 5.833 | −0.013 | 0.934 |
| Share of females | 0.478 | 0.479 | −0.065 | 0.685 |
| Share of Hindu | 0.813 | 0.830 | −0.116 | 0.469 |
| Share with age under 7 | 0.156 | 0.152 | 0.203 | 0.207 |
| Socioeconomic Development Index | 0.048 | −0.047 | 0.067 | 0.674 |
| Panel C: Demographic and Health Survey (2019–2021) | ||||
| Share from disadvantaged castes | 0.800 | 0.815 | −0.145 | 0.365 |
| Share with no education | 0.324 | 0.320 | 0.045 | 0.778 |
| Share with closed drainage system | 0.392 | 0.370 | 0.084 | 0.598 |
| Share covered by health insurance | 0.265 | 0.245 | 0.076 | 0.636 |
| Share with access to public health facility | 0.670 | 0.662 | 0.054 | 0.737 |
| Number of bednets in the household | 1.063 | 0.984 | 0.125 | 0.433 |
| Share with mobile phone | 0.938 | 0.935 | 0.056 | 0.726 |
| Share with internet | 0.540 | 0.509 | 0.182 | 0.255 |
Notes. The table reports district characteristics by experimental condition. In panel B, data refer to the 2011 Census unless otherwise specified. The Socioeconomic Development Index is constructed using principal component analysis applied to the variables listed in Table D.3 in the Online Appendix. In panel C, disadvantaged caste groups include individuals who identify as members of Other Backward Classes (OBC), Scheduled Castes (SC/Dalit), or Scheduled Tribes (ST), as opposed to those from the general category. The normalized difference is the difference between the two means divided by the square root of the sum of the variances of the two variables.
5. Data and Analysis
5.1. Study Timeline
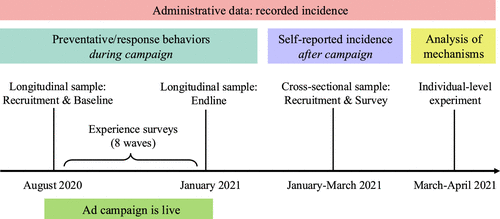
Figure 2 summarizes the study timeline and data collection phases. In the three study states, the MNM campaign was live for nearly five months, from August 19, 2020 to January 6, 2021. We recruited two separate survey samples over distinct periods: (i) a longitudinal “experience” sample, with recruitment and baseline interviews beginning in August 2020 and follow-up waves continuing through the end of January 2021, to measure effects during the campaign; and (ii) a cross-sectional sample, fielded from January to late March 2021, to study accumulated and medium-term effects after the campaign. As discussed in Section 7, we also conducted an additional survey wave in March–April 2021 as part of an individual-level feed experiment designed to distinguish between limited content effectiveness and limited campaign reach among more vulnerable populations. Finally, we complement the survey data with administrative health facility records spanning from April 2020, four months before the campaign began, to May 2021, five months after it ended.
5.2. Survey Samples and Administrative Data
The longitudinal survey was designed to measure malaria-related preventive behaviors (such as bednet use) and response actions (such as seeking medical care when fever symptoms arise) during the campaign. It consisted of a baseline questionnaire fielded before or at the start of the campaign, an endline survey fielded near the end of the campaign and immediately afterward, and eight short intermediate surveys administered approximately every 17 days. All baseline respondents were invited to complete the endline, regardless of how many intermediate waves they completed. To study effects during the campaign, we restrict the analysis to responses collected between September 1, 2020, and January 31, 2021 and aggregate outcomes across waves at the individual level. The final longitudinal sample contains 5,201 individuals, evenly split between treatment and control districts.
The cross-sectional survey was designed to capture the accumulated and medium-term effects of the campaign on malaria incidence, risk perceptions, and bednet-related behaviors and intentions. Some questions from the longitudinal survey were repeated with longer recall windows. For example, whereas the longitudinal survey asked whether respondents or their family members had experienced malaria in the previous two weeks, the cross-sectional survey asked about malaria since August 2020, when the study campaign began. We also collected information on malaria risk perceptions and on intentions to purchase or retreat bednets with insecticide. The final cross-sectional sample contains 3,052 observations. As discussed in Section 7, the cross-sectional study also served as the basis for an individual-level feed experiment designed to study the mechanisms.
For both samples, recruitment was stratified by district and dwelling type, which we use as a practical proxy for variation in baseline socioeconomic conditions and malaria risk. The enrollment questionnaire asked participants about their preferred language (English, Hindi, or Odia) and provided information about the study before eliciting informed consent. Only respondents aged 18 or older who consented to participate were included in the survey samples. Prior to analysis, we cleaned the data to improve data integrity. Specifically, we excluded respondents who completed the survey unusually quickly, those older than 90, and those reporting households with more than 30 members. We also excluded observations with missing baseline covariates. Because some outcomes were not observed in every wave, respondents may still have missing dependent variables for particular outcomes or survey rounds; each analysis therefore uses all valid nonmissing responses available for the outcome under study. Table 4 summarizes the data processing procedures.
|
Table 4. Data Sources, Cleaning, and Output
| Data (source); Level of observation | Processing and cleaning procedures | Output |
|---|---|---|
| District boundaries (Govt.); District | (1) Remove three state capitals; (2) Select 80 districts for study; (3) Drop one due to attribution errora | 79 study districts across three states |
| Longitudinal survey (research team); Individual–wave | (1) Responses Sep 1–Jan 31, with at least one nonmissing outcome: Observations = 20,125; individuals = 6,954 (2) Drop quick responsesb: Observations = 15,940; individuals = 5,501 (3) Drop if age <18 or 90: Observations = 15,307; individuals = 5,228 (4) Drop HHs 30 members: Observations = 15,259; individuals = 5,209 (5) Drop if missing covariates: Observations = 15,251; individuals = 5,201 | Final sample at individual-wave level: 15,251 observations from 5,201 individuals in 79 study districts Nonmissing responses per outcome: –Individual bednet use: Observations = 15,250; individuals = 5,201 –HH bednet use: Observations = 14,792; individuals = 5,050 –Long-sleeve clothing use: Observations = 5,189; individuals = 5,174 –Body/wall spray use: Observations = 2,423; individuals = 2,351 –Any fever in HH: Observations = 15,147; individuals = 5,158 –Any malaria in HH: Observations = 15,121; individuals = 5,141 |
| Cross‐sectional survey (research team); Individual | (1) Responses Jan 7–Mar 31, with nonmissing outcomes: individuals =3,368 (2) Drop quick responsesb: individuals = 3,060 (3) Drop if age <18 or 90: individuals = 3,060 (4) Drop HHs 30 members: individuals = 3,060 (5) Drop if missing covariates: individuals = 3,052 | Final sample of 3,052 individuals in 79 study districts, with nonmissing malaria outcomes |
| Feed experiment sample (research team); Individual | (1) Responses Mar 28–Apr 30, with nonmissing outcomes: individuals = 1,565; (2) Drop quick responsesb: individuals = 1,545 (3) Drop if age <18 or 90: individuals = 1,545 (4) Drop HHs 30 members: individuals = 1,545 (5) Drop if missing covariates: individuals = 1,542 | Final sample of 1,542 individuals in 79 study districts, with nonmissing bednet use and treatment seeking outcomes |
| Recorded malaria cases (HMIS, 2020–2021); Subdistrict-month | (1) Apr 1, 2020–May 31, 2021; (2) Drop unstable boundaries; (3) Drop if no. of cases > no. of tests; (4) Identify subdistrict population overlapping with study circles | 395 subdistricts in 79 study districts; 119 subdistricts with >50% population within study circles |
| Census 2011 (Govt.); District | None | District-level covariates; 121 districts, of which 79 selected in our study |
| DHS 2019–2021; Individual | Compute weighted means by district | District-level covariates; 121 districts, of which 79 selected in our study |
| Population (UN WPP 2020); 1 km × 1 km | Compute district-level totals via GIS software | Population counts control; rural vs. urban population share; 121 districts, of which 79 selected in our study |
| Elevation (ETOPO5); 1 km × 1 km | Compute district-level means and standard deviation via GIS software | Geographic controls; 121 districts, of which 79 selected in our study |
aOne study district was excluded due to a data attribution issue during campaign implementation. Specifically, there were two districts named Balrampur—each in a different state. One of them was intended to be included in the study and assigned to the treatment group. Because of the same name, however, it became impossible ex post to determine which district was assigned to which condition. As a result, both were excluded from the analysis.
bWe used timestamp data collected for each survey question to identify respondents who answered most questions unusually quickly. Specifically, we excluded respondents whose 90th percentile response time was less than three times their fastest response time. This approach accounts for individual variation in response speed while flagging uniformly fast response patterns suggestive of inattention and low engagement.
We complement the survey data with administrative health-facility records from the Indian Health Management Information System (HMIS), collected at the subdistrict-month level.12 The data report, for each subdistrict and month, the number of malaria tests conducted and the number of positive malaria cases recorded by health facilities. Because HMIS separately reports outcomes from urban and rural facilities within subdistricts, it allows us to estimate treatment effects by setting. Our analysis uses data from April 2020 to May 2021.13 We define April to August 2020 as the pretreatment period and September 2020 onward as the treatment period, consistent with the timing of campaign delivery in the study states. Relative to the survey data, the administrative records offer two main advantages. First, they provide objective measures of malaria incidence, mitigating concerns about social desirability bias or experimenter demand in self-reported outcomes. Second, they provide a broader measure of disease incidence at the subdistrict level, allowing us to estimate population-level effects of the campaign, including spillovers to individuals who were not directly exposed. They also allow for a more accurate assessment of the campaign’s cost-effectiveness.
5.3. Outcome Measures
We study three categories of outcomes: (1) self-reported protective behaviors and response actions during the campaign, (2) self-reported malaria incidence and related behaviors after the campaign, and (3) recorded malaria outcomes from the HMIS. Online Appendix B reports the survey questions.
5.3.1. Self-Reported Outcomes During the Campaign.
The longitudinal survey repeatedly measured malaria-related protective behaviors and response actions over the course of the campaign. Using these repeated observations, we construct: (i) the share of survey waves in which the respondent reported using a bednet or other protective measures, (ii) the average share of household members who used a bednet, (iii) an indicator for whether any household member reported fever or malaria during the campaign period, and (iv) an indicator for whether the household engaged in timely care-seeking or malaria testing during the campaign period conditional on fever or malaria symptoms. These outcomes were measured approximately every 17 days, although not all questions were fielded in every wave. We therefore retain respondents who contribute at least one nonmissing observation for a given outcome. After cleaning, this yields 15,251 individual-wave observations from 5,201 respondents. For each outcome, we aggregate responses across waves using only valid nonmissing responses for that specific outcome: We use the mean for outcomes (i) and (ii) and the maximum for outcomes (iii) and (iv). In the pooled analysis, observations are weighted by the number of valid responses used to construct the corresponding respondent-level outcome. For robustness, we also report longitudinal specifications estimated at the individual-wave level.
5.3.2. Self-Reported Outcomes After the Campaign.
The cross-sectional survey measures accumulated and medium-term effects after the campaign ended. We ask whether any household member had malaria since August 2020, and, if so, how many household members were affected. We also elicit concerns about contracting malaria or COVID-19 in the following year. In addition, among bednet owners, we measure whether existing bednets were retreated with insecticide, whereas among nonowners we ask about willingness to purchase a bednet and knowledge of where to buy one. After cleaning, the cross-sectional sample contains 3,052 respondents.
5.3.3. Health Facility Recorded Outcomes.
We use HMIS records to construct objective measures of malaria incidence at the subdistrict-month level. For each subdistrict and month, we observe the number of malaria tests conducted, the number of positive malaria cases recorded by health facilities, and the relevant population counts. From these data, we construct malaria incidence rates, defined as recorded cases per million people, and test positivity rates, defined as positive cases per test conducted. Because HMIS separately reports outcomes for urban and rural health facilities within subdistricts, we can estimate effects separately by setting. We use malaria incidence and test positivity as our main objective health outcomes, and the number of tests conducted as a complementary measure of healthcare utilization.
5.4. Empirical Specifications
5.4.1. Analysis of Survey Data.
In the main survey specifications, the unit of observation is the individual. Respondents residing in districts where the campaign was delivered are assigned to the treatment group, whereas respondents in districts excluded from the campaign constitute the control group. Because respondents in treated districts were not necessarily exposed to the MNM ads, our survey estimates capture intent-to-treat (ITT) effects. Our baseline specification, estimated by OLS, is
Because treatment was randomly assigned and baseline characteristics are well balanced across treatment and control districts, this parsimonious specification identifies causal effects without requiring additional controls. As robustness checks, we assess the sensitivity of the results to the inclusion of covariates and to alternative estimators. For binary outcomes we also estimate logistic models and report marginal effects. For outcomes observed repeatedly during the campaign, we additionally report longitudinal specifications at the individual-wave level with wave fixed effects.
5.4.2. Analysis of Administrative Data.
Administrative data were collected at the subdistrict level and cover 395 subdistricts across the 79 districts in the analysis. Focusing on subdistricts, rather than entire districts, reduces measurement error and improves precision by allowing a closer alignment between the data and the treatment and control areas, which were defined using circular zones within districts (Figure 1). This helps mitigate concerns that district-level health facility records in control districts may partly reflect outcomes for individuals exposed to the campaign.14 Using GIS tools, we identified the areas of overlap between subdistricts and study circles and computed the share of each subdistrict’s population living within those overlapping areas. We then used this measure to define alternative subsamples of subdistricts: the higher the overlap share, the lower the potential contamination in the control group.
Our benchmark specification focuses on the 119 subdistricts with at least 50% of their population living within the study circles. We also report the sensitivity of the results to alternative overlap thresholds, ranging from 10% to 80%. Table 5 reports the mean monthly outcomes for the full set of subdistricts and for the benchmark subsample. Although the number of malaria cases per month is similar across the two samples, monthly incidence per million people is substantially lower in the benchmark subsample (about 21 versus 51 cases per million), reflecting the larger average population of the subdistricts covered by the study circles, which were centered on major towns and cities. The table also reports means separately for urban and rural health facilities.15 These figures highlight the greater burden of malaria in rural areas. For example, in the benchmark sample, both absolute incidence and incidence per million are roughly twice as large in rural facilities (9 cases and 19 cases per million) as in urban facilities (4.8 cases and 9.5 cases per million).
|
Table 5. Administrative Health Facility Data: Mean Monthly Outcomes Across Subdistricts
| Variable | All subdistricts | Subdistricts with >50% population within circles | ||||
|---|---|---|---|---|---|---|
| All health facilities | Urban | Rural | All health facilities | Urban | Rural | |
| No. of cases | 9.63 | 3.65 | 9.37 | 10.05 | 4.76 | 8.93 |
| No. of cases per million people | 51.23 | 7.33 | 53.80 | 20.89 | 9.45 | 18.87 |
| No. of tests per million people | 3,278.63 | 1,050.34 | 3,267.20 | 2,689.72 | 1,221.98 | 2,425.33 |
| Test positivity rate (%) | 1.50 | 1.45 | 1.43 | 1.24 | 1.71 | 1.10 |
| Population (thousands) | 550.35 | 905.92 | 509.51 | 716.82 | 960.55 | 656.96 |
| No. of subdistricts | 395 | 111 | 392 | 119 | 65 | 116 |
Notes. The table reports the means of the variables across the different subsamples. Only subdistricts with nonmissing entries are included. Subdistricts where the number of positive malaria cases was larger than the number of malaria tests conducted are dropped. Subdistricts often include both urban and rural areas. As a result, malaria incidence is reported separately for urban and rural health facilities within the same subdistrict, and the corresponding sample sizes do not necessarily sum to the total number of subdistricts.
To estimate the effect of the campaign, we exploit within-subdistrict variation between April 2020 and May 2021 and estimate the following difference-in-differences specification:
6. Results
6.1. Sample Characteristics and Randomization Checks
Tables D.4 and D.5 in the Online Appendix describe the characteristics of individuals and households in the longitudinal and cross-sectional samples, respectively. For the longitudinal sample, we report both covariates (panel A) and baseline outcomes (panel B). For the cross-sectional sample, which was collected after the campaign, we report only time-invariant covariates.
Both tables indicate a high degree of balance in individual and household characteristics, as well as in pretreatment outcomes, across experimental groups, supporting the validity of the randomization. In the longitudinal sample, none of the differences between treatment and control groups is statistically significant. Table D.6 in the Online Appendix shows that this balance is preserved after accounting for attrition. In the cross-sectional sample, the treatment group includes a slightly higher proportion of unemployed individuals and households with pregnant women than the control group. However, these differences are small in magnitude, with all normalized differences below 0.07. In addition, our main results are robust to the inclusion of control variables.
In both samples, respondents are roughly evenly split between treatment and control districts, and approximately 55% reside in non- or semisolid dwellings, consistent with the stratified recruitment design across districts and dwelling type. Attrition in the longitudinal sample is also balanced across experimental groups, with respondents completing, on average, three survey waves. Table D.7 in the Online Appendix further reports results from a survey-wave differential attrition test, showing that nonresponse rates were balanced across treatment and control arms. In terms of sociodemographic characteristics, men make up about 90% of both samples, the average respondent is 27 years old, and 55%–60% report having completed university, while about half are unemployed. Around 60% of respondents identify with socially and economically disadvantaged caste groups (OBC, SC/Dalit, and ST), which prior studies suggest are associated with lower awareness of malaria prevention (Singh et al. 2020). Household size averages between six and seven members. About one in eight households includes a pregnant woman, and roughly three-quarters of respondents live within 60 minutes’ walking distance of a medical center.
In terms of baseline outcomes, 2% of respondents report that a household member experienced malaria in the previous two weeks, and 20% report a malaria episode within the previous five years. Among households that own a bednet, about 70% report that the respondent slept under it the previous night, and about 70% report that household members did so as well. Combining these figures with the average bednet ownership rate in the sample (75%) implies that just over half of individuals are regularly protected from mosquito bites at night. Relatedly, about one-third of respondents report some concern about getting malaria in the following month.
Relative to the general population, our sample of social media users is socioeconomically more advantaged, based on data from the 2019–2021 India Demographic and Health Survey (India IIPS 2022). Although approximately three-quarters of households in our sample own a mosquito net, only about one-third of households in India report owning at least one. Internet access is also more limited in the broader population: Across the three study states, only about 1 in 3 women and 6 in 10 men have ever used the internet. These differences imply that our findings apply to connected populations and do not generalize to individuals without internet access.
Finally, for the analysis based on health facility data, we examine balance on pretreatment characteristics at the subdistrict level. Table D.8 in the Online Appendix shows that treatment and control subdistricts are generally balanced on observed characteristics such as population, the rural population share, and geographic indicators. For malaria-related outcomes—including the number of diagnostic tests and test positivity rates—there are no statistically significant differences across experimental conditions. Although both urban and rural positivity rates are slightly higher in treatment areas, these differences are small in standard deviation units and not statistically significant. Moreover, the difference-in-differences specification further mitigates concerns about residual precampaign imbalances by including subdistrict fixed effects.
6.2. Survey-Based Results
6.2.1. Protective Behaviors, Care-Seeking, and Health Outcomes During the Campaign.
Table 6 presents the effect of the campaign on sleeping under mosquito nets during the intervention period—one of the main behaviors emphasized in the ads that received the largest share of the budget. We report results for both respondents’ own behavior and that of the entire household. The analysis focuses on households that owned at least one bednet at baseline, allowing us to isolate changes in usage behavior rather than conflating them with ownership decisions.16 For each outcome, we report results using two alternative specifications. Columns (1) and (3) present pooled individual-level estimates, where outcomes are aggregated across survey waves and weighted by the number of completed waves. Columns (2) and (4) report longitudinal estimates at the individual-wave level, including wave fixed effects.
|
Table 6. Sleeping Under Bednet (During the Campaign)
| Share of times respondent used bednet | Share of HH members who used bednet | |||
|---|---|---|---|---|
| (1) | (2) | (3) | (4) | |
| Individual | Individual-wave | Individual | Individual-wave | |
| T | 0.030 | 0.030 | 0.025 | 0.025 |
| (0.019) | (0.019) | (0.017) | (0.018) | |
| Wave fixed effects | ✓ | ✓ | ||
| Observations | 4,004 | 11,965 | 3,900 | 11,619 |
| Adjusted R2 | 0.006 | 0.007 | 0.005 | 0.006 |
| Mean in control | 0.635 | 0.635 | 0.661 | 0.661 |
| Standard deviation in control | 0.421 | 0.481 | 0.344 | 0.380 |
Notes. The table reports intent-to-treat estimates of the campaign’s effect on bednet use during the campaign period, using responses collected between September 1, 2020, and January 31, 2021. Only households owning at least one bednet are included. T is the treatment indicator. Columns (1) and (3) report pooled individual-level specifications in which the outcome is the share of survey waves with reported bednet use and observations are weighted by the number of valid survey responses, whereas columns (2) and (4) report longitudinal (panel) specifications at the individual-wave level with wave fixed effects. State fixed effects are included in all columns. Standard errors are clustered at the district level.
*; **; ***.
Across all specifications, the estimated effects are small and not statistically significant. The point estimates correspond to increases of about 3 p.p. at the individual level and about 2.5 p.p. at the household level (about 4%–5% relative to the control mean), but we cannot reject the null of no effect. The similarity of the estimates across specifications indicates that the results are robust to the level of aggregation and to the inclusion of wave fixed effects.
Figure 3 examines heterogeneity in the treatment effects of the campaign on household-level bednet use across different periods of the campaign (left panel) and across baseline risk perception levels (right panel). A natural question is whether estimated effects differ over the course of the campaign and across households with different baseline levels of concern about malaria. However, consistent with the small and statistically insignificant estimates reported in Table 6, we find no evidence of heterogeneous effects along either dimension.
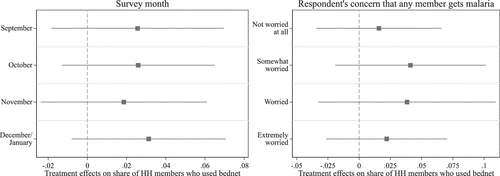
Notes. The figure reports coefficient estimates (treatment effects) from the regression in column (3) of Table 6, estimated separately for different subsamples defined by the month in which the survey was taken (left) and by baseline malaria concern (right). The outcome is the share of household members who used a bednet the previous night. The sample is restricted to households that owned at least one bednet at baseline. Bars indicate 95% confidence intervals. All regressions include state fixed effects, and standard errors are clustered at the district level.
We also examine the effects of the MNM campaign on other protective behaviors, such as wearing long-sleeved clothing and using body or wall sprays to prevent mosquito bites. Table 7 shows no statistically significant effects on these behaviors. The estimated coefficients are small and, if anything, negative. Column (3) reports results for a composite protective behavior index constructed using PCA of bednet use, the share of household members using bednets, and the use of sprays and long-sleeved clothing. Unlike the bednet-use analysis, this index is constructed for the full sample rather than only for bednet owners. Consistent with the individual outcomes, we find no significant effect of the campaign on this composite measure.
|
Table 7. Other Protective Behaviors (During the Campaign)
| Share of times any member used long sleeves | Share of times any member used body/wall sprays | Protective Behaviors Index | |
|---|---|---|---|
| (1) | (2) | (3) | |
| T | −0.005 | −0.020 | 0.004 |
| (0.019) | (0.023) | (0.049) | |
| Observations | 5,174 | 2,351 | 5,201 |
| Adjusted R2 | 0.014 | 0.002 | 0.002 |
| Mean in control | 0.642 | 0.410 | 0.069 |
| Standard deviation in control | 0.404 | 0.485 | 0.937 |
Notes. The table reports intent-to-treat estimates of the campaign’s effect on alternative protective behaviors during the campaign period, using responses collected from September 1, 2020, to January 31, 2021. Each observation is an individual and observations are weighted by the number of survey waves the respondent completed in this period. T is the treatment indicator. Columns (1) and (2) report the share survey waves with reported use of long-sleeved clothing and mosquito sprays, respectively, by any household member. Column (3) reports a standardized protective behaviors index constructed using principal component analysis applied to individual bednet use, the share of household members using bednets, and individual use of mosquito spray and long-sleeved clothing. Because some components are missing for a subset of observations, missing values are imputed at the sample mean in constructing the index. Standard errors are clustered at the district level.
*; **; ***.
Our results provide no clear evidence that the campaign significantly affected either its primary behavioral target—bednet use—or other related protective behaviors. This lack of detectable effects may reflect limited effectiveness of the ads in changing behavior, insufficient exposure among the relevant population, or measurement error in self-reported behaviors. We explore the first two in Section 7. We address measurement and reporting concerns below by augmenting the survey evidence with administrative health facility data and through a series of robustness checks.
We next examine malaria-related health outcomes and response actions during the campaign. In the longitudinal sample, respondents were repeatedly asked whether anyone in the household had experienced fever (100.4°F/38°C or above) or malaria in the previous two weeks. Conditional on fever, we measure whether medical help was sought within 24 hours; conditional on malaria, we measure whether the individual was tested. Timely care-seeking and malaria testing were both emphasized in the campaign. Table 8 reports the effects of the campaign on these outcomes, defined as indicators equal to one if the event occurred at least once during the campaign period.
|
Table 8. Incidence of Fever, Care-Seeking, and Malaria Outcomes (During the Campaign)
| Any fever | Care-seeking (24 hours) | Any malaria | Malaria test | |||||
|---|---|---|---|---|---|---|---|---|
| (1) | (2) | (3) | (4) | (5) | (6) | (7) | (8) | |
| OLS | Logit | OLS | Logit | OLS | Logit | OLS | Logit | |
| T | 0.007 | 0.045 | 0.006 | 0.044 | −0.004 | −0.061 | 0.003 | 0.017 |
| (0.017) | (0.102) | (0.030) | (0.211) | (0.010) | (0.146) | (0.061) | (0.294) | |
| Observations | 5,158 | 5,158 | 724 | 724 | 5,141 | 5,141 | 324 | 324 |
| Adjusted R2 | 0.002 | −0.000 | 0.003 | −0.008 | ||||
| Pseudo R2 | 0.003 | 0.004 | 0.008 | 0.001 | ||||
| Marginal effect | 0.007 | 0.006 | −0.004 | 0.003 | ||||
| Mean in control | 0.202 | 0.156 | 0.824 | 0.797 | 0.062 | 0.062 | 0.679 | 0.679 |
| Standard deviation in control | 0.402 | 0.363 | 0.381 | 0.403 | 0.241 | 0.241 | 0.468 | 0.468 |
Notes. The table reports intent-to-treat estimates of the campaign’s effect on fever, care-seeking, and malaria-related outcomes during the campaign period, using responses collected from September 1, 2020, to January 31, 2021. Each observation is an individual, and observations are weighted by the number of survey waves the individual completed in this period. T is the treatment indicator. Columns (1) and (2) report indicators for whether any household member experienced a high fever (100.4°F/38°C or above) at least once during the period; columns (3) and (4) report indicators for whether any household member with fever sought medical help within 24 hours at least once. Columns (5) and (6) report indicators for whether any household member had malaria at least once during the period; columns (7) and (8) report indicators for whether any household member with malaria was tested at least once. State fixed effects are included in all columns. Standard errors are clustered at the district level.
*; **; ***.
Across all outcomes, the estimated effects are small and not statistically significant. We do not detect changes in the incidence of fever or malaria (columns (1)–(2) and (5)–(6)), nor in timely care-seeking or malaria testing conditional on symptoms (columns (3)–(4) and (7)–(8)). The results are similar across OLS and logit specifications, with marginal effects from the latter closely matching the OLS estimates. Taken together, these findings provide no evidence of detectable effects on malaria-related health outcomes or response actions during the intervention period. This may reflect the fact that any behavioral responses induced by the campaign were too limited or too short-lived to translate into measurable health effects during the campaign itself. These considerations motivate our analysis of postcampaign outcomes using the separate cross-sectional sample and the administrative data.
6.2.2. Malaria Incidence and Bednet Re-Treatment After the Campaign.
Table 9 presents the impact of the campaign on self-reported malaria incidence since its launch in August 2020, as measured in the cross-sectional survey conducted one to three months after the campaign ended. The table reports outcomes at both the extensive margin (whether any household member had malaria; columns (1)–(2) and the intensive margin (the share of household members infected; column (3)). Across all measures, we find no statistically significant impact of the campaign on malaria incidence. The estimated effects are small and close to zero, and we cannot reject the null of no effect. Results are consistent across OLS and logit specifications.
|
Table 9. Malaria Incidence and Bednet Retreatment with Insecticide (Since Campaign Launch)
| Any HH member had malaria | Share of HH members who had malaria | Any bednet retreated with insecticide | |||
|---|---|---|---|---|---|
| (1) | (2) | (3) | (4) | (5) | |
| OLS | Logit | OLS | OLS | Logit | |
| T | 0.003 | 0.053 | −0.002 | 0.051* | 0.207* |
| (0.011) | (0.196) | (0.003) | (0.027) | (0.108) | |
| Observations | 3,052 | 3,052 | 3,052 | 2,017 | 2,017 |
| Adjusted R2 | −0.000 | 0.001 | 0.001 | ||
| Pseudo R2 | 0.001 | 0.002 | |||
| Marginal effect | 0.003 | 0.051 | |||
| Mean in control | 0.058 | 0.058 | 0.016 | 0.409 | 0.409 |
| Standard deviation in control | 0.235 | 0.235 | 0.081 | 0.492 | 0.492 |
Notes. Each observation is an individual. T is the treatment indicator. All responses were collected after the campaign, between January 7 and March 31, 2021. Columns (1) and (2) report indicators for whether any household member had malaria since August 2020. Column (3) reports the share of household members with malaria since August 2020. Columns (4) and (5) report whether the respondent retreated their bednet (conditional on having at least one) with insecticide since August 2020. State fixed effects are included in all columns. Standard errors are clustered at the district level.
*; **; ***.
Figure 4 examines whether the effects of the campaign vary with bednet ownership and coverage. The left panel compares households with and without bednets, whereas the right panel focuses on households with bednets and distinguishes between those with higher and lower coverage (measured as at least one bednet for every two members). Across all subgroups, the estimated effects are small and not statistically significant. Overall, the figure provides no evidence that bednet ownership or coverage moderates the impact of the campaign on malaria outcomes.
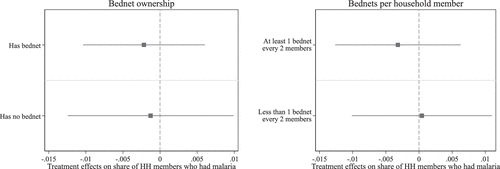
Notes. The figure reports coefficient estimates (treatment effects) from the regression in column (3) of Table 9, estimated separately for different subsamples defined by household bednet ownership (left panel) and by the number of bednets per household member (right panel). The outcome is the share of household members who had malaria since August 2020. Bars indicate 95% confidence intervals. Standard errors are clustered at the district level.
Columns (4) and (5) of Table 9 examine whether respondents retreated their bednets with insecticide. In contrast to the incidence results, the retreatment estimates are positive and marginally statistically significant. The OLS estimate corresponds to a 5.1 p.p. increase among bednet owners. Although this points to some behavioral response along this margin, the estimate remains imprecise.
Finally, Table D.9 in the Online Appendix assesses whether the campaign affected malaria-related concern and bednet-related intentions after the campaign ended. We find only marginally significant evidence () that the campaign increased the share of respondents who report being very worried about malaria in the following year, with an estimated effect of 2.9 p.p., or about 11% relative to the control mean (columns (1)–(2)). By contrast, we find no significant effects on bednet ownership, willingness to buy a bednet among nonowners, or knowledge of where to buy one (columns (3)–(8)).17 Taken together, these results suggest that the campaign may have modestly increased concern about malaria, without translating into stronger bednet-related adoption or purchase intentions.
6.2.3. Heterogeneous Treatment Effects by Household SES.
We next explore, in a post hoc and exploratory manner, whether the campaign’s effects varied across households with different levels of SES. We use SES as a pretreatment moderator in this analysis: The estimates describe heterogeneity in the randomized treatment effect across SES groups rather than isolating any single underlying channel. The index combines housing choice, proximity to health facilities, education, caste status, air-conditioning ownership, and household size, and may also capture unobserved factors that shape social media use, digital engagement, and the ability to respond to health messages. Focusing on this index is useful because Table 2 shows that its components are jointly informative about baseline malaria incidence and reports the loadings of the first principal component used to construct it. Higher SES is associated with more protective living conditions: For example, solid housing and closer access to health facilities load positively into the index, whereas larger household size loads negatively.
Table D.2 in the Online Appendix further shows that the SES index is negatively associated with malaria incidence at baseline. A one-standard-deviation increase in SES is associated with a 2.2 p.p. lower probability that any household member had malaria in the previous five years and a 0.4 p.p. lower probability of malaria in the previous two weeks. Relative to the corresponding sample means, these associations amount to reductions of about 12% and 25%, respectively. Motivated by this relationship, we use the SES index to examine whether the campaign had differential effects across households with relatively lower and higher socioeconomic status, and thus across groups that were ex ante more and less vulnerable to malaria risk.
To do so, we focus on the main behavioral and health outcomes discussed above and split the sample at the median of the standardized first principal component into higher- and lower-SES households. We then estimate treatment effects separately by SES group and test for differences using a pooled regression that includes the treatment indicator, a high-SES indicator, and their interaction, . The interaction term captures whether the treatment effect differs across SES levels. We report both conventional p-values and p-values adjusted for multiple testing using the Benjamini-Hochberg false discovery rate (FDR) procedure (Benjamini and Hochberg 1995).
Table 10 suggests that the campaign’s detectable effects were more concentrated among high-SES households. For bednet use, the campaign increases the share of household members sleeping under a bednet by 6.7 p.p. among high-SES households (column 1), corresponding to an 11% increase relative to the control mean. By contrast, the estimate for low-SES households is small, negative, and statistically insignificant. The difference between the two groups is statistically significant under both conventional inference and FDR adjustment. For fever incidence during the campaign, by contrast, we find no detectable effects in either SES group (columns (3)–(4)): The estimates are small, and the interaction term is close to zero and not statistically significant.
|
Table 10. Treatment Effect Heterogeneity by Household SES
| Share of HH members who used bednet | Any HH member had a fever during the campaign | |||
|---|---|---|---|---|
| (1) | (2) | (3) | (4) | |
| High SES | Low SES | High SES | Low SES | |
| T | 0.067*** | −0.016 | 0.003 | 0.011 |
| (0.024) | (0.019) | (0.020) | (0.022) | |
| T p-value (FDR) | 0.048 | 0.651 | 0.866 | 0.689 |
| T High SES coefficient | 0.084 | −0.006 | ||
| T High SES p-value | 0.001 | 0.820 | ||
| T High SES p-value (FDR) | 0.006 | 0.820 | ||
| Observations | 1,929 | 1,971 | 2,579 | 2,579 |
| Adjusted R2 | 0.015 | 0.001 | 0.002 | 0.002 |
| Mean in control | 0.614 | 0.707 | 0.190 | 0.213 |
| Standard deviation in control | 0.360 | 0.322 | 0.393 | 0.410 |
| Share of HH members who had malaria | Any bednet retreated with insecticide | |||
|---|---|---|---|---|
| (5) | (6) | (7) | (8) | |
| High SES | Low SES | High SES | Low SES | |
| T | −0.009** | 0.005 | 0.082** | 0.021 |
| (0.004) | (0.005) | (0.036) | (0.035) | |
| T p-value (FDR) | 0.061 | 0.601 | 0.064 | 0.689 |
| T High SES coefficient | −0.014 | 0.062 | ||
| T High SES p-value | 0.011 | 0.187 | ||
| T High SES p-value (FDR) | 0.022 | 0.249 | ||
| Observations | 1,517 | 1,535 | 989 | 1,028 |
| Adjusted R2 | 0.004 | 0.001 | 0.004 | −0.002 |
| Mean in control | 0.016 | 0.016 | 0.406 | 0.412 |
| Standard deviation in control | 0.083 | 0.079 | 0.492 | 0.493 |
Notes. Each observation is an individual. The SES index is constructed using principal component analysis (PCA) based on housing quality, access to health facilities, education, caste status, air conditioning ownership, and standardized household size. The index is standardized and split at the median to define High and Low SES groups. The table reports subgroup-specific treatment effects as well as the interaction coefficient from a model that also includes the standalone indicators T and . We report Benjamini-Hochberg false discovery rate (FDR)-adjusted p-values for (i) the subgroup treatment-effect tests across the eight subgroup estimates in this table and (ii) the interaction tests across the four outcomes. All regressions include state fixed effects. Standard errors are clustered at the district level.
*; **; ***.
A similar pattern emerges for postcampaign outcomes. Among high-SES households, the campaign reduces the share of household members who had malaria by 0.9 p.p. (column (5)), corresponding to a 56% decline relative to the control mean under conventional inference. For low-SES households, the estimate is again small and statistically insignificant. The difference across groups remains statistically significant under both conventional inference and FDR adjustment. For bednet retreatment with insecticide, the estimated effect is 8.2 p.p. among high-SES households (column (7)), corresponding to a 20% increase relative to the control mean, compared with a statistically insignificant increase of 2.1 p.p. among low-SES households (column (8)). The point estimates again suggest larger effects among high-SES households, but in this case, the difference across groups is not statistically significant, and the subgroup estimate is less precisely estimated.
Taken together, these post hoc results suggest that the campaign’s measurable effects were more concentrated among higher-SES households, which were also ex ante less vulnerable to malaria according to the gradients documented above. The clearest evidence of heterogeneity appears for bednet use during the campaign and for subsequent malaria incidence, whereas the retreatment estimates point in the same direction but are less precisely estimated. More broadly, this pattern is consistent with the view that the campaign’s detectable impacts were concentrated among households with greater resources and better living conditions, with limited evidence of effects among poorer and more malaria-vulnerable households. Because these outcomes come from survey responses, however, differential reporting accuracy by SES could also contribute to the observed pattern. This possibility further motivates the use of administrative data and a closer examination of the mechanisms.
6.3. Evidence from Administrative Data
We now turn to administrative health records to assess whether the campaign affected objectively measured malaria incidence at the population level. These data complement the survey evidence by capturing realized health outcomes across treated and control areas and by distinguishing between urban and rural health facilities. Because the administrative records do not contain household-level measures of SES, we use the urban-rural split as a related but distinct way to describe heterogeneity in the administrative data. According to the 2019–2021 India DHS (India IIPS 2022), urban and rural households differ along several socioeconomic and structural dimensions that may shape both exposure to digital ads and responses to health messages. Urban households are much more likely than rural households to live in solid dwellings (84.9% versus 48.0%), to own an air conditioner or cooler (39.5% versus 15.8%), to include women with at least 12 years of schooling (38.9% versus 19.6%), and to have internet access (64.6% versus 41%); they are also slightly smaller on average (4.2 versus 4.5 members).18 At the same time, our administrative data show that malaria incidence is substantially higher in rural than in urban health facilities: In the benchmark subsample, rural facilities record an average of 18.87 monthly cases per million people over the full sample period, compared with 9.45 in urban facilities (Table 5). We therefore interpret the urban-rural comparison as complementary evidence on whether detectable effects were concentrated in settings that are both more connected and less socioeconomically vulnerable.
Table 11 reports the campaign’s effect on malaria incidence, measured as the monthly number of recorded cases per million people at the subdistrict level. Because the administrative analysis is based on the difference-in-differences specification in Equation (2), we report the coefficient on the interaction term, . We begin with a parsimonious specification without controls, then add district-level covariates, and finally subdistrict-level controls.
|
Table 11. Malaria Monthly Incidence Rates (no. of Monthly Cases/1M People)
| Overall incidence | Urban areas | Rural areas | |||||||
|---|---|---|---|---|---|---|---|---|---|
| (1) | (2) | (3) | (4) | (5) | (6) | (7) | (8) | (9) | |
| T Post | −3.28 | −5.80 | −4.64 | −6.10* | −6.96** | −6.42** | 0.99 | −1.47 | −2.06 |
| (6.34) | (6.23) | (5.54) | (3.41) | (2.92) | (2.71) | (6.02) | (6.37) | (6.10) | |
| Subdistrict fixed effects | ✓ | ✓ | ✓ | ✓ | ✓ | ✓ | ✓ | ✓ | ✓ |
| Month and year fixed effects | ✓ | ✓ | ✓ | ✓ | ✓ | ✓ | ✓ | ✓ | ✓ |
| District controls | ✓ | ✓ | ✓ | ✓ | ✓ | ✓ | |||
| Subdistrict controls | ✓ | ✓ | ✓ | ||||||
| Observations | 1,499 | 14,99 | 1,499 | 791 | 791 | 791 | 1,338 | 1,338 | 1,338 |
| Adjusted R2 | 0.189 | 0.187 | 0.187 | 0.451 | 0.455 | 0.461 | 0.151 | 0.149 | 0.148 |
| Mean at baseline | 35.03 | 35.03 | 35.03 | 18.81 | 18.81 | 18.81 | 27.76 | 27.76 | 27.76 |
| Standard deviation at baseline | 108.28 | 108.28 | 108.28 | 38.53 | 38.53 | 38.53 | 105.77 | 105.77 | 105.77 |
Notes. Each observation is a subdistrict-month-year. The panel spans from April 2020 to May 2021. T takes a value of one if the subdistrict belongs to a treated district. Post takes a value of one after August 2020, that is, when the Facebook campaign started. District controls include total population from the Census as well as the shares of baseline survey respondents living in nonsolid dwellings, with university degree, sleeping under mosquito nets, and reporting any malaria cases in the last five years and two weeks, all interacted with Post. Subdistrict controls include subdistrict area, share of urban population, elevation, terrain ruggedness and distance to the state capital, all interacted with Post. All regressions include state fixed effects interacted with Post. Subdistricts often include both urban and rural areas. As a result, malaria incidence is reported separately for urban and rural health facilities within the same subdistrict, and the corresponding sample sizes do not necessarily sum to the total number of subdistricts. Standard errors are clustered at the district level. Baseline mean and standard deviation refer to observations from treated subdistricts in July–August 2020. Data come from the Indian Health Management Information System.
*; **; ***.
Columns (1)–(3) report the effects on overall malaria incidence. The estimated coefficients are negative, but not statistically significant. When we disaggregate the analysis by facility type, however, a clearer pattern emerges. In urban facilities, the campaign reduced monthly malaria incidence by just over 6 cases per million people in treated subdistricts relative to the control group. The estimate is statistically significant at the 10% level in the parsimonious specification (column (4)) and remains similar in magnitude as district- and subdistrict-level controls are added (columns (5) and (6)). In the fully saturated specification, the coefficient is statistically significant at the 5% level and implies a reduction of 6.2 monthly cases per million people, equivalent to approximately 33% of the average precampaign urban incidence rate. By contrast, we do not detect significant effects in rural areas. Columns (7)–(9) suggest negative but smaller coefficients—roughly one-quarter the size of the urban estimates—and these are not statistically significant. Table D.10 in the Online Appendix shows the results for malaria testing and test positivity. We find no significant effect on the number of malaria tests conducted, either overall or by urban and rural facilities. However, consistent with the decline in urban incidence, test positivity falls significantly: The share of positive tests declines by 1.7 p.p. overall and by 2.2 p.p. in urban areas, whereas the rural estimate is close to zero.
The stronger effects on recorded malaria incidence in urban areas are consistent with the broad pattern documented in the survey data, but they do not distinguish whether the relevant margin is SES, urbanicity, internet quality, or some combination of these factors. Interpreting the urban-rural split as a coarse proxy for both socioeconomic conditions and digital reachability, these results suggest that the campaign’s detectable effects were more concentrated in relatively connected and less vulnerable settings, whereas we find no detectable reduction in malaria incidence in higher-risk rural settings. One possible explanation is that rural health facilities disproportionately serve offline populations who were less likely to be exposed to the campaign. However, Table D.11 in the Online Appendix shows that the estimated effects on rural malaria incidence and test positivity remain small and statistically insignificant even in subdistricts with higher internet penetration, suggesting that limited internet access, by itself, is unlikely to fully explain the rural null effects.
The identifying assumption underlying the difference-in-differences estimates in Table 11 is parallel trends: Absent the campaign, malaria incidence would have evolved similarly in treatment and control subdistricts. This assumption is plausible given the cluster-level randomization, and we provide supporting evidence. Figure 5 traces treatment-control differences in malaria incidence over time and allows us to assess potential pre-existing divergences before the campaign. Although there appears to be a modest upward pattern in overall incidence in treated relative to control areas before the intervention, these differences are not statistically significant and become smaller when urban and rural areas are examined separately. Overall, the figure is consistent with the parallel trends assumption, showing similar precampaign patterns in urban and rural incidence across treatment and control groups. It also shows a decline in urban malaria incidence following the campaign, whereas the estimated effects in rural areas are much smaller and insignificant. This visual evidence is complemented by the formal pretrend tests reported in Table D.12 in the Online Appendix. Using only precampaign data, both a placebo difference-in-differences specification and a linear-trend specification yield coefficients that are small and statistically insignificant in all cases.
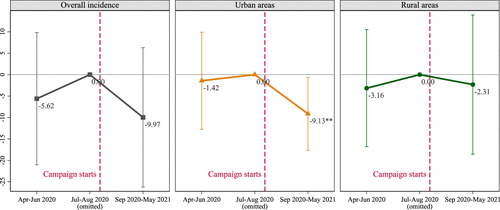
Notes. Each point reports the coefficient on the interaction term T Period, where T is the treatment assignment, and Period is a dummy variable equal to one at each period on the graph (i.e., Apr-Jun 2020, Jul-Aug 2020, and Sep 2020-May 2021). The omitted period is Jul-Aug 2020. Each graph reports the results from one regression. Regressions include subdistrict and period fixed effects, as well as district-level controls interacted with period dummies. Standard errors are clustered at the district level. Bars represent the 95% confidence intervals.
6.4. Placebo Regressions and Robustness Checks
We examine the sensitivity of the survey-based results to the inclusion of individual- and district-level covariates and to adjusting for multiple hypothesis testing. Table D.13 in the Online Appendix reports the survey outcomes and shows that the estimated coefficients remain stable when controls are added. To account for the fact that we test multiple survey outcomes, we also report p-values adjusted using the Benjamini-Hochberg FDR procedure (Benjamini and Hochberg, 1995). Although precision improves in some cases, the overall pattern of results is unchanged, and the estimates remain statistically insignificant after FDR adjustment. We also assess the sensitivity of the SES-based heterogeneity results to the inclusion of controls and find that the estimates remain highly stable, further supporting the heterogeneous treatment effects.
Because bednet use was measured at baseline, before the campaign began, we also estimate placebo regressions to further validate the randomization. Columns (1)–(2) of Table D.14 in the Online Appendix report the results of regressing pretreatment bednet use outcomes measured in July and August 2020 on the treatment indicator. The estimates provide additional support for successful randomization: All coefficients are small and statistically insignificant, which also helps alleviate concerns about differential reporting bias.
We also consider whether the survey-based results may be affected by reporting bias. Such bias could arise from repeated survey participation, for example, through mere-exposure effects or from social desirability in self-reported behaviors. Social desirability bias is unlikely to be strongly correlated with campaign exposure, however, because the Facebook and Instagram page used to recruit and survey participants was entirely separate from the MNM campaign page, reducing the likelihood that respondents perceived a connection between the survey and the intervention. As a placebo check, we examine respondents’ perceived risk of contracting COVID-19 in the next year, an outcome unrelated to the campaign, and find no treatment effect (columns (3)–(4) of Table D.14 in the Online Appendix), suggesting no broader shift in self-reported risk perceptions.
To assess whether repeated survey exposure may have confounded the results, we examine heterogeneity by “survey dose,” stratifying respondents into (i) those who completed only the first wave, (ii) those who completed one to four waves, and (iii) those who completed more than five waves. We then re-estimate the main specification for each group. As shown in Table D.15 in the Online Appendix, treatment effects remain statistically insignificant across all groups, and the estimates are similar in magnitude and statistically indistinguishable from one another. These findings alleviate concerns that repeated participation is either masking or generating the null results. Finally, the administrative health facility data are consistent with the survey evidence: Measures of malaria incidence and test positivity likewise show no broad overall effects. Given that the survey covered about 8,300 individuals, representing less than 0.01% of the 116 million residents in the 79 study districts, it is highly unlikely that survey participation itself affected district-level outcomes.
For the health facility data, we test the robustness of the results to alternative models, samples, and outcome definitions. First, as shown in Table 11, the estimated treatment effects change little with the inclusion of district- and subdistrict-level controls. Second, Table D.16 in the Online Appendix reports the sensitivity of the estimates to eight alternative population thresholds used to define the subdistrict sample. The effect of the campaign on urban incidence is stable and mostly statistically significant across specifications, with estimated reductions generally around 30% of the baseline urban incidence rate. By contrast, the coefficient for rural incidence is unstable in sign and generally remains statistically insignificant. Third, Table D.17 in the Online Appendix considers the absolute number of malaria cases as the dependent variable and includes subdistrict population among the controls. Columns (1)–(3) report estimates from a linear model using the log number of cases, whereas columns (4)–(6) report results from a Poisson model. In both cases, the findings are closely aligned with the main results: The log specification implies a roughly 30% reduction in urban incidence, and the effect is even larger in the Poisson model, with both urban estimates significant at the 5% level.
7. Mechanisms: Limited Ad Effectiveness or Limited Exposure?
Taken together, the survey and administrative evidence point to limited average effects of the campaign. At the same time, the post hoc heterogeneity analysis suggests that the campaign’s measurable impacts were more concentrated among relatively advantaged households and in urban areas, whereas we find little evidence of impacts among poorer and rural populations, which face higher malaria risk. We interpret these SES and urban-rural patterns as descriptive heterogeneity rather than as evidence that one specific factor explains the difference in effects. We next ask what might explain these differences: Did they reflect lower effectiveness of the ad content among poorer and more malaria-vulnerable populations or lower exposure to the campaign?
On the one hand, the content may have been less persuasive for higher-risk and more disadvantaged populations, reflecting limitations in the identification of relevant personas or in the tailoring of campaign messages. On the other hand, these populations may have been less likely to receive the ads—for example, because platform delivery algorithms prioritized users with higher expected engagement (Lambrecht and Tucker 2019, Sapiezynski et al. 2022)—which would instead point to limitations in targeting and delivery. To shed light on these mechanisms, we rely on two complementary exercises. First, we study postcampaign ad recall, an imperfect but useful proxy for exposure. Second, we conduct a feed experiment in which assignment to campaign ads was randomized at the individual level and balanced across socioeconomic predictors, allowing us to assess whether lower- and higher-SES users responded similarly when potential exposure was made more comparable.
7.1. Postcampaign Recall
We measured ad recall at the end of the campaign. If exposure differed systematically across groups, we would expect this to be reflected in respondents’ ability to remember having seen the ads, although recall also depends on attention and memory. In the endline survey, conducted between December 15, 2020, and January 31, 2021, respondents were asked whether they recalled seeing an MNM ad on Facebook or Instagram since August 2020. Table 12 reports the results. Columns (1)–(2) show that treated respondents were 3 p.p. more likely to recall the campaign, corresponding to a 26% increase relative to the control mean. The logit estimates imply a nearly identical marginal effect. When we split the sample by SES, recall increases significantly by 4.7 p.p. among high-SES respondents (column (3)), whereas the corresponding estimate for low-SES respondents is a statistically insignificant at 1 p.p. (column (4)). Although the difference across the two groups is not statistically significant, the estimates are directionally consistent with greater campaign exposure among higher-SES respondents. We view this evidence as suggestive rather than conclusive because recall is not a direct measure of exposure.
|
Table 12. Ad Recall at Endline
| Full sample | High SES | Low SES | ||
|---|---|---|---|---|
| (1) | (2) | (3) | (4) | |
| OLS | Logit | OLS | OLS | |
| T | 0.030** | 0.266** | 0.047** | 0.010 |
| (0.014) | (0.124) | (0.022) | (0.021) | |
| T High SES coefficient | 0.039 | |||
| T High SES p-value | 0.253 | |||
| Observations | 1,492 | 1,492 | 744 | 748 |
| Adjusted R2 | 0.000 | 0.004 | −0.000 | |
| Pseudo R2 | 0.003 | |||
| Marginal effect | 0.030 | |||
| Mean in control | 0.114 | 0.114 | 0.111 | 0.117 |
| Standard deviation in control | 0.318 | 0.318 | 0.314 | 0.322 |
Notes. Each observation is an individual. The dependent variable equals one if the respondent reported to have seen any ad from Malaria No More on Facebook since last August. T is the treatment indicator. Responses collected in the endline survey between December 15, 2020, and January 31, 2021 are included. State fixed effects are included in all columns. Standard errors are clustered at the district level.
*; **; ***.
Table D.18 in the Online Appendix shows the results are robust to controls (column (1)) and explores heterogeneity by age and baseline concern about malaria. The campaign significantly increased ad recall among respondents younger than 26 and among those who reported being at least somewhat worried about malaria at baseline, whereas the estimated effects are close to zero and statistically insignificant among older and unconcerned respondents.
7.2. Individual-Level Feed Experiment
To distinguish between limited ad effectiveness and limited exposure to the campaign, we embedded a small-scale individual-level study in March–April 2021 at the end of the cross-sectional survey (see Section 5.2). The goal of this study was to make potential ad exposure more comparable across respondents with different socioeconomic characteristics. To do so, we randomized assignment to the ads at the individual level and balanced it across several predictors of SES, including dwelling type, caste, and education, as well as gender and respondents’ district-level treatment assignment in the original MNM campaign. By randomizing assignment within a reachable survey sample and using remarketing to reach most treated respondents, the experiment tests whether the ad content can affect behavior across households with different socioeconomic conditions.
Specifically, at the end of the cross-sectional survey, respondents were asked whether they would be willing to be contacted again within one to three months. To increase statistical power, we also recruited an additional group of participants in March 2021 using the same Meta ads and recruitment procedures as in the earlier survey samples. Among those who agreed to participate, individuals were randomly assigned to treatment or control, with the assignment balanced across the socioeconomic predictors described above. We then used Meta’s remarketing tool to place campaign ads directly in participants’ Facebook and Instagram feeds. In practice, because respondents completed our survey on Messenger, we were able to use anonymous identifiers to create a “Custom Audience” for the treatment group.19 We then handed over this audience to MNM, which remarketed ads from its own Meta pages for two weeks, closely mirroring the nationwide campaign.20 The remarketing campaign reached 2,119 individuals—about 90% of the total audience—at least once over the two-week period, with an average frequency of 4.9 ads per person. These ads appeared in users’ feeds alongside competing ads and organic content from various sources. Crucially, participants were unaware that the ads had been targeted to them on the basis of their survey participation. As a result, the remarketing campaign closely resembled the nationwide campaign, enhancing its ecological validity.
Two weeks after the end of the remarketing campaign, we invited respondents to complete a follow-up survey. Our analysis focuses on those who completed this survey; after cleaning, the final sample includes 1,542 respondents (Table 4 reports the cleaning procedure). Table D.19 in the Online Appendix presents the distribution of individual and household characteristics across the treatment and control groups. The sample is well balanced on most covariates, including age, gender, education, and bednet ownership. We observe a few imbalances in household size and unemployment, but their normalized differences are small and remain below 0.10.
We focus on two primary behavioral outcomes for which effects could plausibly emerge within our two-week window: bednet use and seeking medical attention in the hypothetical event of a high fever. To facilitate comparison, the survey questions closely mirror those used in the longitudinal panel survey (see Online Appendix B). To limit priming and survey effects, we elicited these outcomes only once, at follow-up. Our workhorse specification is a linear probability model estimated by OLS:
Here, i denotes an individual residing in district d and state z; Individual T is the individual-level treatment indicator for the remarketing campaign, whereas T is the district-level treatment indicator capturing potential persistent effects of the nationwide campaign; and denotes state fixed effects. We report heteroskedasticity-robust standard errors. The coefficient of interest is . We present estimates for the full sample and separately by SES group, using the same classification described above, and report robustness checks with controls and logit estimation.
7.3. Targeting Matters
Table 13 reports the effects of the individual-level remarketing treatment on bednet use and timely treatment seeking. Columns (1)–(3) focus on whether the respondent slept under a mosquito net the previous night, restricting the sample to households owning at least one bednet. In the full sample, the individual-level treatment increases bednet use by 6.9 p.p. . This implies an increase from 65.4% in the control group to 72.3% in the treatment group, or about an 11% increase. The magnitude of this effect is larger than the treatment effect estimated for the nationwide MNM campaign in Section 6.2. A plausible explanation is that the cluster-level estimates capture intent-to-treat effects, because only an unknown subset of survey respondents in treated districts was actually exposed to the campaign. By contrast, in the individual-level study the majority of treated respondents (about 90%) were reached by the remarketing campaign at least once. The estimates in Table 13 are therefore closer to treatment-on-the-treated effects.
|
Table 13. Sleeping Under Bednet and Timely Treatment Seeking (Individual-Level Study)
| Respondent used bednet the night before | Timely treatment seeking if high fever | |||||
|---|---|---|---|---|---|---|
| (1) | (2) | (3) | (4) | (5) | (6) | |
| Full sample | High SES | Low SES | Full sample | High SES | Low SES | |
| Individual T | 0.069** | 0.074* | 0.077** | 0.025** | 0.029 | 0.023 |
| (0.029) | (0.043) | (0.038) | (0.013) | (0.020) | (0.016) | |
| T | 0.014 | 0.051 | −0.007 | 0.005 | 0.012 | 0.006 |
| (0.029) | (0.043) | (0.039) | (0.013) | (0.020) | (0.016) | |
| Individuals T High SES coefficient | −0.006 | 0.005 | ||||
| Individuals T High SES p-value | 0.911 | 0.845 | ||||
| Observations | 1,043 | 520 | 523 | 1,542 | 770 | 772 |
| Adjusted R2 | 0.003 | −0.001 | 0.005 | 0.005 | 0.022 | −0.002 |
| Mean in control | 0.654 | 0.599 | 0.704 | 0.921 | 0.907 | 0.934 |
| Standard deviation in control | 0.476 | 0.491 | 0.457 | 0.270 | 0.291 | 0.248 |
Notes. Each observation is an individual. is the individual-level treatment indicator for the remarketing campaign. T is the indicator of district-level treatment assignment. The outcome in columns (1)–(3) is an indicator equal to one if the respondent reports having slept under a bednet the night before the survey; the sample is restricted to households owning at least one bednet. The outcome in columns (4)–(6) is an indicator equal to one if the respondent reports that they would seek treatment within 24 hours if they or a family member experienced a high fever. The SES index is constructed using PCA based on housing quality, access to health facilities, education, caste status, air conditioning ownership, and standardized household size. The index is standardized and split at the median to define High and Low SES groups. Columns (1) and (4) report full-sample estimates. Columns (2)–(3) and (5)–(6) report subgroup-specific treatment effects by SES. The table also reports the interaction coefficient from a specification that includes the standalone indicators and . Heteroskedasticity-robust standard errors are reported in parentheses.
*; **; ***.
Columns (2)–(3) show that these effects are very similar across socioeconomic groups. The estimated treatment effect on bednet use is 7.4 p.p. among high-SES respondents and 7.7 p.p. among low-SES respondents. Consistent with this, the interaction between the individual treatment and the high-SES indicator is close to zero and statistically insignificant (). Columns (4)–(6) turn to treatment-seeking intentions in the event of a high fever (100.4°F/38°C or above). The dependent variable equals one if the respondent reports that they would seek treatment within 24 hours. In the full sample, the individual-level treatment increases timely treatment seeking by 2.5 p.p. , corresponding to a 2.7% increase relative to the control mean. The point estimates are similar across SES groups: 2.9 p.p. for high-SES respondents and 2.3 p.p. for low-SES respondents. However, these subgroup estimates are imprecisely estimated, likely reflecting the loss of power from splitting the sample. The interaction between the individual treatment and the high-SES indicator is again small and statistically insignificant (), providing no evidence of heterogeneous treatment effects by SES.
Moreover, across both outcomes, we include the district-level treatment indicator from the nationwide MNM campaign. These coefficients are small and statistically insignificant throughout, suggesting limited persistent effects of the earlier campaign within this sample. Table D.20 in the Online Appendix shows that the results are robust to the inclusion of controls and to the use of the logit estimator (columns (1)–(2) and (5)–(6)). In addition, columns (3)–(4) and (7)–(8) estimate the effects separately for individuals residing in control and treatment districts of the nationwide campaign and show that the estimated effects are concentrated among respondents in control districts.
Overall, the individual-level experiment yields two main insights. First, among users assigned to and largely reached by the remarketing campaign, the ads increase both protective behavior and timely treatment-seeking intentions. Second, once assignment to the remarketing campaign is randomized and potential exposure is made more comparable across respondents with different socioeconomic backgrounds, the treatment effects are similar across higher- and lower-SES households. Taken together, these findings provide evidence that insufficient and differential exposure contributed to the limited average effects observed in the nationwide campaign.
8. Discussion and Implications for Practitioners
Our results suggest that the nationwide malaria prevention campaign generated limited average effects, with detectable impacts concentrated among relatively less vulnerable and more connected populations. A plausible interpretation of this pattern is the presence of targeting and delivery frictions: In the absence of explicit targeting toward high-risk users, the platform’s delivery algorithm may have allocated impressions disproportionately toward users who were cheaper and easier to reach rather than toward those most exposed to malaria risk. This concern is particularly relevant because the nationwide campaign was optimized for engagement. For a public health intervention, that objective is imperfect, because it may direct spending toward users who are more likely to click or react online rather than toward those for whom the expected health gains are greatest. Our individual-level experiment reinforces this interpretation. When assignment to the remarketing campaign is randomized and potential exposure is made more comparable across respondents with different socioeconomic characteristics, we detect positive effects in the overall sample and no clear evidence of heterogeneous effects by SES. This pattern is more consistent with targeting and delivery frictions than with large differences in the effectiveness of the ad content itself.
Additional evidence is consistent with this mechanism. Our district-level analysis of recruitment ad costs (Table 1) shows that the CPM was systematically lower in larger and more populous districts and in districts that were more socioeconomically advantaged, with a higher share of households living in solid dwellings and greater mobile phone penetration. Because the recruitment ads were also optimized for engagement-related objectives, much like the nationwide malaria campaign, these cost patterns are informative about likely delivery dynamics. Taken together, they suggest that engagement- and cost-based delivery tilted exposure toward relatively advantaged and more connected populations, helping explain why the campaign produced detectable effects primarily among higher-SES households and in urban areas. At the same time, we cannot identify the precise source of the differential exposure observed in the nationwide campaign. Higher CPM may reflect lower social media use among more vulnerable users, smaller reachable audiences, poorer internet connectivity, or differences between vulnerable users on the platform and vulnerable users in the broader population.
The main managerial implication is therefore not that social media campaigns cannot work for vulnerable populations but that achieving such impacts may require more deliberate targeting and a willingness to incur higher delivery costs than an engagement-maximizing strategy would imply. More broadly, our findings point to a three-step approach for practitioners. First, organizations should invest in formative research to identify the populations for whom the intervention is likely to generate the greatest gains, as well as the groups that are systematically harder and costlier to reach. Second, they may need to go beyond the basic targeting tools offered by ad platforms and rely on more advanced options—such as lookalike models or first-party data-based custom audiences—to improve inclusion of underserved groups in campaign delivery. Third, campaign managers should explicitly weigh the tradeoff between maximizing on-platform engagement and achieving meaningful off-platform behavioral change. In settings like ours, higher delivery costs may be precisely the price of reaching those who stand to benefit the most.
Addressing information gaps and building technical capacity is important, but may not be sufficient. Managerial incentives also need to be realigned. When marketing teams are evaluated primarily on engagement metrics, there is little incentive to invest in reaching harder-to-engage and higher-cost populations, even if these groups stand to benefit the most. Moreover, ongoing changes in privacy policies that restrict access to the data needed for targeting and measurement may further complicate the use of sophisticated campaign design and evaluation tools. To better align social media campaigns with public health goals, incentive structures should incorporate offline outcomes as key performance indicators. Although reaching high-risk populations may entail higher delivery costs, the developmental return per person reached is likely to be substantially greater.
9. Cost-Effectiveness
In this section, we provide a benchmark calculation of the campaign’s cost-effectiveness based on the administrative health-facility results, which capture objectively recorded malaria outcomes at the population level. Using the most conservative estimates from Table 11, the campaign reduced incidence by 3.12 cases per million people per month overall and by 6.1 in urban areas. Treating these as average monthly effects over September 2020–May 2021, the implied cumulative reductions are 28.08 and 54.90 officially recorded cases per million people.
We then extrapolate these effects from the three study states to the 22 states targeted by the MNM national campaign. This extrapolation assumes that the effectiveness observed in the study states is informative about the broader rollout and should therefore be interpreted cautiously. With a total population of roughly 1.2 billion across the 22 states, less approximately 100 million residents in control districts of the study states, potential reach was about 1.1 billion individuals, implying between 30,888 (overall-incidence) and 60,390 (urban-incidence) officially recorded cases were averted.
Against an advertising cost of US$202,000 this implies about US$6.50 per case averted under the overall incidence estimate and US$3.40 under the urban incidence estimate. These are benchmarks rather than exact welfare estimates: They likely overstate the cost per true case averted because the World Malaria Report indicates true incidence is roughly 22 times officially recorded incidence (WHO 2021), which would push the cost per case averted to well below one dollar.21
These figures are of a similar order of magnitude to those reported for social media campaigns promoting COVID-19 vaccination in developed country settings (Athey et al. 2023) and for insecticide-treated net distribution (Conteh et al. 2021), although the mechanism here operates through information and behavior change rather than direct provision of prevention tools. The broader implication is that social media campaigns can be cost-effective public health interventions, but their cost-effectiveness depends on who is reached. In our setting, the most favorable estimates come from urban areas; in lower-connectivity and rural populations, the campaign produced little detectable impact, implying that digital advertising should be viewed as a complement to, rather than a substitute for, offline malaria control efforts. Whether better targeting would also improve cost-effectiveness is ultimately an empirical question, because the added health benefits from reaching more vulnerable groups must be weighed against the likely higher ad costs.
10. Conclusions
Social media campaigns are increasingly used to pursue public health objectives, yet measuring their effectiveness remains difficult. Platform metrics such as clicks, reactions, and ad recall provide only a partial picture when the outcomes of interest are offline behaviors and health. Malaria prevention campaigns illustrate this challenge particularly clearly. Malaria disproportionately affects poorer and more rural populations in India, but these are also the populations that may be harder or more costly to reach through engagement-optimized digital advertising. Assessing effectiveness therefore requires measuring whether campaigns change real-world prevention and treatment behaviors.
We evaluate a nationwide malaria prevention campaign implemented by Malaria No More on Facebook and Instagram in India. The campaign promoted bednet use and timely treatment-seeking through behaviorally informed ads tailored to different audience personas. It reached roughly 130 million users over six months, with an average frequency of 3.6 impressions per reached user. To study its effects, we combine a district-level cluster-randomized design with original survey data, administrative health facility records, and a follow-up individual-level feed experiment.
Our main finding is that the campaign generated limited average effects. In the survey data, average effects on malaria-related protective behaviors, treatment seeking, and self-reported incidence are generally small and insignificant. At the same time, post hoc heterogeneity analyses suggest that detectable effects were more concentrated among relatively advantaged households. In particular, among higher-SES households, bednet use increased during the campaign and self-reported malaria incidence declined afterward, whereas estimates for lower-SES households are small and indistinguishable from zero. Administrative data point to a related urban-rural pattern: We find no clear overall decline in malaria incidence, but monthly incidence in urban health facilities fell by 6.2 cases per million people, with no detectable effect in rural areas.
These patterns raise an important question: Were the ads ineffective for the populations most at risk, or were those populations less likely to be exposed? To shed light on this, we conducted a second experiment that randomized assignment to ads at the individual level using the platform’s remarketing tools. In that setting, where potential exposure was made more comparable across SES groups, the campaign increased bednet use and timely treatment-seeking intentions, with no detectable differences by SES. Taken together, the evidence is consistent with targeting and delivery frictions contributing to the limited average effects of the nationwide campaign.
One limitation of the study is that the intervention took place during the first year of the COVID-19 pandemic. This context may affect external validity, because healthcare access, media use, and risk perceptions were unusually shaped by the pandemic. Still, it is unlikely to threaten the internal validity of the experimental design.
Overall, our findings provide a cautious assessment of what social media advertising can achieve in public health. The results suggest that such campaigns can affect behavior and may be cost-effective in some settings, but that engagement-based delivery does not necessarily direct exposure toward the populations with the highest expected health gains. More broadly, the paper shows the value of combining first-party survey data, administrative outcomes, and experimental variation in delivery to evaluate digital campaigns beyond platform metrics. This approach can help organizations measure real-world impact and design more deliberate targeting strategies when privacy constraints and platform optimization limit the reach of standard advertising tools.
This research is part of the entertainment-education program of the World Bank’s Development Impact Department (DIME). Computational replicability was verified by DIME Analytics. The authors thank the study partners at Facebook’s Campaigns for a Healthier World initiative and Upswell, in particular, Nisha Deolalikar, Sarah Francis, and Drew Bernard. The authors also thank Malaria No More for their collaboration, as well as attendees at CEGA-DIME Measuring Development Conference, Centro de Investigacion y Docencia Economicas seminar, Columbia Business School seminar, Marketing Science Annual Conference, Marketing Science DEI Conference, MIT’s Annual Conference on Digital Experimentation, Quantitative Marketing and Economics Conference, SSRC Workshop on the Economics of Social Media, Universitat Autonoma de Barcelona seminar, and Yale School of Management seminar for helpful comments and discussions. The paper only reflects the opinion of the authors and not the opinion of any organizations. All remaining errors are the responsibility of the authors. The research received ethical clearance from the Columbia University Institutional Review Board (AAAU6317).
1 Social marketing entails applying commercial marketing techniques to influence the behavior of target audiences to enhance personal welfare and societal well-being (Andreasen 1994).
2 For example, 75% of households in our baseline survey own mosquito nets, but only 70% of those households report using them regularly, implying that a substantial share remains at least partially unprotected.
3 Brand Lift studies, offered by platforms such as Meta and Google, typically measure recall, sentiment, and purchase intent using short surveys administered shortly after ad exposure.
4 These metrics come from https://napoleoncat.com/stats/socialmedia-users-in-india/2020/ and https://datareportal.com/reports/digital-2021-india, accessed in May 2025.
5 This emphasis is also consistent with Indian malaria policy: The National Framework for Malaria Elimination highlights mosquito nets, prompt diagnosis, and early treatment as key malaria control tools (NVBDCP 2016). Basic mosquito nets in India cost about US$1.50–US$5.00, making them affordable for many households.
6 Details on persona development and examples of the creatives are provided in Online Appendix A. For example, humorous and meme-styled content was developed for younger audiences, whereas ads aimed at older audiences emphasized family roles and the importance of involving other household members in testing and prevention.
7 Although we do not observe the full initial set of creatives, an MNM report documents the 22 ads retained during the streamlining process (Figures A.1–A.7 in the Online Appendix). Most emphasized bednet use, mosquito risk, and timely treatment seeking. Only one focused on malaria symptoms, and just two recommended the use of mosquito repellents.
8 We do not observe creative-level exposure by geography. Given the broad targeting criteria and the demographic diversity of treated districts, however, the mix of content delivered in the study areas likely resembled that of the national campaign.
9 Following the India DHS survey, respondents reported living in one of three housing types: nonsolid (e.g., mud, tin, straw), solid (durable materials like brick or concrete), or semisolid (intermediate between the two).
10 Details are available at https://dhsprogram.com/topics/wealth-index/Wealth-Index-Construction.cfm.
11 This is consistent with prior findings in India and elsewhere (Wanzirah et al. 2015).
12 HMIS is a monitoring system established by the Indian Ministry of Health and Family Welfare (MoHFW). The data set is widely used in health research in India and is generally considered to satisfy standard thresholds for completeness and reliability (Sharma et al. 2016).
13 Although data are available for earlier periods, changes in subdistrict boundaries and in the number of subdistricts over time make consistent matching across years infeasible. We therefore restrict attention to the period over which administrative boundaries remain stable.
14 Our cluster-level design was based on circles around major cities rather than district boundaries (Section 4.2). In control districts, some areas were excluded from the campaign using these circles. Although survey respondents were sampled from within the circles, district-level administrative records could still capture outcomes from exposed individuals, potentially biasing estimates toward zero. Subdistrict-level data reduce this concern by allowing a closer alignment with the defined circles.
15 Not all subdistricts contain both types of facilities. Among the 119 subdistricts in the benchmark sample, 116 have rural health facilities and 65 have urban health facilities.
16 The campaign did not explicitly promote bednet purchases, and we find no effect on bednet ownership.
17 This pattern is also consistent with the content of the campaign, which did not explicitly seek to promote bednet purchases.
18 The wealth index tabulations show a similar urban-rural gradient: 74.1% of the urban population is in the fourth or highest wealth quintile, whereas 53.8% of the rural population is in the two lowest quintiles (India IIPS 2022).
19 Remarketing allows ad campaigns to target individuals who have previously interacted with the advertiser—For example, they may have visited the advertiser’s website or shared some personal data with permission to use it for marketing.
20 This campaign featured the highest-performing ads from the earlier nationwide campaign, which had received a substantial budget (Figure A.7 in the Online Appendix). We broadly targeted these ads to all users, regardless of their characteristics.
21 Our estimates only reflect direct advertising costs, which is common practice in the marketing literature. The estimated cost of training sessions, implementation, and project management provided by the social media marketing firm—including nine months of technical support—was US$44,200. This excludes the cost of ad design.
References
- (2016) The economics of privacy. J. Econom. Literature 54(2):442–492.Crossref, Google Scholar
- (2018) Pathways to profits: The impact of marketing vs. finance skills on business performance. Management Sci. 64(12):5559–5583.Link, Google Scholar
- (1994) Social marketing: Its definition and domain. J. Public Policy Marketing 13(1):108–114.Crossref, Google Scholar
- (2023) Digital public health interventions at scale: The impact of social media advertising on beliefs and outcomes related to covid vaccines. Proc. Natl. Acad. Sci. USA 120(5):e2208110120.Crossref, Google Scholar
- (2014) Which products are best suited to mobile advertising? A field study of mobile display advertising effects on consumer attitudes and intentions. J. Marketing Res. 51(3):270–285.Crossref, Google Scholar
- (1995) Controlling the false discovery rate: A practical and powerful approach to multiple testing. J. Roy. Statist. Soc. Ser. B (Methodological) 57(1):289–300.Crossref, Google Scholar
- (2026) Marketing and economics of harm reduction: Evidence from conservation field experiments. J. Marketing Res. 63(2):340–363. Crossref, Google Scholar
- (2017) Do gender and business trainings affect business outcomes? Experimental evidence from Vietnam. Management Sci. 63(9):2885–2902.Link, Google Scholar
- (2013) Marketing social norms: Social marketing and the social norm approach. J. Consumer Behav. 12(1):1–9.Crossref, Google Scholar
- (2014) Eating for the better: A social marketing review (2000–2012). Public Health Nutrition 17(7):1628–1639.Crossref, Google Scholar
- (2021) Better marketing for a better world. J. Marketing 85(3):1–9.Crossref, Google Scholar
- (2010) Free distribution or cost-sharing? Evidence from a randomized malaria prevention experiment. Quart. J. Econom. 125(1):1–45.Crossref, Google Scholar
- (2015) Price subsidies, diagnostic tests, and targeting of malaria treatment: Evidence from a randomized controlled trial. Amer. Econom. Rev. 105(2):609–645.Crossref, Google Scholar
- (2021) Costs and cost-effectiveness of malaria control interventions: A systematic literature review. Value Health 24(8):1213–1222.Crossref, Google Scholar
- (2021) The future of marketing analytics and public policy. J. Public Policy Marketing 40(4):447–452.Crossref, Google Scholar
- (2004) Physiographic and entomologic risk factors of malaria in Assam, India. Amer. J. Tropical Medicine Hygiene 71(4):451–456.Crossref, Google Scholar
- (2022) Using social media to change gender norms: An experiment within Facebook messenger in India. Accessed May 1, 2026, http://hdl.handle.net/10986/38113.Google Scholar
- (2023) Outcomes of a social media campaign to promote Covid-19 vaccination in Nigeria. PLoS One 18(9):e0290757.Crossref, Google Scholar
- (2009) A behavior model for persuasive design. Chatterjee S, Dev P, eds. Proc. 4th Internat. Conf. Persuasive Tech. (Association for Computing Machinery, New York), 1–7.Google Scholar
- (2011) Privacy regulation and online advertising. Management Sci. 57(1):57–71.Link, Google Scholar
- (2021) Inefficiencies in digital advertising markets. J. Marketing 85(1):7–25.Crossref, Google Scholar
- (2017) Cluster Randomised Trials, 2nd ed. (Chapman & Hall/CRC, Boca Raton, FL).Google Scholar
India IIPS (2022) India national family health survey NFHS-5 2019-21. Accessed January 1, 2025, https://www.dhsprogram.com/pubs/pdf/FR375/FR375.pdf.Google Scholar- (2023) Inferno: A guide to field experiments in online display advertising. J. Econom. Management Strategy 32(3):469–490.Crossref, Google Scholar
- (2017) When less is more: Data and power in advertising experiments. Marketing Sci. 36(1):43–53.Link, Google Scholar
- (2020) Consumer privacy choice in online advertising: Who opts out and at what cost to industry? Marketing Sci. 39(1):33–51.Link, Google Scholar
- (2014) Strategic roles for behaviour change communication in a changing malaria landscape. Malaria J. 13(1):1.Crossref, Google Scholar
- (2019) Algorithmic bias? An empirical study of apparent gender-based discrimination in the display of stem career ads. Management Sci. 65(7):2966–2981.Link, Google Scholar
- (2004) Insecticide-treated bed nets and curtains for preventing malaria. Cochrane Database Systems Rev. 22004(2):CD000363.Google Scholar
- (2014) Online ads and offline sales: Measuring the effect of retail advertising via a controlled experiment on Yahoo! Quant. Mark. Econom. 12(3):235–266. Crossref, Google Scholar
- (2015) Marketing science in emerging markets. Marketing Sci. 34(4):473–479.Link, Google Scholar
NVBDCP (2016) National Framework for Malaria Elimination in India (2016–2030) (Directorate of National Vector Borne Disease Control Programme, Directorate General of Health Services, Ministry of Health & Family Welfare, Government of India, New Delhi, India).Google Scholar- (2020) Conducting Surveys and Interventions Entirely Online: A Virtual Lab Practitioner’s Manual (World Bank, Washington, DC).Google Scholar
- (2022) Algorithms that “don’t see color” measuring biases in lookalike and special ad audiences. Conitzer V, Tasioulas J, Das S, Davis J, Firth-Butterfield K, eds. Proc. 2022 AAAI/ACM Conf. AI, Ethics, Soc. (Association for Computing Machinery, New York), 609–616.Google Scholar
- (2016) Quality of health management information system for maternal & child health care in Haryana State, India. PLoS One 11(2):e0148449.Crossref, Google Scholar
- (2019) Using social media to create engagement: A social marketing review. J. Soc. Marketing 9(2):204–224.Crossref, Google Scholar
- (2019) The economic cost of malaria at the household level in high and low transmission areas of central India. Acta Tropical 190:344–349.Crossref, Google Scholar
- (2020) Socioeconomic determinants of community knowledge and practice in relation to malaria in high- and low-transmission areas of central India. J. Biosoc. Sci. 52(3):317–329.Crossref, Google Scholar
- (2014) Micro-loans, insecticide-treated bednets, and malaria: Evidence from a randomized controlled trial in Orissa, India. Amer. Econom. Rev. 104(7):1909–1941.Crossref, Google Scholar
- (2013) The impact of a student-driven social marketing campaign on college student alcohol-related beliefs and behaviors. Soc. Marketing Quart. 19(1):52–64.Crossref, Google Scholar
- (2018) Privacy, algorithms, and artificial intelligence. The Economics of Artificial Intelligence: An Agenda (University of Chicago Press, Chicago, IL), 423–437.Google Scholar
- (2021) Marketplace literacy as a pathway to a better world: Evidence from field experiments in low-access subsistence marketplaces. J. Marketing 85(3):113–129.Crossref, Google Scholar
- (2021) Investigating the effects of excise taxes, public usage restrictions, and antismoking ads across cigarette brands. J. Marketing 85(3):150–167.Crossref, Google Scholar
- (2015) Mind the gap: House structure and the risk of malaria in Uganda. PLoS One 10(1):e0117396.Crossref, Google Scholar
We Are Social (2025) Digital global overview report. Report, We Are Social, London, UK.Google ScholarWHO (2018) World Malaria Report 2018 (World Health Organization, Geneva).Google ScholarWHO (2021) World Malaria Report 2021 (World Health Organization, Geneva).Google ScholarWHO (2025) WHO Guidelines for Malaria (World Health Organization, Geneva).Google ScholarWorld Bank (2022) World Bank Data (World Bank, Washington, DC).Google Scholar- (2021) Social media, influencers, and adoption of an eco-friendly product: Field experiment evidence from rural China. J. Marketing 85(3):10–27.Crossref, Google Scholar
Dante Donati is an assistant professor in the Marketing Division at Columbia Business School. His research examines economics of digital platforms and their effects on firm decisions, consumer behavior, and well-being. He is a co-founder of Virtual Lab, and his work has been supported by the Russell Sage Foundation, Columbia’s Digital Future Initiative, and the Bernstein Center, among others. His research appears in journals including Management Science, Marketing Science, and PNAS.
Nandan Rao is a PhD candidate in applied economics at Universitat Autònoma de Barcelona. His research focuses on external validity in online experiments—developing adaptive survey sampling methods via digital ad platforms, designing ecologically valid field experiments for digital interventions, and building open-source tools for running randomized studies entirely online. He holds an MRes in economics, an MSc in data science, and a BFA in film.
Victor Orozco-Olvera is a senior economist in the World Bank Group’s Development Impact Group, where he founded and leads the research program on entertainment media for social impact. His research sits at the intersection of development economics, artificial intelligence, behavioral science, and mass media, with a particular focus on using experimental methods to evaluate how entertainment media can promote social and behavioral change in low- and middle-income countries.
Ana Maria Muñoz Boudet is a lead economist in the Gender Department at the World Bank, where she leads research on gender equality, poverty, and the behavioral and human capital drivers of economic outcomes. She is a co-author of the World Development Report 2012: Gender Equality and Development and led analytical work, impact evaluations, and technical assistance across Latin America, Caribbean, Europe, Central Asia, Africa, and South Asia. She holds an MS from the London School of Economics.