


Microfoundations of Problem Solving: Attentional Engagement Predicts Problem-Solving Strategies
Abstract
Organizations use a plethora of methods and tools to help their members solve problems effectively. Yet the specifics of how individuals solve problems remain largely unexplored. We propose and test a cognitive model of problem solving that integrates dual process theories into the attention-based view. The model suggests that diverse problem-solving strategies emerge in response to how individuals deliberate. Three studies provide observational and causal evidence in support of our model. The first study explores the strategies managers use to solve problems. We use think-aloud protocols combined with content, sequence, and cluster analyses to extract the key differences in how experienced managers solve problems. Two problem-solving strategies emerge from the data: one emphasizes mental activities related to framing, and the other emphasizes mental activities related to implementation. In the second study, we use a mixed factorial experimental design and mouse-tracking analysis to uncover the causal mechanism that explains the emergence of these two strategies. We then retest our hypotheses in a third, preregistered, study. We find that manipulating attention toward mental activities related to framing increases deliberation aimed at restructuring the problem elements. In contrast, directing attention toward mental activities related to implementation increases deliberation on the potential contingencies and consequences of the solution. Our findings provide empirical evidence about how problems are actually solved and support the idea that attentional processes are malleable enough to affect the choice of problem-solving strategies.
History: This paper has been accepted for the Organization Science Special Issue on Experiments in Organizational Theory.
Funding: For Study 1, funding from EC NEST-2006-PATH-Cul, CID-Cultural and Innovation Dynamics: FP6-043345 is gratefully acknowledged.
Supplemental Material: The supplemental material is available at https://doi.org/10.1287/orsc.2019.13213.
1. Introduction
Managerial and consulting practice provides an ever-expanding array of methods to help organizations solve problems. Tools such as total quality management, Six Sigma, stage-gate models, lean management, design thinking, agile development, and countless others offer the promise of reliable decisions, predictable outcomes, and improved performance (for a critical assessment, see Benner and Tushman 2002). Despite their differences, something common across most methods is their reliance on either reflective problem and framing–oriented processes (e.g., scenario analysis) or pragmatic solution and implementation–oriented processes (e.g., prototyping). In this article, we build on the intuition that these methods, each in its own way, intend to achieve the same objective: managing the attention of the individuals involved in problem solving. The ability to manage attention over time is important as innovation processes normally take years to go from idea to market. For example, Schulze and Brusoni (2022) provide qualitative evidence of how lean management regulates organizational attention and how this later controls problem-solving activities.
In this paper, we focus on the individual-level attentional processes behind problem solving. We take “a process approach,” as suggested by Posen et al. (2018, p. 240) and Langley et al. (1995, p. 276) who exhort us to “zoom in closer to the people and processes under study,” to answer the following research question: “how do individuals solve problems?” This question is not new but presents persistent challenges. Problem solving has been studied through different lenses and at differing levels of analysis. Studies at the organizational level (such as Nickerson and Zenger 2004) generally exclude analysis of individual-level microprocesses because of the “numerous individual-level decision biases [that] exist” (Baer et al. 2013, p. 200). In contrast, we focus on individuals because, even if they are biased, their initial problem definitions heavily impact the problems their organizations will solve (Klingebiel and De Meyer 2013, Posen et al. 2018). To do this, we use the attention-based view (ABV) as a lens to examine the cognitive processes underpinning problem solving (Ocasio 1997, 2011). The ABV defines strategy as “a pattern of attention” rather than a set of actions (Ocasio and Joseph 2018, p. 289). Thus, by observing patterns in how individuals engage their attention, we can uncover the strategies they employ for solving problems.
This paper uses a novel combination of think-aloud protocols and content, sequence, and cluster analyses to describe how problems are solved (Ericsson and Simon 1980, Lipshitz and Bar-Ilan 1996, Fernandes and Simon 1999). We find that individuals use two strategies to solve problems: one strategy emphasizes mental activities related to framing, and the other emphasizes mental activities related to implementation. We designed Study 2 to explore the causal mechanisms that explain the emergence of these two problem-solving strategies. We employ a mixed factorial experimental design to manipulate participants into directing their attention toward one of the two distinct mental activities and observe their actions. We use mouse-tracking analysis to uncover which problem-solving strategy is enacted and then examine the underlying cognitive processes that precede its formation (Yu et al. 2012, Öllinger et al. 2013, Fedor et al. 2015). These analyses confirm that manipulating attention led to the two strategies found in Study 1. To test the robustness of our findings, we ran Study 3, in which we preregistered the research design and hypotheses of Study 2 and replicated its findings.
Overall, this paper provides three core contributions. First, we extend the ABV by integrating Ocasio’s (2011) three varieties of attention (attentional selection, engagement, and perspective) into a single model that explains how each variety contributes to the problem-solving process. Ocasio (2011, p. 1288) defines attentional engagement as “the process of intentional, sustained allocation of cognitive resources to guide problem solving, planning, sensemaking, and decision making.” We propose and empirically test how differences in attentional engagement lead to the emergence of differences in the attention perspectives (i.e., enacted strategies) employed to solve problems.
Second, we integrate the default-interventionist model in cognitive sciences (Wason and Evans 1974, Chaiken and Trope 1999, Kahneman 2011, Evans 2018) into the ABV, developing the arguments of Ocasio (2011) and Laureiro-Martinez and Brusoni (2018). We show that the concept of deliberation, normally black-boxed into type 2 processing, consists of two qualitatively distinct mental activities—framing and implementation—that are fundamental to understanding how individuals choose which problem-solving strategies to enact. We manipulate attentional engagement and show that increasing attention to mental activities related to framing leads to a problem-focused strategy, whereas increasing attention to mental activities related to implementation leads to a solution-focused strategy. Our model of attentional engagement and our finding that deliberation takes place in two qualitatively different ways give a solid cognitive foundation to recent developments in decision-making research that build upon the analysis of how managers—entrepreneurs and executives—solve problems and take decisions in uncertain environments (e.g., Camuffo et al. 2020, Ghosh and Wu 2021, Ehrig and Schmidt 2022, Piezunka and Schilke 2023).
Finally, this paper provides a methodological contribution by showing the benefits of combining inductive observational methods (Study 1) with theory-testing experiments (Studies 2 and 3). We use Study 1 to “isolate processes in a controlled environment” (Schilke et al. 2019, p. 233) and let hypotheses emerge through the disciplined observation of behavior without imposing specific assumptions on the data or on human behavior. From there, we engage in a pragmatic process of falsifying hypotheses in Studies 2 and 3 (Popper 1959). This multistage process of theory-building and theory-testing is crucial for developing robust experimental designs without relying on the formal modeling and/or deductive theorizing that are common in other fields.
2. Theory: Models of Problem Solving
During the past century, scholars proposed a wealth of models that aimed to capture how individuals solve problems (Dewey 1910). Simon’s (1947) foundational model unbundled problem solving into three phases (intelligence gathering, design, and choice). Many more models built on it, emphasizing different elements of problem solving. For example, models used in management emphasize the representation and definition of the problem because the problems studied tend to be ill-structured (e.g., Mintzberg et al. 1976, Schwenk 1985). Models in cognitive neuroscience, however, emphasize the process of valuing alternatives and assessing the outcome of decisions because they tend to focus on well-defined problems (e.g., Rangel et al. 2008). Given that difference, it is no surprise that Schwenk (1985) divided what Simon (1947) called “intelligence gathering” into goal formulation and problem identification (Baer et al. 2013, Posen et al. 2018). In cognitive neuroscience, because of a focus on more well-structured problems, research has centered on Simon’s choice phase, unbundling it into valuation and action selection. Furthermore, problem solving is extended by adding phases after Simon’s choice: implementation in the case of Schwenk (1985) and outcome evaluation in Rangel et al. (2008). In the final column of Table 1, we provide a synthesis of some of the most influential models.
|

Table 1. Comparison of Distinctive Problem-Solving Models from Management and Other Fields with Their Respective Phases
| Prior management models | Neuroscience model | Combined problem-solving model | ||
|---|---|---|---|---|
| Simon (1947) | Mintzberg et al. (1976) | Schwenk (1985) | Rangel et al. (2008) | |
| Intelligence gathering | Recognition | Goal formulation and problem identification | Representation | Frame stating (FS) |
| Diagnosis | Frame assuming (FA) | |||
| Design | Search | Strategic alternative generation | Direction setting (DS) | |
| Design | ||||
| Choice | Screen | Evaluation and selection | Valuation | Evaluation (EV) |
| Evaluation | Action selection | Decision (DE) | ||
| Authorization | ||||
| — | — | Implementation | — | Implementation (IM) |
| — | — | — | Outcome evaluation | Implementation evaluation (IE) |
Interestingly, despite the different emphases, there is overall agreement about which phases constitute a problem-solving process. However, there is persistent disagreement about their sequencing. Initially, scholars proposed that problem solving unfolds in an orderly sequence of phases from framing to testing possible solutions (Dewey 1910, Simon 1947). Such a linear model became a dominant notion in the problem-solving literature. For example, Bales and Strodtbeck (1951) and Witte et al. (1972) codify it into the “phase theorem,” that is, the idea that individuals follow phases in a linear and determined order when solving problems (see Figure 1). This idea has attracted criticism over the years. For example, Langley et al. (1995) propose a complex process made of dynamic links with no single distinguishable pattern. Nutt (1984, p. 446) notes that “the sequence of problem definition, alternative generation, refinement, and selection, called for by nearly every theorist, seems rooted in rational arguments, not behavior.” As von Hippel and von Krogh (2016) contend, there are good arguments and excellent examples to suggest that problem solving does not necessarily start with a phase of problem definition. Nevertheless, Balconi et al. (2010) present a defense of the linear model of innovation. And, indeed, evidence exists in favor of the linear model, or phase theorem, even at the individual level. Lipshitz and Bar-Ilan (1996) tested the validity of the linear model using retrospective reports of real-world problems. They find that individuals are more likely to attend to the phases of problem solving in a sequence similar to the one proposed by the linear model and shown in Figure 1.

Complementing this view, Fernandes and Simon (1999) show that, when thinking aloud, individuals solve complex and ill-structured problems through processes that depend on their professional background (lawyer, physician, architect, or engineer). Despite the limitations of their study (which included only two participants per condition), Fernandes and Simon’s (1999) work remains a remarkable example of how to study problem-solving processes in real time. Their work is in sharp contrast to the retrospective methodologies of most other studies.
To conclude, the existing evidence about how individuals solve problems presents mixed results and conflicting opinions. There is general agreement regarding the phases of problem solving. Yet there are conflicting views about their sequencing, that is, the process that guides the transitions between these phases toward the crafting of a solution. We need, therefore, to zoom in closer to study in detail how the sequencing of the different phases unfolds. To do so, we develop an empirical strategy that generates nonretrospective, fine-grained data about the processes of problem solving.
3. Study 1: The Microfoundations of Problem Solving
In this study, we examine the problem-solving processes of experienced managers by employing a combination of think-aloud protocols (Ericsson and Simon 1980, 1998) and content, sequence, and cluster analyses. We present our methodology in three parts: the problem, data collection, and data analysis.
3.1. The Karabayos Problem
The problems managers face often involve high-stakes decisions that can lead to outcomes that are hard to predict (Eisenhardt and Bourgeois 1988, Ghemawat 1991). Such problems are characterized by their complexity (Simon 1962, Levinthal 1997), lack of structure (Mintzberg et al. 1976, Fernandes and Simon 1999), ambiguity (Nickerson and Zenger 2004), novelty (Gavetti et al. 2005), and uncertainty (Posen and Levinthal 2012). In particular, managerial problems are “essentially unique” and offer no “opportunity to learn from trial and error” (Rittel and Webber 1973, pp. 163–164). As March et al. (1991, p. 1) note, “Organizations learn from experience. Sometimes, however, history is not generous with experience.” To solve these problems, managers need to employ cognition rather than experience (Gavetti and Levinthal 2000). As researchers, we need to present them with a task that mimics the problems they face. We chose the Karabayos problem (see Laureiro-Martinez and Brusoni 2018) as it shares many structural similarities with difficult situations that managers, team leaders, and entrepreneurs might face when leading their staff to a common goal. It was built following Fernandes and Simon’s (1999) guidelines, and thus, it is complex and ill-structured. It requires participants to imagine themselves as the leader of a small aboriginal tribe, managing limited resources and under threat from external invaders. The objective of the leader is to keep the tribe safe. The problem involves several uncertainties: the time available to achieve the goal, reactions from relevant stakeholders, and how the primary goal is defined, among others. Neither the possible actions nor their outcomes are well-defined, and there is a potentially infinite range of alternatives to explore. The Karabayos problem also presents participants with a high-stakes decision. The tribe might survive, or it might perish, and there is no possibility of receiving any process or potential performance feedback as events unfold. The problem is validated in a previous study (Laureiro-Martinez and Brusoni 2018). Given that the participants lacked experience in the context of tribal leadership, it has the advantage of requiring them to employ their cognition rather than their experience.
3.2. Data Collection: Think-Aloud Protocols
Think-aloud protocols follow a similar temporal flow as silent thinking (Ericsson 2003, Fox et al. 2011) and provide the researcher with a less obtrusive and more accurate reflection of the thinking process than retrospective studies (Ericsson and Simon 1998, Kuusela and Paul 2000). The think-aloud protocols we use were collected by Laureiro-Martinez and Brusoni (2018), but the coding and analyses carried out for the current study are completely different. For more information on data collection procedures, instruments, preregistrations, data, and data analysis for all studies discussed throughout, see the Open Science Framework repository for this paper: https://osf.io/eh5m2.
The sample comprises 49 participants. All were executives in multinational firms, founders of small companies, or unit managers in medium-sized organizations. Participants had at least four years of management experience, were responsible for budget allocation, and played a leadership role in a group with at least two other members. Fifteen participants were entrepreneurs, and 34 were experienced managers working in firms. The sample consisted of 40 men and 9 women with an average age of 35 years (standard deviation (s.d.) = 6.7 years, range = 24–47). Participants were offered financial and nonfinancial incentives for participating (detailed in Laureiro-Martinez and Brusoni’s (2018) supplemental materials document). The processing of think-aloud protocols is complex and time-intensive. For that reason, previous studies based on think-aloud protocols have worked with 15 or fewer participants (Isenberg 1986, Sarasvathy et al. 1998, Fernandes and Simon 1999, Grégoire et al. 2010). Our sample, although still small for quantitative analysis, is larger than those of similar studies.
3.3. Data Analysis
We relied on a series of techniques to uncover patterns in the granular data we collected by reducing its dimensionality in a structured way to prevent the discarding of meaningful insights. In this section, we provide an overview of the three main steps involved in the analysis; Section 8.2 in the supplemental materials presents more details and the rationale we followed when analyzing the data.
First, we used content-analysis techniques (Neuendorf 2002, Krippendorff 2012). Three independent raters were tasked with classifying the entirety of the protocols into separate chunks of thought and coding all of them into one of the seven phases of problem solving with any unintelligible verbalizations coded under babble. This is important: the entirety of what each participant verbalized was coded rather than just a few words or passages. This made the work of the raters harder: they were not selecting and categorizing a few words or sentences, but rather needed to interpret the entirety of the think-aloud protocols according to their meaning and divide it into chunks that belonged to one of the problem-solving phases or babble. This step was essential to avoid losing data as the entire protocol is to be considered an expression of the participants’ thinking. Table 2 presents the code for each of the seven problem-solving phases, a short description of the construct, the type of processes involved, and a quote representative of each specific code.
|
Table 2. Coding Definitions and Examples for Problem-Solving Phases
| Problem-solving phases | Description | Examples of verbalized thoughts (transcribed verbatim and then slightly edited for clarity) |
|---|---|---|
| Frame stating (FS) | Repeating the data mentioned in the text of the problem | “…[S]o our area want[s] to be left alone… [W]e are vulnerable[;] that we have understood for a good reason… I mean here… I do not have other information… Problems[,] diseases[,] a very small zone[,] lack of food…” |
| Frame assuming (FA) | Development of hypotheses not mentioned in the problem | “…[F]or millennia and before me, my father, my grandfather, and all the others one after the other… without having to face things that were more difficult [than] go[ing] hunting sometimes or collect[ing] fruit…” |
| Direction setting (DS) | Defining a general path of actions to be followed and generating proposals about what should be done | “…[W]e can also be a means for, a means to attract, for your region… [W]e can, we can make people, … we can, we can help you make... I do not know[,] a museum[,] something… [W]e can make lessons to teach city kids how to love the forest…” |
| Evaluation (EV) | Evaluating and judging the proposal and considering strategy without evaluating specific details | “…[S]ending two or three people can be interesting…[,] even though most likely those two or three won’t return…” |
| Decision (DE) | Making an explicit choice about specific intended actions | “…[H]owever, I will try to dialogue this for sure… I will try three key points[,] dialogue with another civilization… [S]upport from my group and… and an alternative in case of failure of dialogue…” |
| Implementation (IM) | Designing a sequence of actions required to carry out proposed actions | “…[S]lowly[,] calm[ly] we arrive in front of a representative… [W]e try with presents with kids[,] with women[,] and with men[,] with those most intelligent… [T]o craft a speech even with gestures [and] drawing[s,] we ask for help[,] and we see if they help… [I]f not[,] we try alone… [W]e do not explain where we are because if we explain… because if we have to try…[,] at least they don’t know where we are… [W]e return…” |
| Implementation evaluation (IE) | Evaluating the possible action outcomes | “…[I]f the two people [who were sent away earlier] should not return… [H]owever[,] 46 people will still be alive… [I]f instead [they] return with a positive answer[,] we have solved [the situation] at least for some time[,] long enough [for] the problem [at hand]…” |
We calculated the three independent raters’ average percentage of agreement; that meant calculating, for all chunks of text, the percentage of times the three raters coded each chunk to the same code (Gwet 2014). The average percentage of agreement was 92.9%. However, given that raters ought to interpret before classifying the data and code the whole text and not just preselected sentences or paragraphs, there could be substantial levels of chance agreement (Gwet 2014). Therefore, we calculated Cohen’s , a more stringent metric that corrects for possible evaluation biases and calculates the amount of agreement beyond chance (Cohen 1960). We obtained a moderate value of 0.51. Although some readers could have concerns about the level of interrater reliability, we agree with Bakeman et al. (1997, p. 357) who state that “no one value of Kappa can be regarded as universally acceptable” (Bakeman 2023). Furthermore, issues related to poor interrater reliability are not present in our paper as we followed the coding with a process of code convergence, which ensured we worked with a single sequence of problem-solving phases (Lombard et al. 2002, Neuendorf 2002).
That code convergence process consisted of three steps (the metrics presented were calculated before any convergence attempt). First, in cases of consensus among the three raters, we kept the agreed-upon code. Second, in cases of partial agreement (i.e., two raters selected the same code and one disagreed), we kept the value chosen by the majority. Third, in cases of complete disagreement among the raters (i.e., all three assigned different codes), two authors conferred and selected the appropriate code for the passage in question from the three codes proposed by the raters. At this stage, we removed the babble codes (which accounted for 2.8% of the protocols in total) from the sequence because they do not represent the problem-solving process. The output of this code convergence process resulted in each participant’s verbal protocol having each chunk of thought labeled into one, and only one, code. We used these codes as the starting point for the sequence analysis.
Using sequence analysis, we studied how managers transition between phases, that is, what is commonly known as “event-based time” (Pentland 2003a, p. 860) (also see Mintzberg et al. 1976, Lipshitz and Bar-Ilan 1996, Pentland 2003b, Salvato 2009). For illustration purposes, Figure 2 presents the problem-solving sequences of two participants (persons A and B) (Greve 2018). These two sequences show the problem-solving phases as color-coded rectangles. The two problem-solving sequences differ considerably although both employ all seven problem-solving phases. Person A focuses more on phases such as frame stating and assuming and only spends time on implementation and implementation evaluation toward the end. Person B, in contrast, performs frame assuming and frame stating on far fewer occasions and focuses on implementation and implementation evaluation earlier and more often.

Notes. Colors match the phases shown in Figure 1. Each rectangle represents one phase used by the participant to solve the problem. They are the same length as we focus only on the transitions between phases and not the time spent on each phase.
We used the transitions between phases to create a transition matrix from each sequence that reduces the variance between problem-solving processes and provides a data structure that permits comparison between participants (Gibbs et al. 1971, Abbott 1995, Pentland 2003b). Following Lipshitz and Bar-Ilan (1996), each cell in the matrix represents a transition between two phases. The 42 off-diagonal transitions originate in one phase and transition to another one. We normalized these values to obtain transition numbers comparable among participants; for each protocol, all transitions (i.e., off-diagonal cells) sum to one. We did this as the sequences have markedly different lengths and “normalizing by the length of the sequences makes the distance metric [i.e., comparisons] meaningful when dealing with sequences of differing length” (Pentland 2003b, p. 533). Finally, the think-aloud protocol did not allow us to record transitions within the same phase consistently. However, the time spent on a phase is important, so to account for that, we included the percentage of time spent in each of the seven problem-solving phases as a proxy for within-phase transitions. As a result, for each participant, we have 49 values that describe the participant’s problem solving: 7 represent the thinking time spent on each phase, and 42 represent transitions between phases.
In the third step, we used a clustering algorithm to identify the common patterns of attention that our participants used when solving a strategic problem, that is, the strategies they enacted (Ocasio and Joseph 2018). Specifically, we employed a clustering method called partitioning around medoids (Kaufman and Rosseeuw 1990) operationalized in the “pamk” function from the “fpc” library of the statistical programming language R (Hennig 2018). This method provides a categorical variable k that represents the best number of clusters for a data set. Instead of using average values (as in some other methods), pamk finds actual representatives (called medoids), which are the most central items of the potential clusters it then creates. It follows an iterative procedure to determine the optimal medoid for each cluster. The optimal medoids are those that provide the lowest average dissimilarity from respective cluster members. After the pamk method was completed, we were left with a dichotomous variable that assigned each think-aloud protocol to one of two clusters. Some readers could have concerns about the clustering procedure detracting from the richness of the data by subjectively deciding on a certain number of clusters. However, that is not an issue because the method we used, compared with other clustering methods, is consistent and deterministic. The categorical variable that it produces assigns the same observations to the same cluster every time—something that k-means and other nonmedoid clustering methods cannot do except in cases with clearly separate data sets.
In addition, we collected variables to explore alternative explanations for the clustering results. We recorded the total time spent solving the problem (protocol duration). We also asked participants to perform two further tasks to gauge their cognitive skills. Participants answered a 10-question Raven’s Progressive Matrices test correlated with abstract thinking (Laureiro-Martinez 2014). Participants also solved a tower of Hanoi task, which measures planning and generativity skills by recording the time it took participants to finish the task. Finally, we added controls for other demographic characteristics: age, gender (female = 1, male = −1), and profession (entrepreneur = 1, manager = −1).1
We also coded the performance of the solutions given to the Karabayos problem. Two raters (different from those who coded the problem-solving phases) were assigned all 49 protocols, and each rater independently assigned a score based on how well each participant’s solutions fulfilled the problem’s objective: to save the tribe. To do this, the raters first read the participant’s entire protocol to familiarize themselves with their problem solving. They then classified the solution into one of three categories: (a) solved the problem and reached the objective, (b) somewhat likely to achieve the objective, and (c) unlikely to achieve the objective. After this, the raters reread the protocol and scored the solution on a scale of 1 to 10. The scores exhibited an acceptable interrater agreement of 92.2%. To converge on a single score for each participant, the two raters conferred after all the scores were assigned to agree on those cases in which their respective scores differed. We used the agreed-upon score as our performance value.
3.4. Results
This section presents the results obtained from analyzing the participants’ think-aloud protocols.
3.4.1. Analysis of Processes for the Full Sample.
The participants’ transition matrices allowed us to study their attention patterns as they solved the Karabayos problem. Table 3 presents the average transition matrix for 48 of the participants.2 The rows denote the starting phase, and the columns denote the destination phase for a transition between phases. Each value denotes the frequency of that transition between phases. All transitions have a nonzero value: that is, all are present. This result helps us refute the linear model (Figure 1) and instead replicate findings from Mintzberg et al. (1976), who propose a problem-solving model in which transitions are complex and take place between all phases of problem solving. Overall, the most common transition is from direction setting (DS, third row) to evaluation (EV, fourth column), representing almost a sixth of all transitions. A total of 66.0% of all transitions are generated between directly neighboring phases (e.g., FS → FA or DE → EV), whereas longer jumps are less common. Second order transitions, such as frame assuming to evaluation (FA → EV), represent 19.5% of the total and third or higher order transitions the remaining 14.5%.
|
Table 3. Full Sample Transition Matrix
| → FS | → FA | → DS | → EV | → DE | → IM | → IE | ||
|---|---|---|---|---|---|---|---|---|
| Frame stating (FS) | → | 8.99 | 3.98 | 1.48 | 0.39 | 0.25 | 0.04 | |
| Frame assuming (FA) | → | 7.23 | 6.64 | 2.10 | 0.53 | 0.61 | 0.09 | |
| Direction setting (DS) | → | 1.94 | 2.74 | 16.76 | 1.18 | 3.01 | 0.20 | |
| Evaluation (EV) | → | 2.75 | 2.68 | 11.87 | 3.10 | 2.33 | 0.44 | |
| Decision (DE) | → | 0.73 | 0.39 | 0.70 | 1.87 | 1.02 | 1.03 | |
| Implementation (IM) | → | 0.39 | 0.75 | 1.67 | 1.67 | 0.99 | 2.89 | |
| Impl. evaluation (IE) | → | 0.21 | 0.39 | 0.63 | 0.97 | 0.73 | 1.63 | |
Note. Each cell value represents the percentage of transitions from the phase in the row to the one in the column.
In addition to transitions between phases, we also assess a participant’s allocation of attention by examining the percentage of time spent on each problem-solving phase. We find sharp differences in how participants allocate their thinking time to each phase. These differences are shown in column (2) of Table 4. Participants spend more than a quarter of their thinking time in the DS phase and just a 30th (3.3% of their time) on the decision (DE). These marked differences contrast heavily with the homogeneous allocation expected by the linear model of problem solving (Lipshitz and Bar-Ilan 1996).
|
Table 4. Percentage of Thinking Time Spent on Each Phase by the Full Sample, the Problem-Focused, and Solution-Focused Strategies and t-Tests Comparing the Two Strategies
| Full sample | Problem-focused | Solution-focused | t-test | ||
|---|---|---|---|---|---|
| Mean, % | Mean, % | Mean, % | p-value | t-statistic | |
| Frame stating (FS) | 10.6 | 14.2 | 5.7 | 0.000 | −4.183 |
| Frame assuming (FA) | 19.1 | 24.0 | 12.2 | 0.001 | −3.518 |
| Direction setting (DS) | 25.8 | 25.3 | 26.4 | 0.786 | 0.273 |
| Evaluation (EV) | 24.5 | 25.5 | 23.2 | 0.553 | −0.598 |
| Decision (DE) | 3.3 | 3.5 | 3.1 | 0.681 | −0.414 |
| Implementation (IM) | 13.0 | 6.3 | 22.4 | 0.000 | 6.509 |
| Impl. evaluation (IE) | 3.7 | 1.3 | 6.9 | 0.001 | 3.881 |
3.4.2. Emergence of Two Clusters.
We inputted the participants’ transition matrices into the partitioning around medoids clustering method. Each matrix has 49 variables: 7 represent the thinking time spent on each phase, and 42 represent transitions between phases. Two clusters emerged from the clustering method: one comprising 20 participants and the other 28. Each cluster represents an emergent pairing of the patterns of attention used by the participants in the study. Following Ocasio and Joseph (2018), we refer to these emergent patterns of attention as the participants’ problem-solving strategies.
3.4.3. Analysis of the Two Emergent Strategies.
The first step in characterizing each strategy is understanding how participants spend their time in each problem-solving phase. Columns (3) and (4) of Table 4 show stark differences between the two strategies regarding the time allocated to the different problem-solving phases. This table presents the percentage of the thinking time spent by participants following each problem-solving strategy on each phase of problem solving. Those following the problem-focused strategy spent twice as long in the frame stating (FS) and FA phases compared with participants employing the solution-focused strategy. Conversely, those following the solution-focused strategy spent almost four times longer in the implementation evaluation (IE) phase compared with participants using the problem-focused strategy. The amounts of time spent in the DS, EV, and DE phases were similar across both groups (t-test p-values > 0.5, |t-statistics| < 0.6). Therefore, we can argue that the stark difference between the two problem-solving strategies originates in how each strategy divides its time between framing (i.e., FS and FA) the problem and implementing (i.e., IM and IE) the solution.
The second step in characterizing each strategy is to understand its transition matrices. To do so, we generated the transition matrix for each strategy by averaging the transition matrices of the participants who followed it. We called the strategy followed by the first 28 participants the problem-focused strategy and that followed by the other 20 the solution-focused strategy for reasons outlined subsequently. Tables 5 and 6 present the average transition matrices of the participants who followed the problem- and solution-focused strategies, respectively.
|
Table 5. Problem-Focused Strategy Transition Matrix
| → FS | → FA | → DS | → EV | → DE | → IM | → IE | ||
|---|---|---|---|---|---|---|---|---|
| Frame stating (FS) | → | 11.61 | 4.70 | 1.81 | 0.47 | 0.34 | 0.07 | |
| Frame assuming (FA) | → | 10.21 | 7.77 | 2.21 | 0.36 | 0.16 | 0.07 | |
| Direction setting (DS) | → | 2.12 | 3.04 | 18.09 | 1.24 | 1.60 | 0.08 | |
| Evaluation (EV) | → | 3.93 | 3.42 | 11.71 | 3.63 | 0.99 | 0.16 | |
| Decision (DE) | → | 0.57 | 0.58 | 0.83 | 1.82 | 0.59 | 0.16 | |
| Implementation (IM) | → | 0.23 | 0.43 | 0.96 | 1.21 | 0.08 | 1.11 | |
| Impl. evaluation (IE) | → | 0.20 | 0.13 | 0.20 | 0.19 | 0.39 | 0.54 | |
Note. Each cell value represents the percentage of transitions from the phase in the row to the one in the column.
|
Table 6. Solution-Focused Strategy Transition Matrix
| → FS | → FA | → DS | → EV | → DE | → IM | → IE | ||
|---|---|---|---|---|---|---|---|---|
| Frame stating (FS) | → | 5.32 | 2.97 | 1.02 | 0.26 | 0.12 | 0.00 | |
| Frame assuming (FA) | → | 3.06 | 5.06 | 1.95 | 0.78 | 1.25 | 0.13 | |
| Direction setting (DS) | → | 1.69 | 2.31 | 14.88 | 1.11 | 4.98 | 0.35 | |
| Evaluation (EV) | → | 1.10 | 1.64 | 12.10 | 2.37 | 4.21 | 0.84 | |
| Decision (DE) | → | 0.94 | 0.13 | 0.51 | 1.94 | 1.63 | 2.23 | |
| Implementation (IM) | → | 0.62 | 1.19 | 2.66 | 2.32 | 2.27 | 5.37 | |
| Impl. evaluation (IE) | → | 0.23 | 0.75 | 1.23 | 2.08 | 1.22 | 3.15 | |
Note. Each cell value represents the percentage of transitions from the phase in the row to the one in the column.
Figures 3 and 4 show the transition matrices in Tables 5 and 6. The width of the lines is proportional to the transitions between phases in both directions. For example, the thickness of the line that connects FS and DE is proportional to FS → DE + DE → FS. To remove the directionality, we replaced the directional arrows of Figure 1 with lines. Although simplified, the transitions shown in Figures 3 and 4 are much more complex than the linear process depicted in Figure 1. They show stark differences in how the two strategies transition between phases when problem solving. Figures 3 and 4 show that the biggest difference between the two strategies is how certain phases are attended to. The problem-focused strategy (Figure 3) has many more cycles between the FS and FA phases. In contrast, the solution-focused strategy (Figure 4) has many more cycles between the IM and IE phases.3
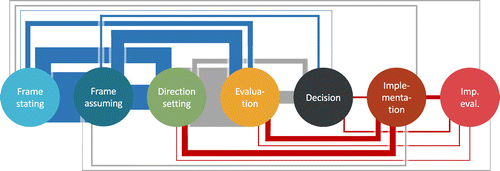
Note. The lines connect the transitions between phases, and the thickness of the lines is proportional to the number of transitions made by this strategy.
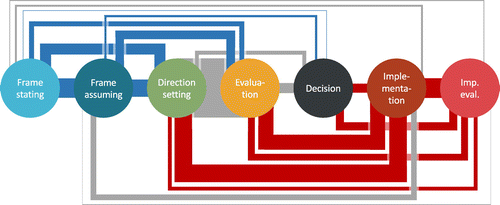
Note. The lines connect the transitions between phases, and the thickness of the lines is proportional to the number of transitions made by this strategy.
The third step in characterizing each strategy is to determine the origin of the differences in time spent and transitioning between phases uncovered in the previous steps. These differences can occur in two ways: either both strategies transition just as often to the specific phases and spend longer engaging their attention on each phase or they transition more often to specific phases and engage their attention on those phases for a similar amount of time during each visit. Further analyses demonstrate it is the latter explanation that drives the differences. We find that, although participants following the problem-focused strategy spend twice as long in the framing phases (FS and FA) as those following the solution-focused strategy, they spend just 16% longer every time they attend to the framing phases. This slight difference appears because participants following the problem-focused strategy transition to these phases 1.8 times more often than those following the solution-focused strategy.
Similarly, followers of the solution-focused strategy spend 3.8 times as long in the implementation phases (IM and IE) compared with those following the problem-focused strategy. Yet they spend 12% less time every time they attend to the implementation phases of problem solving. This slight decrease appears because participants following the solution-focused strategy transition to the implementation phase 4.4 times more often than those using the problem-focused strategy. Therefore, the strategies differ in how often they transition to the framing and implementation phases and not in the time spent during each visit to the specific problem-solving phases. In other words, the strategies differ in how they engage attention.
3.4.4. Alternative Explanations.
Table 7 contains the descriptive statistics and zero-order correlations between the strategy categorical variable (−1 for the problem-focused strategy and 1 for the solution-focused strategy) and further variables that could explain the differences in how participants engage their attention in the different phases of problem solving. Interestingly, the solution-focused strategy is positively correlated to performance: participants who used this strategy performed about 14% (t-test p-value = 0.003, t-statistic = 3.10) better than those who followed the problem-focused strategy. Similarly, protocol duration was correlated to performance. However, as protocol duration and strategy are uncorrelated, each might provide a separate avenue for higher performance.
|
Table 7. Descriptive Statistics and Zero-Order Correlations for the Karabayos Problem
| 1. | 2. | 3. | 4. | 5. | 6. | 7. | 8. | |
|---|---|---|---|---|---|---|---|---|
| 1. Performance | 1 | |||||||
| 2. Strategy: solution-focused | 0.404 (0.004) | 1 | ||||||
| 3. Protocol duration, min. | 0.464 (0.001) | 0.120 (0.416) | 1 | |||||
| 4. Planning and generativity, s | 0.223 (0.146) | 0.268 (0.078) | 0.091 (0.559) | 1 | ||||
| 5. Abstract thinking | 0.245 (0.104) | 0.016 (0.919) | 0.174 (0.253) | −0.126 (0.417) | 1 | |||
| 6. Age, y | 0.059 (0.692) | 0.093 (0.529) | −0.192 (0.190) | −0.167 (0.278) | −0.018 (0.905) | 1 | ||
| 7. Gender: female | −0.102 (0.491) | 0.027 (0.855) | −0.174 (0.236) | −0.213 (0.164) | −0.174 (0.254) | −0.255 (0.081) | 1 | |
| 8. Profession: entrepreneur | 0.002 (0.989) | 0.068 (0.644) | 0.256 (0.079) | 0.106 (0.493) | 0.069 (0.654) | −0.126 (0.394) | −0.094 (0.527) | 1 |
| Mean | 6.13 | 20 of 48 | 12.57 | 285.6 | 7.444 | 35.46 | 9 of 48 | 15 of 48 |
| s.d. | 1.02 | 9.65 | 171.5 | 1.617 | 6.81 |
Note. p-values of pairwise correlations are shown in parentheses.
Furthermore, we found a mean difference at the 0.1 level between the planning and generativity skills of the participants with the participants who followed the problem-focused strategy achieving higher levels of planning and generativity than those who followed the solution-focused strategy (p-value = 0.088, t-statistic = 1.76). This difference further supports our impression that the problem-focused strategy redirects mental activities toward framing the problem—a key skill for solving the tower of Hanoi task used to measure planning and generativity (Laureiro-Martinez 2014). We did not find any correlation between strategy and protocol duration, cognitive skills, and the demographic characteristics of our participants. This result is significant because it shows that our findings do not seem to relate to cognitive ability, but rather to the participants’ thinking dispositions. Cognitive abilities are measures of mental efficiency (Stanovich et al. 2014), whereas dispositions are psychological characteristics of prevailing tendencies that underpin rational thought and action.
4. From Observation to Explanation
Study 1, observational in nature, let heterogeneity emerge directly from the problem-solving protocols. Our methodological approach did not superimpose any overarching category over alternative theoretical lenses or any specific number of clusters. The findings show that solving a problem involves multiple nonlinear transitions between different phases and, importantly, that those differences fall into two very distinct problem-solving strategies. The emergence of two clusters is not an obvious finding. Following the Langley et al. (1995) notion of chaotic and anarchic problem solving, our clustering could have converged into dozens of distinct problem-solving strategies because of small similarities between the sequences of the participants. Alternatively, we could have discovered a single, dominant process that described the more linear sequences developed by most participants, supporting the phase theorem espoused by Lipshitz and Bar-Ilan (1996). Instead, we found evidence for a middle ground: two strategies emerge with enough commonalities to bundle together the participants’ sequences and enough differences to separate them into two clearly differentiated clusters. Each strategy builds on a prevailing tendency (i.e., a disposition) to redirect attention to certain phases more than others.
These findings are also important because, as we note in the introduction, most innovation management methods assume that the tools and processes they mandate affect how individuals solve problems. In fact, recent studies about decision making have put forward the idea that decision makers (e.g., entrepreneurs) who take decisions relying on theory and scientific methods outperform those relying on intuition or similar heuristic approaches. For example, Camuffo et al. (2020) suggest that reliance on precise data about potential customers’ needs enables entrepreneurs to develop specific decision rules to choose among well-defined solutions—something that reminds us of our solution-focused strategy. Similarly, Ehrig and Schmidt (2022) highlight the importance of developing substantive theories that identify sets of assumptions or premises that imply a “conjecture… [that is] a belief that formulates a future possible state of the world that is associated with success” (p. 1289). This reminds us of our problem-focused strategy. Without over-speculating about the correspondences between our two clusters and hypothesis-testing or theory-building, we suggest that our approach might help us understand the cognitive microfoundations of this new class of decision-making models.
After Study 1, two key questions remain unanswered. One, what causes individuals’ problem-solving strategies? Two, can we induce different strategies? To answer these questions, we need to move from observation of the problem-solving strategies to explaining them in causal terms. To do so, we need a theory that gives us two building blocks: first, the framework to identify the phase-sequencing that emerges during problem solving; second, the candidate cognitive processes that drive the transitions across phases of problem solving. In the following, we build on the ABV and the results of Study 1 to put forward a cognitive model of problem solving that builds on attention and dual process theories. Based on this, we develop the hypotheses tested in Studies 2 and 3.
4.1. A Cognitive Model of Problem Solving
The ABV provides a meta-theory to explain how attention drives problem solving (Ocasio 1997, 2011; Ocasio and Joseph 2005; Schulze and Brusoni 2022). According to the ABV, strategy is defined by how attention is patterned when solving a problem rather than the actions taken to solve it—a crucial departure from prior theories—within the ABV, “what decision‐makers do will depend on what issues and answers they focus their attention on,” that is, how they engage their attention (Ocasio and Joseph 2018, p. 289).
We conceptualize Ocasio’s (2011) three varieties of attention not as categories to organize the literature but as part of a process. We depict this process as the sequence presented at the top of Figure 5. First, on the top left, attentional selection filters the most salient stimuli and determines the deliberation process that happens next. Attentional selection functions as an entrance between the environment presenting the problem and the processing devoted to the selected stimuli. Second, in the middle of Figure 5, attentional engagement plays a central role; it invokes sustained and executive attention to guide problem solving. This is when the thinking really happens. Attentional engagement operates through vigilance and supervision to focus time, energy, and effort on a selected set of environmental stimuli (Norman and Shallice 1986, Miller and Cohen 2001) until it results in a solution (i.e., the attentional perspective, shown on the top left of Figure 5). In other words, the behavioral outcome of attentional engagement is an attentional perspective (i.e., “a more general strategy of attentional processing,” Ocasio 2011, p. 3).
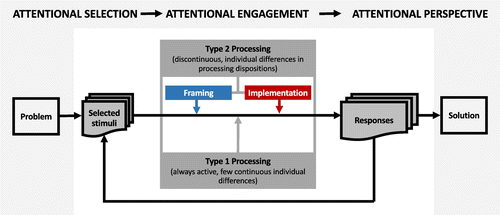
Notes. The three varieties of attention involved in problem solving appear on top. On the left, attentional selection lies at the interface between the problem environment and cognition. Attentional selection filters the most salient stimuli that will be processed. In the middle of Figure 5, attentional engagement processes the selected stimuli. It involves type 1 processing, always active, and type 2 processing that requires deliberation and effort and intervenes to engage different types of mental activities: framing or implementation. Attentional engagement generates responses that eventually become a solution. Attentional perspective, shown on the right of the figure, is the behavioral result of attentional engagement.
We propose attentional engagement as the core of our model and the focus of our extension of the dual process theories. Attentional engagement oversees the intentional, sustained allocation of cognitive resources to guide problem solving, planning, sensemaking, and decision making. It combines two processes: vigilance as sustained attention and executive attention as the supervisory control of attention (Norman and Shallice 1986, Miller and Cohen 2001). Vigilance and executive attention operate together to focus time, energy, and effort on a selected set of environmental stimuli.
These two processes recall dual process theories, which are ubiquitous in the cognitive sciences (James 1890, Wason and Evans 1974, Chaiken and Trope 1999, Kahneman 2011, Evans 2018) and increasingly in management (e.g., Laureiro-Martinez and Brusoni 2018). Dual process theories posit two types of processing that interact during problem solving. In the default-interventionist model, rapid type 1 processing is always active and acts both independently and without effort. Type 1 processes are responsible for generating intuitive, default responses (Evans and Stanovich 2013). Slower type 2 processing may or may not intervene and redirect attention in a reflective manner (Kahneman and Frederick 2002, Mishra et al. 2007, Kahneman 2011). Type 1 processing corresponds closely to automatic processing. Type 2 processing corresponds to controlled processing; it is slow, has a limited capacity, switches mental activities in a controlled manner, and provides reflective answers (Sherman et al. 2014). We rely on this existing default-interventionist account of the dual processes because it provides a solid theoretical grounding to understand the cognitive processes behind problem solving.
There are two major advantages of employing dual process theories to study problem solving. First, these theories leverage a process-based view that enables us to study how problems are solved. Second, such theories mirror the bottom-up (type 1) and top-down (type 2) views from Ocasio’s (2011) work. This combination enables us to create a model in which problem solving involves three varieties of attention: selective attention (the initial stimulus), attentional engagement (the deliberation process), and attentional perspectives (the resulting response or strategy). Attentional engagement plays the role of type 2 thinking, interrupting the automatic flow of type 1 thinking. Such a model helps us understand how attention is engaged and what role it plays when solving problems.
We propose, on the basis of Study 1, that attention can be engaged in two different ways, resulting in the selection of different stimuli and the use of mental activities that relate to the preferred strategy. This is important because, thus far, the kind of deliberation involved in type 2 processing has been studied as a unity. The two clusters found in Study 1, instead, identify two very different patterns of deliberation. We, thus, zoom in on the deliberation box of attentional engagement. In the center of Figure 5, we present framing and implementation, the two distinct mental activities that, we hypothesize, result in problem- or solution-focused strategies. Different individuals might differ in their dispositions. Whereas we remain agnostic about the origin of such dispositions, in the next section, we discuss if and how manipulating a disposition can lead to participants shifting their choice of problem-solving strategy.
4.2. A Framing Disposition to Problem Solving
Based on Study 1, we propose that the problem-focused strategy relies on a framing disposition, cycling more to and from phases related to framing the problem. This strategy emphasizes identifying the elements of the problem and connecting them, thus creating coherence from fragmented and disorganized elements (Fujita et al. 2014). We suggest that this might be the kind of deliberation engaged when following theory-based learning (Ehrig and Schmidt 2022). The framing disposition engages the attentional process, gaining an overall perspective on the problem rather than a disconnected sense of its parts. The “elements are arranged and integrated in a manner that allows them to work together to support and sustain the whole. […The problem] elements are relationally organized, such that knowledge of one element allows one to deduce logically or predict the other elements” (Fujita et al. 2014, p. 52). As framing continues, an integrative structure is created by setting priorities and constructing mental hierarchies (Hebb 1949; Carver and Scheier 1982, 1990; Kruglanski et al. 2002). This integrative structure constantly filters, identifies, and categorizes elements under different hypothetical relationships. In place of fragmented and chaotic elements and parts of plans, many thoughts become organized and ultimately integrated into a solution (Zelazo and Cunningham 2007).
Therefore, a framing disposition leads to a continuous structuring and restructuring of the problem elements by identifying them, connecting them, and creating hierarchical structures of hypotheses and assumptions. This notion is similar to theory-based learning as it envisions executives developing theories (i.e., sets of core assumptions) before going through a process of experimentation as they learn and manage uncertainty (Ehrig and Schmidt 2022). Thus, we hypothesize the following.
Increasing attention to mental activities related to framing leads to the enactment of a problem-focused strategy.
4.3. An Implementation Disposition to Problem Solving
Based on Study 1, we propose that the solution-focused strategy relies on an implementation disposition, cycling more to and from phases related to implementing solutions to the problem. This strategy emphasizes anticipating possible contingencies and evaluating future outcomes. As this is done repeatedly, attention is engaged in refining feasible solutions. This might be the kind of deliberation engaged in developing testable hypotheses (Camuffo et al. 2020). Inherent to implementation are the mental activities responsible for building mental simulations of the future when remembering the past (Schacter et al. 2007, Seligman et al. 2016). Mental simulations specify the when, where, and how of responses leading to problem solving (Atance and O’Neill 2001). They also engage the frontal parts of the brain in tricking subcortical areas into believing that future events are actually unfolding. Then, the cortex elaborates on the feelings those systems produce. The cortex relies on feelings as they encode wisdom from many past, unrelated situations (Gilbert and Wilson 2007). These mental simulations are imperfect because they are based on a small number of (sometimes unrelated) memories, omit many features, do not sustain themselves over time, and lack context. However, this process is enough to elicit brief interventions into the problem-solving process, increasing attention to mental activities that form elaborated simulation sequences of how events will play out.
Therefore, an implementation disposition leads to an elaborated deliberation about possible outcomes, for example, thinking about the potential contingencies and consequences, designing sequences of actions, simulating events, and evaluating possible outcomes. This is a notion similar to the one espoused by the scientific approach to entrepreneurship that builds on testing the appropriateness of one’s current solution in the market early on to raise the chances of pivoting, building a more accurate solution, and increasing revenues (Camuffo et al. 2020). Thus, we hypothesize the following.
Increasing attention to mental activities related to implementation leads to the enactment of a solution-focused strategy.
5. Study 2: Attentional Engagement Predicts Problem-Solving Strategies
We used a behavioral experiment to manipulate the attention that participants engaged in mental activities related to framing or implementation and compared their behavioral changes to a control group. Three outcomes of that experimental study were possible. First, we might have found that we could not manipulate how attention was engaged, thus not creating any behavioral change between the two treatment conditions and the control condition. Second, we might have found that the two manipulations changed participants’ behavior, but the behavioral change was the same or indistinguishable in both conditions, thus failing to identify the cause of the two different strategies. Finally, we could have found that each manipulation of attention affected each condition differently. That outcome, in turn, could have manifested in clearly differentiated behavior that corresponded to the strategies of Study 1 and our hypotheses.
5.1. Problems: Winter Survival and NASA Survival
The winter survival problem by Johnson and Johnson (1982) and the NASA survival problem by Hall and Watson (1970) are tasks that allow us to observe participants’ problem-solving processes. The two tasks are commonly used in management research and education (Lane et al. 1982, Yetton and Bottger 1983, Baker and Paulson 1995, Joshi et al. 2005). As in the Karabayos task, both tasks require participants to think as leaders who must make decisions for a group for which they are responsible. In both tasks, the participant is asked to rank order elements to create a solution that allows the group to survive. Rank-based tasks combined with mouse-move analysis provide an excellent option for our needs. They allow us to present a problem and track participants’ thinking as it unfolds in real time, using the computer to measure the mouse’s movements (Freeman 2018). Whereas the thoughts are not verbalized in this case, mouse moves are used as a proxy for problem solving.
Just as in the previous study, the problems we gave participants were complex. Similarly, no performance feedback was given to the participant when the problems were being solved. At their core, both problems share many commonalities with the complicated situations a manager or entrepreneur might face when trying to ensure the survival of the business unit or small firm in the face of multiple constraints and limited resources. However, the study problems are set in contexts that are novel to the participants, which prevents them from directly taking experience into account.
5.2. Data Collection: Online Experiment
We performed an online experiment that studied the behavioral changes caused by manipulating attentional engagement toward mental activities related to either the framing of the problem (framing disposition condition) or the implementation of the solution (implementation disposition condition) or allowing the task to unfold without intervention (control condition). By asking participants in different treatment conditions to focus on the problem or the solution, we can compare how their behavior changes in comparison with a control condition and infer why the two strategies exist in the first place. We ran four pretests and two pilot studies before the online experiment and one small-scale follow-up study after the online experiment. Besides refining the problems and the computer interface, the main benefits of these studies were the debriefing interviews that provided qualitative evidence about the participants’ problem-solving processes, complementing the quantitative data obtained from the experiment.
5.2.1. Research Design.
We performed a three-condition-by-two-task mixed factorial experimental design (Oehlert 2000). The experimental procedure began with all participants performing the first task (the winter survival problem) without being manipulated (Johnson and Johnson 1982). After this, we split the participants into one control group and two treatment groups (framing disposition and implementation disposition). The two treatment groups were presented with manipulations that aimed at increasing participants’ attention toward mental activities related to either framing the problem or implementing the solution. After the manipulation, all participants performed the second task: the NASA survival problem (Hall and Watson 1970).
The mixed factorial design allowed us to test the participants’ behavioral changes in response to each treatment (Edmonds and Kennedy 2016). Compared with a between-subject design, the mixed factorial approach allows the use of the participants’ measures before the manipulation as the baseline for the treatment effect, thus reducing variation in the analyses. Compared with a within-subject design, the mixed factorial does not require all participants to be exposed to every treatment, allowing us to estimate average treatment effects for each condition without task-order bias. It is important to note that order effects do not bias our estimation as the task order affects all participants similarly; when we compare between conditions, the order effect cancels out and allows an unbiased estimator. A mixed factorial design enables us to estimate treatment effects by reducing individual variation without needing to counterbalance the design.
5.2.2. Manipulations: Framing Disposition and Implementation Disposition.
The manipulations were introduced after participants had solved the winter survival problem and before they solved the NASA survival problem. This was done to compare the groups before any change occurred across conditions so that we could study the behavioral change of every participant after the manipulation based on the participant’s own baseline and simulate the attentional focus set by problem-solving tools used at the workplace (e.g., design thinking or the stage-gate model). However, we designed small manipulations to be able to accurately identify their causal effects. The manipulations were shown as texts in a red font that recommended participants should spend their thinking time engaging in mental activities related to either framing the problem or implementing the solution.4 The description of the mental activities was taken directly from the coding scheme used to analyze the data from Study 1. Specifically, we asked participants in the framing disposition condition to analyze the problem by recalling the available information, empathizing to identify with the situation, and developing hypotheses or assumptions to understand the problem. Participants in the implementation disposition condition were asked to design a sequence of actions that could unfold during the solution of the problem, anticipate how events would evolve, and evaluate the feasibility of the solution. In contrast, the participants in the control condition were asked to think about the problem in a way that seemed natural to them.
5.2.3. Sample.
We conducted the behavioral experiment through the Prolific platform. This study included participants with nonmanagerial backgrounds, filtered for three attributes to obtain homogenous behavior and a comparable sample. First, participants were required to have a standard minimum education (i.e., at least a bachelor’s degree). Second, we required English to be their first language to ensure instructions were comprehended. Third, we selected participants aged between 25 and 55 as younger participants have better computer familiarity.
The experiment has three conditions and two measures leading to an estimate of 98 participants per condition to achieve both and power = 0.95 for the effect size, f = 0.2, inferred from the pilot studies (Cohen 1969, Faul et al. 2009). Ultimately, we had 97 participants for the framing disposition condition and 99 for the implementation disposition condition and ran a larger sample in the control condition to explore cross-sectional effects, which led us to 276 participants in the control condition, making a total of 472 participants.
5.2.4. Incentives.
We created a three-level incentive scheme to elicit a solid commitment to the tasks. The top 25% of performers on both tasks received twice the hourly payoff of the platform (£5), the middle 50% received 1.5 times the hourly rate (£3.75), and the bottom 25% received the hourly rate (£2.50). As participants self-selected to take part in the online platform, doubling the payoff for high performance was an attractive way to increase the value of the task (Hertwig and Ortmann 2001).
5.3. Data Analysis
As in the Karabayos task, we focused on the processes employed by participants to solve the problem and find a solution. We combined rank ordering with mouse-move analysis to reveal the sequence and microprocesses related to how cognition unfolds during problem solving. In the past decade, mouse tracking has become a popular method in psychological science (Freeman 2018). Some studies use mouse moves to investigate the stages of insight problem solving. For example, Fedor et al. (2015) recorded mouse drag-and-drop movements and keyboard strokes to understand cognition during problem solving. They support the notion that mouse movements can act as a behavioral proxy for ongoing cognitive processing. Similarly, Travers et al. (2016) find that more deliberation effort was associated with slower mouse moves.
The method focuses on isolating mouse moves as a proxy for chunks of thoughts that unfold when solving a problem. According to Ericsson and Simon (1998, p. 180), “Today, it is relatively uncontroversial that thinking can be represented as a sequence of thoughts (relatively stable cognitive states) interspersed by periods of processing activity.” Chunks of thought can, thus, be captured as a participant’s drag-and-drop moves during the problem-solving process (Yu et al. 2012, Öllinger et al. 2013). Mouse moves can be counted, and each drag-and-drop event is a proxy for thoughts (Fedor et al. 2015). In addition, we can also calculate the time it takes participants to carry out the movements, not just their overall reaction times and solutions (Yu et al. 2012), and that is a proxy for deliberation between moves (Freeman and Ambady 2009, Freeman et al. 2011, Schoemann et al. 2021). In sum, this process-tracing method allows us to uncover participants’ thought sequences with the number of thoughts captured as the number of drag-and-drop moves and the deliberation effort associated with each thought measured as the time between moves.
The two tasks in the experiment require participants to rank-order items. The rank-ordering process acts as a proxy for the concurrent problem-solving process of the participant. We operationalize this problem-solving process with three variables. First, we measure the total time spent, which reflects the total effort and attention participants put into the task as it includes both the time spent reading the task and moving the items to create a ranking. Second, we measure the number of moves each participant performs. There is a minimum number of moves the participant can make, imposed by the number of items that must be ranked. For the NASA survival problem, this lower bound is 15 moves, and for winter survival, it is 12 moves (Hall and Watson 1970, Johnson and Johnson 1982). Because the lower bound is the same for everyone, the total number of moves can be used as a proxy for the number of thoughts a participant engages in during the problem-solving process. Third, we calculate the time between the first and last moves and divide it by the number of moves. We call this the time per move, and it measures the amount of deliberation involved in each thought. Some moves involve more thinking than others, and some processes involve more or fewer moves. By comparing their values before and after the manipulation and how the changes compare with the control condition, we can find an answer to the research question of Study 2, namely, what causes the emergence of two strategies for solving problems?
According to Hypothesis 1, we expect that increasing attentional engagement with the mental activities related to framing lead to a problem-focused strategy. Increased attentional engagement with the mental activities related to framing involve more thoughts, representing the effort to restructure problem elements by identifying and connecting them and creating and prioritizing structures of hypotheses and assumptions (Ehrig and Schmidt 2022). Thus, a problem-focused strategy should be associated with a greater number of thoughts as measured by the number of drag-and-drop moves. In contrast, based on Hypothesis 2, we expect that increasing attentional engagement with the mental activities related to implementation lead to a solution-focused strategy. Increased attentional engagement with the mental activities related to implementation involve an increased deliberation effort related to thinking about contingencies and consequences, designing sequences of actions, simulating events, and evaluating possible outcomes (Camuffo et al. 2020). Thus, a solution-focused strategy should be associated with more deliberation effort connected with each thought as measured by the time between moves.
As the two tasks have different numbers of items to rank, we could not directly compare the performance of behavioral variables. Therefore, we standardized the variables for each task. We then subtracted from the values of the first task the values of the second task. Specifically, for variable X, we calculated the standardized distance of a participant (i) in units of standard deviation from the mean of the control condition after the manipulation and subtracted the distance before. This was calculated using the following formula:5
For every measure, the mean and standard deviation are different, but this analysis allows us to study in greater detail the behavioral changes that happen to each individual, not just the entire group. That procedure is similar to the addition of participant fixed effects in panel regressions except that we needed further normalization because of the difference in the number of items in each task.
For each participant, we used demographic variables as control variables—specifically, age, gender (1 for female, −1 for male), postgraduate education (1 if they have a master’s degree or more, −1 if not), and whether they read books more than twice a week, which can affect their ability to engage in mental simulations and, thus, lead to them being classified as a reader (1 if they do, −1 otherwise). We used these variables as control measures for the behavioral and performance metrics. The average age of the 472 participants was 34.9 years (s.d. = 8.5 years with a 21–56 range), 269 were female, 161 had a postgraduate degree, 219 read more than twice a week.
5.4. Results
Table 8 presents the descriptive statistics of the main variables of Studies 2 and 3.6 These results are for all participants. In Study 2, we find that participants performed a much higher number of moves than the task designs required. In the case of the winter survival problem, participants performed, on average, 20.05 moves, 67% more moves than the minimum of 12 needed to finish the problem. In the NASA survival problem, participants performed, on average, 28.92 moves, 93% more moves than the 15 required. The increase in moves gives us confidence that the movements provide a proxy of the participants’ problem-solving processes and not only their final solutions.
|
Table 8. Descriptive Statistics for Studies 2 and 3 and t-Tests Comparing the Two Studies
| Measure | Study 2 | Study 3 | t-test | ||||
|---|---|---|---|---|---|---|---|
| Mean | s.d. | Mean | s.d. | p-value | t-statistic | ||
| Winter survival problem | Total time, s | 324.5 | 287.2 | 337.2 | 233.7 | 0.419 | 0.809 |
| Number of moves | 20.05 | 7.37 | 20.91 | 7.04 | 0.045 | 2.010 | |
| Time per move, s | 10.17 | 11.37 | 10.21 | 8.25 | 0.949 | 0.065 | |
| NASA survival problem | Total time, s | 363.0 | 208.8 | 383.8 | 260.7 | 0.125 | 1.537 |
| Number of moves | 28.92 | 12.31 | 28.19 | 10.38 | 0.283 | −1.073 | |
| Time per move, s | 8.85 | 5.92 | 9.55 | 6.98 | 0.062 | 1.868 | |
We observe that participants in the treatment conditions increased their deliberation time in the second task compared with the control condition. The change in total time for the control condition is −0.08 s.d., whereas for the two treatment conditions, it is +0.19 s.d. (t-test p-value = 0.003, t-statistic = 3.029).7 Therefore, the manipulation induced participants in the treatment conditions to increase their deliberation by 0.268 s.d.; given that the standard deviation of total time for the NASA survival problem is 208.8 seconds, this equates to an increase of 67.8 seconds, or 18%, over the 363.0 seconds averaged by all participants in the experiment.
Importantly, despite both manipulations leading to an overall increase in deliberative effort, the manipulations differ in how they engage that effort. Table 9 presents ordinary least squares (OLS) regressions for hypothesis testing.8 This table includes the results for Study 2 in Models 1 and 2. The other columns show the replication results (Study 3) and are discussed in the next section. Model 1 shows that participants in the framing disposition increased the number of moves more than participants in the control condition. This is shown by both limits of the 95% confidence interval of the coefficient of the framing disposition condition being above zero (the baseline being given by the control condition), p-value = 0.015, and t-statistic = 2.439. The 0.310 s.d. coefficient can be interpreted as an increase of 3.82 moves given that the standard deviation for the sample is 12.31 moves (see Table 8, column (4), NASA survival problem). This means that, in the NASA survival problem, participants in the framing-disposition condition made, on average, 13.1% more moves than the 28.92 moves averaged by the control condition. The increase in the number of moves represents a continuous structuring and restructuring of the problem elements, which characterizes a problem-focused strategy. The ex post effect size for the increase in the number of moves is small, f = 0.112 (Cohen 1969). In contrast, the participants in the implementation-disposition condition had a similar change in the number of moves as the control condition. These results give support to Hypothesis 1.
|
Table 9. OLS Regressions of Behavioral Change Variables for Studies 2 and 3
| Study 2 | Study 3 | ||||
|---|---|---|---|---|---|
| Change in number of moves, s.d. (Model 1) | Change in time per move, s.d. (Model 2) | Change in number of moves, s.d. (Model 3) | Change in time per move, s.d. (Model 4) | ||
| Conditions | Framing disposition | 0.310 | 0.080 | 0.318 | 0.243 |
| (0.061, 0.558) | (−0.172, 0.332) | (0.104, 0.533) | (−0.020, 0.505) | ||
| Implementation disposition | 0.031 | 0.343 | 0.110 | 0.279 | |
| (−0.215, 0.277) | (0.094, 0.592) | (−0.107, 0.327) | (0.013, 0.546) | ||
| Demographic | Gender | −0.023 | −0.073 | −0.035 | 0.004 |
| (−0.122, 0.076) | (−0.173, 0.027) | (−0.126, 0.057) | (−0.109, 0.116) | ||
| Age | −0.008 | 0.002 | −0.003 | 0.007 | |
| (−0.020, 0.003) | (−0.009, 0.014) | (−0.015, 0.009) | (−0.008, 0.021) | ||
| Postgraduate | −0.035 | −0.061 | −0.105 | −0.030 | |
| (−0.140, 0.070) | (−0.168, 0.045) | (−0.198, −0.011) | (−0.144, 0.085) | ||
| Reader | 0.112 | −0.082 | 0.065 | 0.046 | |
| (0.010, 0.214) | (−0.185, 0.021) | (−0.025, 0.156) | (−0.066, 0.157) | ||
| Pandemic | Fear of COVID-19 | 0.006 | −0.011 | ||
| (−0.010, 0.022) | (−0.031, 0.008) | ||||
| Monitor/blunt scale | −0.012 | 0.005 | |||
| (−0.053, 0.030) | (−0.046, 0.055) | ||||
| Perceived vulnerability | 0.003 | −0.002 | |||
| (−0.012, 0.018) | (−0.020, 0.016) | ||||
| Intolerance of uncertainty | −0.014 | 0.014 | |||
| (−0.025, −0.003) | (−0.0001, 0.027) | ||||
| Job loss | 0.040 | 0.111 | |||
| (−0.059, 0.139) | (−0.010, 0.233) | ||||
| Prolific importance | 0.058 | −0.079 | |||
| (−0.015, 0.131) | (−0.168, 0.011) | ||||
| Constant | 0.253 | −0.157 | −0.075 | 0.170 | |
| (−0.170, 0.675) | (−0.585, 0.270) | (−1.253, 1.104) | (−1.274, 1.614) | ||
| Statistics | Observations | 472 | 472 | 710 | 710 |
| R2 | 0.023 | 0.029 | 0.035 | 0.023 | |
| Adjusted R2 | 0.010 | 0.017 | 0.019 | 0.006 | |
| Residual s.d. | 1.071 (df = 465) | 1.084 (df = 465) | 1.189 (df = 697) | 1.457 (df = 697) | |
| F-statistic | 1.832 (p = 0.091; df = 6,465) | 2.317 (p = 0.032; df = 6,465) | 2.130 (p = 0.014; df = 12,697) | 1.371 (p = 0.175; df = 12,697) | |
Notes. Ninety-five percent confidence intervals shown in parentheses. Model 4 achieves F = 1.81, p = 0.073 with only pandemic control variables. This is shown in Supplemental Table A.10.
Model 2 of Table 9 shows that participants in the implementation disposition condition increased their time per move when compared with participants in the control condition (both sides of the 95% confidence interval for the coefficient are positive, and p-value = 0.007, t-statistic = 2.700). We can estimate that the 0.343 s.d. coefficient represents an increase in time per move of 2.03 seconds based on a standard deviation of 5.92 seconds. This increase implies that, in the NASA survival problem, the manipulation led participants in the implementation-disposition condition to increase their time per move by 22.9% above the 8.85 seconds average of the control condition (Table 8). The estimated ex post effect size for the change in time per move is small, f = 0.124. The increase in the time per move captures participants’ more elaborate simulations of how events will play out. In contrast, the participants in the framing disposition had a similar change in the time per move as the control condition. Each thought took longer, but no additional thoughts were needed to solve the problem. These results support Hypothesis 2. Aside from showing that attention can be manipulated in a particular direction, these findings also show that the manipulation can result in attention remaining focused in that direction long enough to impact how an individual solves a complex problem.
6. Study 3: Replication and Further Manipulation Check
Given the smaller-than-expected effect sizes of the results obtained, we replicated Study 2. This preregistered replication was meant to test the reliability of our claims by using the same tasks, incentive scheme, measures, and analyses. Furthermore, we ran the study on the same platform as Study 2, and participants were sampled with the same criteria. The focus on validation led us to run this experiment according to state-of-the-art requirements, preregistering the design (tasks, dependent and independent variables, and types of analyses) and publicly opening the data, instruments, and analyses.
Study 3 differed from Study 2 in two respects. First, it had a larger sample size. The average ex post effect size of the three main results in Study 2 was f = 0.118. However, Study 2 was designed to detect changes with larger effects (f = 0.2). Therefore, for Study 3, we needed a larger sample that allowed for a smaller minimum detectable effect to validate the results of Study 2 (Baguley 2004). The sample size required for f = 0.125 is 747 participants or 249 per condition (Faul et al. 2009).9 Second, the data for Study 3 were collected in May 2020, a time when the SARS-COV-2 pandemic dominated the media. We believed that the increased coverage of disease in the media could affect the preparedness of the participants and confound our results. To account for that, we included six separate control scales that past work in psychology suggests can account for the crisis-coping styles of the participants as well as how fearful they were of COVID-19 and how they had been financially affected by the crisis (Steptoe 1989, Carleton et al. 2007, Duncan et al. 2009, Taylor 2019, Ahorsu et al. 2022). The pandemic control variables were collected as a second survey to which participants had to respond. We did this because adding the questions at the end of the survey affected the participants’ behavior as we explain in the supplemental materials, and 92.8% of participants answered the second survey.10 In the right columns of Table 8, we present the t-test comparisons between the Study 2 and Study 3 statistics.11 As shown, the descriptive statistics of Study 3 closely match those of Study 2.12 Similarly, the manipulation check on the increased standardized change in total time was replicated; deliberation increased by 0.03 s.d. for control condition participants compared with an increase of 0.46 s.d. among participants in the treatment conditions (p-value < 0.001, t-statistic = 4.40). Finally, the results of Study 3 support the findings of Study 2: the tests of the hypotheses are replicated in Study 3 and shown in Table 9, Models 3 and 4. These latter tests include control variables to consider the change in behavior associated with the centrality of the pandemic in people’s minds.13 Here, again, increasing attention to mental activities related to framing leads to a higher number of moves, representing a problem-focused strategy (both sides of the 95% confidence interval for the coefficient being positive, p-value = 0.004, and t-statistic = 2.908). In contrast, increasing attention to mental activities related to implementation leads to longer thinking before each move, representing a solution-focused strategy (both sides of the 95% confidence interval for the coefficient being positive, p-value = 0.040, and t-statistic = 2.056).
To further corroborate the causal nature of the relationship found, we ran yet another experiment that acted as a manipulation check. This experiment was a direct replication of Study 3 with an additional question aimed at “providing evidence that participants’ in-use decision policies (i.e., those derived from analyzing the pattern of responses from the experiment) effectively reflect their espoused decision policies” (Grégoire et al. 2019, p. 291). Table 10 shows the number of participants in each condition who espoused either framing or implementing mental activities. Frequency test (i.e. ), shown in Table 10, determine significant differences in changes induced by espoused decision policies via the manipulations. A three-level test performed on these data indicates a large effect size for the manipulations ( > 0.475, degrees of freedom (df) = 2 with p < 0.001 and = 56.9, Cramer 1946). This result supports the identification of the causal effects of participants’ attention being manipulated and successfully engaged with specific mental activities. In addition to the increased change in the total time, this manipulation check gave us grounds to believe that the manipulations indeed affected participants’ behavior and the identified cause of the behavioral check is accurate.
|
Table 10. Contingency Table for the Manipulation Checks of Espoused Mental Activity
| Espoused mental activity | Conditions | ||
|---|---|---|---|
| Control | Framing | Implementation | |
| 47 | 63 | 15 |
| 37 | 21 | 69 |
7. Discussion and Conclusion
In this paper, we study the cognitive processes that explain the emergence of different strategies to solve problems. In our first, descriptive step, we find no single, dominant strategy that described most participants’ approach to problem solving; instead, we found two types of strategies: one focused on framing and the other on implementation (Figures 3 and 4). Both deviate from the linear model (Figure 1) and stand in stark contrast to the findings of Lipshitz and Bar-Ilan (1996). At the same time, each strategy follows a clear pattern in contrast to the findings of Langley et al. (1995). Based on these initial findings, we built on the ABV and dual process theories to offer a novel, microfounded model of problem solving.
At the core of our model lies the idea that deliberation takes place in two qualitatively different ways: framing and implementation. This gives a solid cognitive foundation to recent developments in decision-making research that build upon the analysis of how entrepreneurs and executives take decisions. For example, Ehrig and Schmidt (2022) argue that executives taking decisions under uncertainty develop theories, that is, identify the core assumptions that must be true in order for their decisions to be sensible. Camuffo et al. (2020) argue that taking decisions based on the scientific method, that is, developing and testing hypotheses, leads to better decisions (e.g., fewer and faster pivots, more revenues). These two different ways of approaching uncertainty are consistent with the two problem-solving strategies we identify.
Whereas more research is, of course, needed, we offer preliminary specific attention-based mechanisms for both approaches that, in our view, underpin the findings of Ehrig and Schmidt (2022) and Camuffo et al. (2020). To the modeling approach of Ehrig and Schmidt (2022), which is similar to our problem-oriented strategy, we offer a refinement by suggesting a mechanism related to attentional engagement. We also connect to the findings of Camuffo et al. (2020) by proposing that the scientific method works by focusing attention on the evaluation of possible outcomes, their likelihood, and magnitude, that is, what we call a solution-focused strategy. This result is important because it offers a clear cognitive mechanism that supports the behavioral effects identified in that line of work, which does not directly observe the underlying cognitive mechanisms. Future research could aim at understanding whether different management tools (e.g., total quality management, Six Sigma, stage-gate models, lean management, design thinking, agile development) are better suited (or not) for some individuals depending on their disposition toward framing or implementation. We were able to manipulate attentional engagement. A useful avenue for future research would be to explore whether some people are better suited to some management tools than others, depending on their preferred type of deliberation. Also, as Ghosh and Wu (2021) explain, iteration is key in solving novel problems, and thus, managers need not only to test hypotheses or build theories, but also to shift from one to the other in an orderly fashion. Future research might look more closely at how management tools can foster such flexibility in individuals and teams. Additionally, future research on interindividual differences could explore the origins of a framing or an implementation disposition. In this study, we remained agnostic as to whether these thinking dispositions originate from individual differences, experience, or both. Given that type 2 processes are responsible for redirecting attention, cognitive control capabilities appear as good candidate variables (Laureiro-Martinez 2014).
Our model delivers three main contributions. First, we extend the ABV by integrating Ocasio’s (2011) three varieties of attention (attentional selection, engagement, and perspective) into a single model that explains how each variety contributes to the problem-solving process. Our model also contributes toward understanding not only how problems are defined and resolved but also how solutions are found (Langley et al. 1995, Hutzschenreuter and Kleindienst 2006, Posen et al. 2018). Our model builds on a processual view of attention that emphasizes how attention is engagement. Most of the existing literature instead emphasizes on what attention focuses. Hence, our model extends the taxonomical analysis of attention types in Ocasio (2011) into a causal analysis of their connections and outcomes. Past studies in the ABV tradition mostly fall under one of Ocasio’s (2011) three varieties of attention. We integrate these three varieties into a model that explains how each one contributes to the problem-solving process. Our model contributes to current discussions around the ABV that look for evidence of dynamics (Ocasio et al. 2018), granules (Bansal et al. 2018), and the early creation of opportunity beliefs toward strategic action (Shepherd et al. 2017) by providing an empirically based and tested model of attentional engagement during problem solving.
As discussed in Section 4 and shown in Figure 5, attentional selection acts as a portal between the environment presenting the problem and the processing of the selected stimuli. In turn, attentional perspective serves as the exit, that is, the threshold responses must reach to accumulate into a solution. Whereas Ocasio (2011) acknowledges that the three varieties of attention are ideal types and apply to attention in organizations, we also find them very apt at the individual level. Not accidentally, Ocasio’s analysis builds on neuroscientific work. Our model connects the view of strategy as patterns of attention to the view of strategy as a set of actions which, as noted by Ocasio and Joseph (2018), had thus far remained entirely separate. Whereas there is value in maintaining the conceptual distinction between attention as a precursor to action and action, our model identifies a cognitive, attention-related, causal mechanism (i.e., the distinct thinking dispositions) that explains the emergence of distinct problem-solving strategies. Hence, we argue that our model provides compelling microfoundations to the ABV, integrating different varieties of attention (Ocasio 2011) into a cognitive model of problem solving.
A second contribution derives from testing a model of attentional engagement in problem solving (see Figure 5) and finding that deliberation involves two types of mental activities (i.e., framing and implementation). This is important because, thus far, deliberation is studied mostly as a whole that varies in amount or intensity (e.g., Frankenberger and Sauer 2019). We find, instead, significant differences in how deliberation operates. This finding is not obvious as we know little about the varied ways in which deliberation takes place during problem solving. In addition, we show that the deliberation mode can be manipulated experimentally, inducing an effect that lasts long enough to cover the time needed to solve an ill-structured, complex problem.
Advances in cognitive science show converging evidence that the ability to sustain mental representations, create mental models of the world, structure problems, and test outcomes of imaginary actions are the key features of type 2 processing (Sherman et al. 2014). Our contribution lies in finding that type 2 processing involves either framing mental activities directed at analyzing the received stimuli, thereby developing assumptions to understand the problem further, or mental activities that imagine implementing the solution. This distinction between two forms of type 2 engagement is an essential refinement of dual process theories as used in management (e.g., Laureiro-Martinez and Brusoni 2018). In addition, our model is consistent with the idea—imported from the cognitive sciences—that reliance on deliberation does not prevent decision makers from also relying on type 1 processing, that is, intuition (Shepherd et al. 2017). The interaction between these two types of processing (which we do not explore in this paper) allows the problem-solving process to unfold. This idea stands in contrast to past models of attention applied to understand opportunity recognition (Shepherd et al. 2017), in which deliberation (type 2) appears as orthogonal to intuition (type 1).
Thus, our model can serve as a foundation to reconcile conflicting views on the relative importance of automatic processing and deliberation. Extant research in management puts different emphasis on the relative importance of each type of processing. On the one side, deliberative planning has a long-standing history in management (Drucker 1959). On the other, scholars of effectuation emphasize noncausal reasoning, improvisation, and bricolage as core processes through which entrepreneurs develop new solutions (e.g., Sarasvathy 2001, Grégoire and Cherchem 2020). We argue that these diverse streams of work are correct in highlighting the different ways in which problems can be solved. Nevertheless, in our view, these ways may not be stark alternatives. Different cognitive processes operate in a coordinated manner, and interventions are triggered by attentional engagement. We propose that the approach used in this paper could help develop a more general model of cognition and problem solving. Such an approach is needed in order to strengthen the line of inquiry developed by Camuffo et al. (2020), which, in our view, is beginning to address one of the implicit assumptions (noted by Posen et al. 2018) in the behavioral theory tradition: the overemphasis of automatic processes instead of more deliberate forms of problemistic search.
Finally, this paper also makes a methodological contribution, consistent with the objectives of this special issue. Our combination of methods is an example of the theory-building and testing cycle, which is methodologically complex but foundational to the growth of scientific knowledge (Popper 1959). Our choice is consistent with the phenomenological nature of the problem we wish to solve. The question of how problems are solved is not new. However, past theories leave us unclear about the process through which distinctive problem-solving phases are connected. Our approach is designed to bring clarity to these specific questions. Our argument is not about the potential benefits of multimethod approaches, of which there are many (Schulte-Mecklenbeck et al. 2019). Our focus is on theorizing; implicitly, experimental work is associated with the deductive model in which hypotheses are deduced from a general principle or formal model. Our paper gives an example in which inductive, descriptive work can generate hypotheses from the precise observation of a phenomenon rather than deducing them logically (from literature) or formally (from theory). Our methodological approach does not superimpose any overarching category on alternative theoretical lenses. We simply observe in a disciplined and robust manner what happens in a controlled environment. In so doing, we let heterogeneity emerge, and only on that basis do we suggest hypotheses and predictions. We argue that our approach is consistent with recent calls for greater clarity and transparency in research implementation and design (e.g., Lewin et al. 2016). More generally, we believe it is important to explore the ways in which experimental methods can be complemented by the inductive and observational capabilities of qualitative methods. This is because we want to avoid the bias of equating experimental methods with deduction, which could occur if we directly transfer the approach to experimental methods of economics and other more deduction-oriented fields into management science.
To conclude, research on the microfoundations of strategy shows that cognitive flexibility (Laureiro-Martinez and Brusoni 2018) and strategic intelligence (Levine et al. 2017) can be seen as antecedents of adaptive decision making. Our study adds an understanding of the processes that underpin problem solving; by finding two strategies caused by two types of mental activities, it opens another way to investigate flexibility and adaptation. Further work is needed to determine how managers change their problem-solving strategies in response to shifts in attention. Equifinality is a key element in crafting solutions to problems; as a solution is found, multiple directions open up and, at least in the short term, all seem equally viable (Arrieta and Shrestha 2022). Our findings about how problems are solved can serve as a basis for research on organization microstructures (Puranam 2018) or as a point of departure, using the methods from Study 1, to investigate whether and how attention is allocated differently when a problem is solved by groups of individuals working together. This might ultimately result in a robust tool to solve “fundamental and universal problems of organizing (that relate to how [organizations]…aggregate their members’ efforts)” (Puranam 2018, p. 1).
The authors are grateful to Elisa Bosio, Nadia Neytcheva, and Laura Strada for their collaboration in the collection and analysis of the think-aloud data; to Ilaria Devittori for piloting the experimental tasks; and to Adrian Oesch for research assistance. Very useful comments were received from the special issue editors and three anonymous reviewers; participants in the two conferences associated with this special issue; seminar participants at the Politecnico di Milano, ETH Zurich, and Universidad de los Andes; and conference participants at the Strategic Management Society Conference and the Carnegie School of Organizational Learning Conference. Daniella Laureiro-Martinez and Jose Pablo Arrieta contributed equally to this work. The order was chosen to create an acronym, LAB, that parallels the methods used in of this article.
1 Throughout this paper, we employ contrast coding to store dichotomous variables; that is, instead of binary coding, they are stored as 1 and −1 (Davis 2010).
2 When coding, the raters informed us that one protocol differed from the others in that the participant’s thoughts were mainly devoted to numerical calculation. After coding, we compared this protocol to the others and decided to remove it from the sample. On any measure of normality, the protocol was the least normal by a large margin (Rasmussen 1988). For example, the sample’s median Mahalanobis distance of the average time spent on the problem-solving phases was 4.80, and the 75th percentile was 7.0 (Mahalanobis 1936). The deleted protocol had a distance of 21.9, making it a clear outlier.
3 Going back to Figure 2, person A is an example of someone following a problem-focused strategy, person B follows instead a solution-focused strategy.
4 The exact stimuli presented as manipulations are shown in Supplemental Figures A.5–A.7.
5 We used the values from the control condition only to calculate the mean and standard deviation in the NASA survival exercise. We did this filtering to avoid diluting the effect of the manipulation through increased standard deviations or changed means. Therefore, the measures used for standardization come from untreated participants. We use the values from the control condition only to calculate the mean and standard deviation in the NASA survival exercise. We do this filtering to avoid diluting the effect of the manipulation through increased standard deviations or changed means. Therefore, the measures used for standardization come from untreated participants.
6 Descriptive statistics and zero-order correlations for all variables are included in Supplemental Table A.4. Additionally, Table 8 also presents the data for Study 3 and comparisons between the two studies. These data are discussed in Section 6.
7 Both treatment conditions increased their total time by a similar amount. The statistical tests led to p > 0.8 when comparing both increases in total time.
8 We obtained the same results with robust regressions as shown in Supplemental Table A.5.
9 The ex post power estimations are not expected to give a completely accurate effect size, but are to be used as guides for updating future research designs. For Study 3, we use an effect size of f = 0.125 because it is close to the average effect of Study 2 and allows us to design an experiment that is strong enough to test the hypotheses.
10 For more details on these control variables, see Supplemental Section 8.3.2.
11 Descriptive statistics and zero-order correlations for all variables are included in Supplemental Table A.9.
12 We find a significant deviation only in the case of move numbers in the winter survival problem. This deviation is less than one move, much lower than the eight extra moves participants made to solve the task on average; thus, we interpret it as a normal deviation in the replication.
13 Note that Hypothesis 1 is only significant at the 0.1 level when we use only the demographic control variables. Indeed, the pandemic affected how people thought when solving problems. By controlling for these changes, we fully replicate the results of Study 2. More details on the use of the different sets of control variables are shown in Supplemental Table A.10.
References
- (1995) Sequence analysis: New methods for old ideas. Annual Rev. Sociol. 21(1):93–113.Crossref, Google Scholar
- (2022) The fear of COVID-19 scale: Development and initial validation. Internat. J. Mental Health Addiction 20(3):1537–1545.Crossref, Google Scholar
- (2022) On the strategic value of equifinal choice. J. Organ. Design. 11:37–45.Crossref, Google Scholar
- (2001) Episodic future thinking. Trends Cognitive Sci. 5(12):533–539.Crossref, Google Scholar
- (2013) Microfoundations of strategic problem formulation. Strategic Management J. 34(2):197–214.Crossref, Google Scholar
- (2004) Understanding statistical power in the context of applied research. Appl. Ergonomics 35(2):73–80.Crossref, Google Scholar
- (2023) KappaAcc: A program for assessing the adequacy of kappa. Behav. Res. Methods 55(2):633–638.Crossref, Google Scholar
- (1997) Detecting sequential patterns and determining their reliability with fallible observers. Psych. Methods 2(4):357–370.Crossref, Google Scholar
- (1995) Experiential Exercises in Organization Theory (Prentice Hall, Englewood Cliffs, NJ).Google Scholar
- (2010) In defence of the linear model: An essay. Res. Policy 39(1):1–13.Crossref, Google Scholar
- (1951) Phases in group problem-solving. J. Abnormal Soc. Psych. 46(4):485–495.Crossref, Google Scholar
- (2018) Hidden in plain sight: The importance of scale in organizations’ attention to issues. Acad. Management Rev. 43(2):217–241.Crossref, Google Scholar
- (2002) Process management and technological innovation: A longitudinal study of the photography and paint industries. Admin. Sci. Quart. 47(4):676–707.Crossref, Google Scholar
- (2020) A scientific approach to entrepreneurial decision making: Evidence from a randomized control trial. Management Sci. 66(2):564–586.Link, Google Scholar
- (2007) Fearing the unknown: A short version of the intolerance of uncertainty scale. J. Anxiety Disorders 21(1):105–117.Crossref, Google Scholar
- (1982) Control theory: A useful conceptual framework for personality–social, clinical, and health psychology. Psych. Bull. 92(1):111–135.Crossref, Google Scholar
- (1990) Origins and functions of positive and negative affect: A control-process view. Psych. Rev. 97(1):19–35.Crossref, Google Scholar
- Chaiken S, Trope Y, eds. (1999) Dual-Process Theories in Social Psychology (Guilford Press, New York).Google Scholar
- (1960) A coefficient of agreement for nominal scales. Ed. Psych. Measurement 20(1):37–46.Crossref, Google Scholar
- (1969) Statistical Power Analysis for the Behavioral Sciences (Academic Press, New York).Google Scholar
- (1946) Mathematical Methods of Statistics (Princeton University Press, Princeton, NJ).Google Scholar
- (2010) Contrast coding in multiple regression analysis: Strengths, weaknesses, and utility of popular coding structures. J. Data Sci. 8(1):61–73.Crossref, Google Scholar
- (1910) How We Think (DC Heath, Boston, MA).Crossref, Google Scholar
- (1959) Long-range planning—Challenge to management science. Management Sci. 5(3):238–249.Link, Google Scholar
- (2009) Perceived vulnerability to disease: Development and validation of a 15-item self-report instrument. Personality Individual Differences 47(6):541–546.Crossref, Google Scholar
- (2016) An Applied Guide to Research Designs: Quantitative, Qualitative, and Mixed Methods (Sage Publications, Los Angeles, CA).Google Scholar
- (2022) Theory‐based learning and experimentation: How strategists can systematically generate knowledge at the edge between the known and the unknown. Strategic Management J. 43(7):1287–1318.Crossref, Google Scholar
- (1988) Politics of strategic decision making in high-velocity environments: Toward a midrange theory. Acad. Management J. 31(4):737–770.Crossref, Google Scholar
- (2003) Valid and non-reactive verbalization of thoughts during performance of tasks toward a solution to the central problems of introspection as a source of scientific data. J. Consciousness Stud. 10(9–10):1–18.Google Scholar
- (1980) Verbal reports as data. Psych. Rev. 87(3):215–251.Crossref, Google Scholar
- (1998) How to study thinking in everyday life: Contrasting think-aloud protocols with descriptions and explanations of thinking. Mind Culture Activity 5(3):178–186.Crossref, Google Scholar
- (2018)
Dual-process theory: Perspectives and problems . De Neys W, ed. Dual-Process Theory 2.0 (Routledge/Taylor & Francis Group, London, UK), 137–155.Google Scholar - (2013) Dual-process theories of higher cognition: Advancing the debate. Perspect. Psych. Sci. 8(3):223–241.Crossref, Google Scholar
- (2009) Statistical power analyses using G* Power 3.1: Tests for correlation and regression analyses. Behav. Res. Methods 41(4):1149–1160.Crossref, Google Scholar
- (2015) Problem solving stages in the five square problem. Frontiers Psych. 6:1050.Google Scholar
- (1999) A study of how individuals solve complex and ill-structured problems. Policy Sci. 32(3):225–245.Crossref, Google Scholar
- (2011) Do procedures for verbal reporting of thinking have to be reactive? A meta-analysis and recommendations for best reporting methods. Psych. Bull. 137(2):316–344.Crossref, Google Scholar
- (2019) Cognitive antecedents of business models: Exploring the link between attention and business model design over time. Long Range Planning 52(3):283–304.Crossref, Google Scholar
- (2018) Doing psychological science by hand. Current Directions Psych. Sci. 27(5):315–323.Crossref, Google Scholar
- (2009) Motions of the hand expose the partial and parallel activation of stereotypes. Psych. Sci. 20(10):1183–1188.Crossref, Google Scholar
- (2011) Hand in motion reveals mind in motion. Frontiers Psychol. 2:59.Crossref, Google Scholar
- (2014) What is control?: A conceptual analysis. Sherman JW, Gawronski B, Trope Y, eds. Dual-Process Theories of the Social Mind (The Guilford Press, New York), 50–65.Google Scholar
- (2000) Looking forward and looking backward: Cognitive and experiential search. Admin. Sci. Quart. 45(1):113–137.Crossref, Google Scholar
- (2005) Strategy making in novel and complex worlds: The power of analogy. Strategic Management J. 26(8):691–712.Crossref, Google Scholar
- (1991) Commitment (Simon and Schuster, New York).Google Scholar
- (2021) Iterative coordination and innovation: Prioritizing value over novelty. Organ. Sci. Forthcoming.Link, Google Scholar
- (1971) The transition matrix method for comparing sequences; its use in describing and classifying proteins by their amino acid sequences. Systematic Biology 20(4):417–425.Crossref, Google Scholar
- (2007) Prospection: Experiencing the future. Sci. 317(5843):1351–1354.Crossref, Google Scholar
- (2020) A structured literature review and suggestions for future effectuation research. Small Bus. Econom. 54(3):621–639.Crossref, Google Scholar
- (2010) Cognitive processes of opportunity recognition: The role of structural alignment. Organ. Sci. 21(2):413–431.Link, Google Scholar
- (2019) Navigating the validity tradeoffs of entrepreneurship research experiments: A systematic review and best-practice suggestions. J. Bus. Venturing 34(2):284–310.Crossref, Google Scholar
- (2018) Show me the data! Improving evidence presentation for publication. Management Organ. Rev. 14(2):423–432.Crossref, Google Scholar
- (2014) Handbook of Inter-Rater Reliability: The Definitive Guide to Measuring the Extent of Agreement Among Raters (Advanced Analytics, LLC, Gaithersburg, MD).Google Scholar
- (1970) The effects of a normative intervention on group decision-making performance. Human Relations 23(4):299–317.Crossref, Google Scholar
- (1949) The Organization of Behavior: A Neuropsychological Theory (Wiley, New York).Google Scholar
- (2018) fpc: Flexible procedures for clustering. R Package Version 2.1-6.Google Scholar
- (2001) Experimental practices in economics: A methodological challenge for psychologists? Behav. Brain Sci. 24(3):383–403.Crossref, Google Scholar
- (2006) Strategy-process research: What have we learned and what is still to be explored. J. Management 32(5):673–720.Crossref, Google Scholar
- (1986) Thinking and managing: A verbal protocol analysis of managerial problem-solving. Acad. Management J. 29(4):775–788.Crossref, Google Scholar
- (1890) The Principles of Psychology (Henry Holt & Co., New York).Crossref, Google Scholar
- (1982) Joining Together, 2nd ed. (Prentice Hall, Englewood Cliffs, NJ).Google Scholar
- (2005) Experiential learning process: Exploring teaching and learning of strategic management framework through the winter survival exercise. J. Management Ed. 29(5):672–695.Google Scholar
- (2011) Thinking, Fast and Slow (Macmillan, Farrar, Straus and Giroux, New York).Google Scholar
- (2002) Representativeness revisited: Attribute substitution in intuitive judgment. Heuristics and Biases: The Psychology of Intuitive Judgment (Cambridge University Press, Cambridge, UK), 49–81.Google Scholar
- (1990) Partitioning around medoids (program pam). Finding Groups in Data: An Introduction to Cluster Analysis (John Wiley & Sons, Inc., Hoboken, NJ), 68–125.Google Scholar
- (2013) Becoming aware of the unknown: Decision making during the implementation of a strategic initiative. Organ. Sci. 24(1):133–153.Link, Google Scholar
- (2012) Content Analysis: An Introduction to its Methodology (Sage, Los Angeles, CA).Google Scholar
- (2002) A theory of goal systems. Zanna MP, ed. Advances in Experimental Social Psychology, vol. 34 (Academic Press, New York), 331–378.Crossref, Google Scholar
- (2000) A comparison of concurrent and retrospective verbal protocol analysis. Amer. J. Psych. 113(3):387–404.Crossref, Google Scholar
- (1982) Making the goals of acceptance and quality explicit: Effects on group decisions. Small Group Behav. 13(4):542–554.Crossref, Google Scholar
- (1995) Opening up decision making: The view from the black stool. Organ. Sci. 6(3):260–279.Link, Google Scholar
- (2014) Cognitive control capabilities, routinization propensity, and decision-making performance. Organ. Sci. 25(4):1111–1133.Link, Google Scholar
- (2018) Cognitive flexibility and adaptive decision‐making: Evidence from a laboratory study of expert decision makers. Strategic Management J. 39(4):1031–1058.Crossref, Google Scholar
- (2017) Strategic intelligence: The cognitive capability to anticipate competitor behavior. Strategic Management J. 38(12):2390–2423.Crossref, Google Scholar
- (1997) Adaptation on rugged landscapes. Management Sci. 43(7):934–950.Link, Google Scholar
- (2016) The critique of empirical social science: New policies at management and organization review. Management Organ. Rev. 12(4):649–658.Crossref, Google Scholar
- (1996) How problems are solved: Reconsidering the phase theorem. Organ. Behav. Human Decision Processes 65(1):48–60.Crossref, Google Scholar
- (2002) Content analysis in mass communication: Assessment and reporting of intercoder reliability. Human Comm. Res. 28(4):587–604.Crossref, Google Scholar
- (1936) On the generalized distance in statistics. Proc. National Inst. Sci. India 12:49–55.Google Scholar
- (1991) Learning from samples of one or fewer. Organ. Sci. 2(1):1–13.Link, Google Scholar
- (2001) An integrative theory of prefrontal cortex function. Annual Rev. Neuroscience 24(1):167–202.Crossref, Google Scholar
- (1976) The structure of “unstructured” decision processes. Admin. Sci. Quart. 21(2):246–275.Crossref, Google Scholar
- (2007) Seeing through the heart’s eye: The interference of system 1 in system 2. Marketing Sci. 26(5):666–678.Link, Google Scholar
- (2002) The Content Analysis Guidebook (Sage, Los Angeles).Google Scholar
- (2004) A knowledge-based theory of the firm—The problem-solving perspective. Organ. Sci. 15(6):617–632.Link, Google Scholar
- (1986)
Attention to action: Willed and automatic control of behaviour . Consciousness and Self-Regulation: Advances in Research and Theory, vol. 4 (Springer, Boston), 1–18.Crossref, Google Scholar - (1984) Types of organizational decision processes. Admin. Sci. Quart. 29(3):414–450.Crossref, Google Scholar
- (1997) Toward an attention‐based view of the firm. Strategic Management J. 18:187–206.Crossref, Google Scholar
- (2011) Attention to attention. Organ. Sci. 22(5):1286–1296.Link, Google Scholar
- (2005)
An attention-based theory of strategy formulation: Linking micro-and macroperspectives in strategy processes . Szulanski G, Porac J, Doz Y, eds. Strategy Process (Advances in Strategic Management) vol. 22 (Emerald Group Publishing Limited, Bingley, UK), 39–61.Google Scholar - (2018) The attention-based view of great strategies. Strategy Sci. 3(1):289–294.Link, Google Scholar
- (2018) Communication and attention dynamics: An attention‐based view of strategic change. Strategic Management J. 39(1):155–167.Crossref, Google Scholar
- (2000) A First Course in Design and Analysis of Experiments (W.H. Freeman, New York).Google Scholar
- (2013) Cognitive mechanisms of insight: The role of heuristics and representational change in solving the eight-coin problem. J. Experiment. Psychology Learn. Memory Cognition 39(3):931–939.Crossref, Google Scholar
- (2003a) Conceptualizing and measuring variety in the execution of organizational work processes. Management Sci. 49(7):857–870.Link, Google Scholar
- (2003b) Sequential variety in work processes. Organ. Sci. 14(5):528–540.Link, Google Scholar
- (2023) The dual function of organizational structure: Aggregating and shaping individuals’ votes. Organ. Sci. 34(5):1914–1937.Link, Google Scholar
- (1959) The Logic of Scientific Discovery (Routledge, New York).Google Scholar
- (2012) Chasing a moving target: Exploitation and exploration in dynamic environments. Management Sci. 58(3):587–601.Link, Google Scholar
- (2018) Renewing research on problemistic search—A review and research agenda. Acad. Management Ann. 12(1):208–251.Crossref, Google Scholar
- (2018) The Microstructure of Organizations (Oxford University Press, Oxford, UK).Crossref, Google Scholar
- (2008) A framework for studying the neurobiology of value-based decision making. Nature Rev. Neuroscience 9(7):545–556.Crossref, Google Scholar
- (1988) Evaluating outlier identification tests: Mahalanobis D squared and Comrey Dk. Multivariate Behav. Res. 23(2):189–202.Crossref, Google Scholar
- (1973) Dilemmas in a general theory of planning. Policy Sci. 4(2):155–169.Crossref, Google Scholar
- (2009) Capabilities unveiled: The role of ordinary activities in the evolution of product development processes. Organ. Sci. 20(2):384–409.Link, Google Scholar
- (2001) Causation and effectuation: Toward a theoretical shift from economic inevitability to entrepreneurial contingency. Acad. Management Rev. 26(2):243–263.Crossref, Google Scholar
- (1998) Perceiving and managing business risks: Differences between entrepreneurs and bankers. J. Econom. Behav. Organ. 33(2):207–225.Crossref, Google Scholar
- (2007) Remembering the past to imagine the future: The prospective brain. Nature Rev. Neuroscience 8(9):657–661.Crossref, Google Scholar
- Schilke O, Levine SS, Kacperczyk O, Zucker LG, eds. (2019) Call for papers—Special issue on experiments in organizational theory. Organ. Sci. 30(1):232–234.Link, Google Scholar
- (2021) Using mouse cursor tracking to investigate online cognition: Preserving methodological ingenuity while moving toward reproducible science. Psychonomic Bull. Rev. 28(3):766–787.Crossref, Google Scholar
- Schulte-Mecklenbeck M, Kühberger A, Johnson JG, eds. (2019) A Handbook of Process Tracing Methods (Routledge, New York).Crossref, Google Scholar
- (2022) How dynamic capabilities change ordinary capabilities: Reconnecting attention control and problem‐solving. Strategic Management J. 43(12):2447–2477.Crossref, Google Scholar
- (1985) The use of participant recollection in the modeling of organizational decision process. Acad. Management Rev. 10(3):496–503.Crossref, Google Scholar
- (2016) Homo Prospectus (Oxford University Press, Oxford, UK).Google Scholar
- (2017) Is that an opportunity? An attention model of top managers’ opportunity beliefs for strategic action. Strategic Management J. 38(3):626–644.Crossref, Google Scholar
- Sherman JW, Gawronski B, Trope Y, eds. (2014) Dual-Process Theories of the Social Mind (Guilford Publications, New York).Google Scholar
- Simon HA (1947) Administrative Behavior: A Study of Decision-Making Processes in Administrative Organization (Macmillan, New York).Google Scholar
- (1962) The architecture of complexity. Proc. Amer. Philos. Soc. 106(6):467–482.Google Scholar
- (2014) Rationality, intelligence, and the defining features of type 1 and type 2 processing. Sherman JW, Gawronski B, Trope Y, eds. Dual-Process Theories of the Social Mind (Guilford Publications, New York), 80–91.Google Scholar
- (1989) An abbreviated version of the Miller behavioral style scale. British J. Clinical Psych. 28(2):183–184.Crossref, Google Scholar
- (2019) The Psychology of Pandemics: Preparing for the Next Global Outbreak of Infectious Disease (Cambridge Scholars Publishing, Newcastle upon Tyne, UK).Google Scholar
- (2016) The time course of conflict on the cognitive reflection test. Cognition 150:109–118.Crossref, Google Scholar
- (2016) Crossroads—Identifying viable “need–solution pairs”: Problem solving without problem formulation. Organ. Sci. 27(1):207–221.Link, Google Scholar
- (1974) Dual-processes in reasoning? Cognition 3(2):141–154.Crossref, Google Scholar
- (1972) Field research on complex decision-making processes—The phase theorem. Internat. Stud. Management Organ. 2(2):156–182.Google Scholar
- (1983) The relationships among group size, member ability, social decision schemes, and performance. Organ. Behav. Human Performance 32(2):145–159.Crossref, Google Scholar
- (2012) Beyond reaction times: Incorporating mouse-tracking measures into the implicit association test to examine its underlying process. Soc. Cognition 30(3):289–306.Crossref, Google Scholar
- (2007)
Executive function: Mechanisms underlying emotion regulation . Gross JJ, ed. Handbook of Emotion Regulation (Guilford Press, New York), 135–158.Google Scholar
Daniella Laureiro-Martinez (PhD, Bocconi U.) leads the Cognition, Learning and Adaptive Behavior Group (COLAB) at ETH Zurich. She studies the cognitive antecedents of adaptive behavior in changing environments. She has published in top outlets in management and cognitive sciences. She is an active member of the Behavioral Strategy Group of the Strategic Management Society and the Innovation and Managerial Cognition Divisions of the Academy of Management.
Jose Pablo Arrieta is an assistant professor of strategy at the University of Amsterdam. He received his PhD from ETH Zurich. His research studies the links between strategic decision-making and organization design with a particular focus on how organizations converge upon, define, and adapt their goals.
Stefano Brusoni (DPhil, SPRU, U. of Sussex) is Professor of Technology and Innovation Management at ETH Zurich (CH). His research focuses on innovation and technical change at the interface between strategy and behavioral sciences.

