The Durability of Compliance Under External Accountability: The Case of the Police Data Initiative
Abstract
External accountability initiatives, which combine public disclosure of internal information with enforcement, are widely regarded as useful instruments to effect organizational compliance with external demands. Yet, even though such compliance may be fruitful only if it persists, its durability has been assumed rather than directly tested. We report on such direct tests, using the Police Data Initiative (PDI). Launched across the United States in 2015 to “decrease inappropriate uses of force,” especially against Black citizens, the PDI mandated the release of traffic stop data and increased oversight of participating local police departments. A difference‐in‐differences analysis across 36 police departments shows that PDI adoption initially reduced stops, especially in neighborhoods with more Black residents. Over time, however, these treated departments reversed course and ultimately increased stops, particularly in said neighborhoods. This backsliding was more pronounced in departments with higher pre-PDI stop rates and larger racial disparities. Our findings show limited durability of compliance under external accountability and identify conditions under which external accountability reinforces entrenched patterns over time.
Supplemental Material: The online appendix is available at https://doi.org/10.1287/orsc.2024.18975.
Introduction
Contemporary organizations increasingly face accountability pressures from a broad array of constituencies that extend beyond traditional shareholders and employees to include interest groups, regulatory bodies, and civil society (King and Pearce 2010). In response, many organizations adopt external accountability initiatives (Espeland and Sauder 2016). These initiatives go above and beyond simple public disclosure of internal information (transparency) by combining it with channels for distribution of contingent rewards or sanctions (enforcement). In doing so, they are often designed to align organizational practices with external audiences’ demands. A familiar example is “diversity reports” (e.g., Google 2012), which publicize employee and/or customer demographics and invite reputational consequences from external audiences, such as watchdog organizations. Similar initiatives impose accountability for gender pay gaps (Obloj and Zenger 2022, Sharkey et al. 2022, Lyons and Zhang 2023) or environmental footprints (Doshi et al. 2013, Kim and Lyon 2015, Marquis et al. 2016).
However, is more faith being put into such accountability initiatives than the evidence warrants? For initial compliance, existing work does offer promising, though somewhat conditional, evidence of impacts from those initiatives. For instance, Bennedsen et al. (2022), Obloj and Zenger (2022), and Lyons and Zhang (2023) find that mandated gender pay gap transparency measurably narrows pay disparities, in part by curbing male wage growth. Chatterji and Toffel (2010) document that firms respond to environmental ratings when compliance is cheaper and reputational benefits greater (see also Reid and Toffel 2009, Kim and Lyon 2011, Sharkey and Bromley 2015). Even though such initiatives may not always produce universal effects (cf. Doshi et al. 2013), prevent unintended consequences (cf. Lee and Kaul 2025), or operate through theorized mechanisms (cf. Sharkey et al. 2022), these studies collectively underscore that external accountability initiatives, even some with minimal enforcement channels, can initially shift organizational practices.
Yet such evidence of initial compliance may present only half the picture. In particular, compliance that fades over time may undermine the very purpose of accountability initiatives, which is to ensure lasting organizational change that aligns with external demands. For instance, a temporary reduction in the gender pay gap does not achieve the underlying objective of removing that disparity more permanently. Nevertheless, the durability of compliance under such accountability initiatives has received little direct empirical scrutiny. Certainly, there are good theoretical warrants in extant work to presume that continuous monitoring and enforcement by external audiences help sustain compliance over time, especially if they effected compliance in the first place (cf. McDonnell et al. 2015, Eesley et al. 2016). Organizational members may even internalize demands from external audiences and establish new organizational procedures and routines that outlast direct pressures (Espeland and Sauder 2007, Hallett 2010). Other studies further suggest that accountability initiatives may elicit lasting structural and/or cultural changes even if direct external pressures ease (cf. Nelson and Winter 1985, Feldman and Pentland 2003). However, despite strong theoretical possibilities and indirect tests of durability provided in some notable studies (cf. Bennedsen et al. 2022, Obloj and Zenger 2022), the durability of compliance under external accountability initiatives has received little direct empirical examination (see Lyons and Zhang 2023, though, for an important exception).
This lack of direct tests is concerning for both theoretical and practical reasons. Theoretically, despite compelling reasons to presume lasting compliance, other work warns that external monitoring and enforcement may diminish once headlines fade. In such situations, organizations may resort to temporary compliance rather than long-lasting change. This is analogous to what Loewenstein et al. (2011) term the “limits of transparency” (cf. Westphal and Zajac 1998, Bromley and Powell 2012), where initial disclosures provide moral license to external audiences and lead to assumptions that the problem is solved. In such cases, vigilance may wane over time. Furthermore, even if organizations initially comply with external demands, underlying organizational conditions may remain largely intact. And those underlying conditions may allow organizations to gradually reverse their initial compliance and reinforce their prior practices, even under external accountability. Relatedly but distinctively, faced with diverse stakeholders to whom they are accountable, organizations may not distribute their attention and resources evenly. Rather, they might act strategically to manage scrutiny and evade criticism from the powerful stakeholders who may have driven the original “problematic” practices in the first place (cf. Marquis et al. 2016, Fabrizio and Kim 2019). Because of any one or some combination of these forces, it is plausible that the initial promise of external accountability does not necessarily translate into lasting change.
Empirically examining the lasting effects of external accountability initiatives also carries practical stakes. If policymakers, activists, and organizational leaders see such initiatives as viable tools to hold organizations accountable, understanding their sustained impacts may guide them to design initiatives that elicit lasting compliance, are more embedded into routine practice, and instigate structural reform. If compliance does not produce sustained changes, other complementary initiatives—such as enhanced monitoring and enforcement systems over time—may be necessary to prevent backsliding. In sum, distinguishing between initial and sustained change is essential if external accountability is to serve as a reliable tool for meaningful and enduring reform.
Therefore, we directly test the durability of compliance under external accountability. To do so, we examine the Police Data Initiative (PDI), launched and adopted in 2015 under the (President Barack) Obama administration. Its goals were to address police officers’ excessive intervention in citizens’ lives, especially those of Black citizens. Under these goals, the Initiative made police officers’ traffic stop records—previously available only internally—publicly available. Also, it implemented other accountability measures in collaboration with civic organizations, with the explicit objective of “decreas[ing] inappropriate uses of force” (The White House 2015). The Initiative, in many (though not all) cases, was adopted by each police department in consultation with its leadership. However, the rank-and-file officers who make traffic stops on the front lines were not involved in or aware of such conversations prior to the policy’s adoption by their local departments. This allows us to examine the effects of an external accountability initiative on the behavior of on-the-ground, rank-and-file officers, despite important caveats that we lay out below.
We use a difference-in-differences (DiD) framework to first show that after the PDI was launched, officers in adopting departments (treatment group) made larger reductions in overall traffic stops than those in departments that did not adopt the PDI (control group). This reduction was especially pronounced in neighborhoods with larger Black populations (i.e., neighborhoods that were widely considered to suffer from disproportionately more “inappropriate” police interventions). However, this compliance disappeared over time. In fact, officers in treated departments reversed course over time and ultimately made even more traffic stops overall, especially in neighborhoods with more Black residents. Consequently, preexisting disparities in both the number of traffic stops and their allocation (i.e., where those stops were concentrated) were reinforced under the PDI.
We further investigate this dynamic—the attenuation and then reversal of initial effects over time—by focusing on the status quo conditions. In particular, we focus on the structural and cultural practices that existed in police departments before the PDI. If the PDI barely transformed these conditions, reversal of the initial compliance may be more likely in departments with more “problematic” status quos. Indeed, we find evidence of such backslides only among departments that, prior to the PDI, had made more traffic stops per capita or showed greater racial disparities in their allocation of traffic stops across neighborhoods.
In sum, our findings challenge the notion that external accountability necessarily elicits durable organizational change, even in the presence of initial compliance with external demands. In doing so, we highlight the importance of an organization’s status quo conditions: the further the organization’s existing practices are from external demands, the more likely its initial compliance under external accountability may unravel. We also explicitly identify several specific theoretical mechanisms for future research to isolate. More practically, our findings suggest that the initial benefits associated with external accountability initiatives should be weighed against their potential for backslides as well as implementation costs. Consequently, we reveal structural challenges involved in using external accountability initiatives to address what external audiences see as problematic within contemporary organizations.
Theoretical Framework
Becoming Accountable to External Audiences
Classic accountability research starts out by focusing on accountability as an internal control problem (Holmstrom 1979, Lerner and Tetlock 1999). But the relevant costs and benefits often accrue to outsiders, such as social activists, watchdog organizations, or the general public, even though those outsiders typically lack direct leverage on internal organizational practices. In many such situations, external accountability, that is, accountability to external audiences, is designed to address that problem. In short, it couples public disclosure with channels that allow external audiences to monitor performance and impose consequences, such as reputational cost, legal action, market responses, or media scrutiny (King and Pearce 2010). This implies that external accountability may be a useful tool for handling some problems that internal controls alone are limited in addressing.
Accordingly, external accountability initiatives have recently become common, especially in the case of public-sector organizations, whose practices bear consequences on outsiders who are also entitled to keep those organizations in check (King and Pearce 2010; cf. Lipsky 1980, Gibbons 1999). For example, police departments have faced intensified demands for external accountability from social movements and watchdog groups, who view internal hierarchies as unable to improve discretionary practices, such as biased stop-and-frisk activities or excessive use of force (Legewie 2016, Schwartz 2019). But above and beyond public-sector organizations, publicly traded firms also routinely disclose environmental, social, and governance metrics in response to demands from social activists (Kim and Lyon 2015, Marquis et al. 2016). Other organizations are also subject to a broader array of external enforcement mechanisms via news coverage, shareholder resolutions, or civil litigation, which may lead them to change practices that their internal controls alone may fail to address (Feldman and Pentland 2003, Marquis et al. 2016).
Adding to the theoretical promise of external accountability initiatives, studies with careful empirical examinations document that these initiatives produce prompt and measurable shifts in organizational behavior across a variety of sectors. For instance, mandatory gender pay gap disclosures led to significant reductions in pay disparities in their immediate aftermath (Bennedsen et al. 2022, Obloj and Zenger 2022). Similarly, environmental reporting requirements have been linked to declines in carbon intensity among high‐emitting firms (Chatterji and Toffel 2010, Lyon and Shimshack 2015; cf. Sharkey and Bromley 2015, Jung et al. 2024). To be sure, such initiatives may elicit unintended consequences, as organizations under environmental initiatives may externalize other types of toxic waste while complying with the key metrics that are being tracked (Lee and Kaul 2025; cf. Doshi et al. 2013, Ody‐Brasier and Sharkey 2019). Also, the precise mechanisms underlying such effectiveness remain ambiguous. Namely, Sharkey et al. (2022) find little evidence of a negative postdisclosure reaction for firms reporting sizable gender-based pay disparities. That is, even though reputational rewards and penalties are often theorized as a key mechanism, negative reputations may not necessarily follow deviation on those metrics. Nevertheless, across these contexts, notable and well-designed studies underscore a relatively consistent pattern: once organizations’ practices become subject to external accountability, they tend to respond by, at least initially, aligning with external demands.
Does the Initial Compliance Necessarily Last Over Time?
Another critical premise behind the design of external accountability initiatives is that initial compliance would last over time. This is fundamental: if organizations initially change their practices but quickly revert to their status quos, external accountability initiatives would be confined to being costly interventions with limited impact. Temporary reductions in carbon emissions may mean little to environmental protection. The same applies to the gender wage gap.
This premise of sustained compliance rests on some convincing theoretical ground, but it turns on three levers that can also undermine compliance over time. These levers concern (1) whether external audiences sustain monitoring and enforcement, (2) whether initial adjustments become embedded in internal routines, and (3) which external audiences’ demands are most consequential.
Sustained vs. Short-Lived Monitoring and Enforcement.
First, and relatively straightforwardly, sustained compliance may follow sustained external pressure. External audiences may maintain vigilance, thereby monitoring performance metrics and imposing reputational, legal, or financial sanctions on organizations that deviate from their demands (King and Soule 2007, Reid and Toffel 2009, Kim and Lyon 2011). This is certainly reasonable if external audiences see the issue as important for their own and/or a greater good. It also seems plausible, especially if their monitoring and enforcement were effective in eliciting compliance in the first place.
Yet the same logic also implies some plausibility for backsliding. In short, external scrutiny may wane over time because external audiences simply lose interest or vigilance, and their priorities may then shift to competing issues (cf. Hoffman and Ocasio 2001, Fremeth et al. 2022). Scrutiny may also become harder to sustain because of obfuscatory strategies that organizations implement (Fabrizio and Kim 2019). But even if priorities do not change, external audiences may become complacent after (mis)interpreting initial compliance as evidence of lasting change. This is analogous to “limits of transparency” as noted by Loewenstein et al. (2011; cf. Westphal and Zajac 1998, Bromley and Powell 2012). They argue that initial disclosures can create a moral licensing effect, leading observers to assume that the problem is solved, and they may reduce their vigilance over time. In an analogous context, Marx et al. (2026) suggest that venture capitalists initially increased their investment in Black-founded startups after the murder of George Floyd in 2020, but it reverted to prior levels after the initial attention subsided. Lee et al. (2026) further point to local newspapers as a specific intermediary through which firms face sustained scrutiny on their corporate social responsibility activities. Consequently, one salient possibility is that, despite initial compliance, organizations revert to their prior behaviors once external attention fades.
Institutionalized vs. Superficial Compliance.
A second lever concerns whether initial compliance becomes internally self-sustaining through institutionalization or fleeting by remaining superficial. As organizations initially comply with external demands, that compliance may become routinized over time (cf. Hannan and Freeman 1984). Most prominently, Sauder and Espeland (2009) highlight how law school administrators do not superficially comply with metrics imposed by the U.S. News & World Report but actively reform their organizational routines and even values in response to surveillance and external pressures they see as omnipresent and all-encompassing (see also Covaleski et al. 1998, Espeland and Sauder 2016). Such changes may be structural and/or cultural, whereby initial compliance becomes viewed as normative and embedded into everyday decision making (cf. Oliver 1991, Sutton and Dobbin 1996, Delmas and Toffel 2008, Schembera et al. 2023). If so, initial compliance with external demands may become more irreversible.
But the flipside of this logic also implies fleeting compliance. That is, the impetus for external accountability is often external audiences’ dissatisfaction with the organization’s existing practices, but those very existing practices imply underlying structural and/or cultural conditions that diverge from what compliance requires. Those same underlying conditions may generate inertia, making compliance especially ephemeral even if it occurs initially. Therefore, absent deeper and costlier changes, organizations may gradually revert to established routines.
Accountability-Backing vs. Incumbent Audience.
A third lever concerns audience composition. Durable compliance may be more likely when external demands remain coherent and the accountability initiative continues to privilege audiences whose preferences align with its stated goals. For instance, upon the launch of an external accountability initiative, the organization may initially and continue to adhere to the demand of those who helped implement that initiative in the first place (e.g., social movement activists). In such situations, insofar as their vigilance stays constant, initial compliance likely persists over time.
Yet compliance may be short-lived if incumbent and more powerful audiences instead demand the status quo. External audiences are often multiple and heterogeneous, with expectations that can be diffuse, conflicting, or unevenly enforced (Karunakaran 2024; cf. Pache and Santos 2010). In such situations, the organization may face the nearly impossible task of satisfying contradictory demands. Therefore, even if it initially complies with the initiative’s stated goals by favoring one audience’s preferences, it may later reverse course as influence shifts among audiences, especially if those preferences conflict with demands from a more powerful audience (cf. Edelman et al. 1999).
This may further be compounded by organizations’ strategic response to accountability initiatives. Marquis et al. (2016, p. 483) directly illustrate how the organization may manage scrutiny and evade criticism through strategic actions: firms may “selectively disclose relatively benign impacts, creating an impression of transparency while masking their true performance.” Such strategic actions may become even more likely when an external accountability initiative’s stated goals conflict with the more powerful audience’s demands. In other words, the organization may first comply with goals that are more consistent with the less powerful audience’s demands (e.g., those by social activists), but the organization may gradually comply more actively with contradictory demands by the more powerful incumbent audience. In this case, the premise of sustained compliance may become fragile.
In sum, these three levers all provide theoretical warrants to expect durable effects of external accountability initiatives but also those to expect short-lived ones. These forces are conceptually distinct yet may co-occur in practice, which makes the durability of compliance under external accountability an empirical question.
Existing Evidence and Empirical Challenges
Yet, despite the substantive import and theoretical ambiguity surrounding the premise of sustained compliance, empirical work testing it directly remains limited. Nevertheless, some research offers hints based on its indirect tests. A notable example is from Sharkey et al. (2022), who investigate reputational consequences following gender pay gap disclosure. Related to our purposes, they document a dynamic aspect of reputational consequences—specifically, “a short-lived improvement in employees’ evaluations of organizations reporting pay parity” (Sharkey et al. (2022, p. 1136). This finding hints that the external audience’s reactions to accountability initiatives may change dynamically over time. However, this study focuses on how the audience reacts to organizational behavior under an external accountability initiative, not how the organization complies with the external audience’s demand over time—the latter of which more directly relates to the premise of sustained compliance.
Another example derives from a line of careful empirical work examining organizations’ responses to various transparency or accountability measures. Bennedsen et al. (2022) track gender pay disparities before and after mandated transparency in Denmark and qualitatively document some erosion of compliance over longer periods of time. Nevertheless, their analytical focus is on the overall effect of the accountability initiative (which is certainly important on its own); thus, their study does not directly examine when, or the extent to which, such erosion may occur (see also Doshi et al. 2013, Obloj and Zenger 2022).
Perhaps the most exemplary study on this front comes from Lyons and Zhang (2023), who investigate whether salary transparency reduces gender pay inequality in Canadian universities. They find evidence for reduced gender pay gaps by considering about 15 years of gender pay inequality after the initiative’s introduction. Given this extended period of time examined, this serves as the most direct and convincing test of the durability of compliance. However, somewhat ironically, this effect seems to be accompanied by relatively “little media attention” (Lyons and Zhang 2023, p. 2005) or little stakeholder attention (e.g., union), which may make sustained effects more difficult to emerge but also make the reversal or backlashes—for instance, based on incumbent audience response—also less likely.
Therefore, this article’s task is twofold. First, we track the effects of an external accountability initiative over time. We do not have an a priori theory as to what constitutes “initial” versus “lasting” compliance, but we structure our analyses temporally to explicitly focus on the durability of compliance. Second, we identify conditions in which lasting as well as short-lived compliance occurs. In particular, we focus on organizations’ status quo conditions—specifically, how far organizations deviate from external demands prior to the introduction of an external accountability initiative. The underlying logic is that organizations’ preexisting degree of deviation from external demands may reflect structural and/or cultural status quo conditions that help undermine and reverse initial compliance over time. Both of these tests are exploratory by design and have no explicit theoretical predictions because our focus is on probing the empirical validity of the premise of sustained compliance. Therefore, our empirical tests aim to assess both the promises and limits of the current premises around external accountability.
Empirical Case and Data
Context: Police Data Initiative and Local Police Departments in the United States
In tackling these tasks, we examine local police departments across the United States as organizations that faced an external accountability initiative. Police here serve as a relevant empirical context that has increasingly faced widespread calls for external accountability. Such calls often stem from perceptions of excessive and potentially discriminatory interventions in the lives of Black citizens and misaligned service priorities. In particular, there has been a substantial body of reports, ranging from media coverage to scientific research, that highlight how police intervene in Black citizens’ lives significantly more than in those of other racial groups and, too often, unfairly (Parker et al. 2004, Grogger and Ridgeway 2006, Legewie 2016). Although debates persist about the accuracy of these perceptions across different dimensions of police work (cf. Fryer 2019), recent social movements such as Black Lives Matter underscore the public’s concern about use of force against Black citizens—concerns sufficient enough to generate demands for greater accountability (Phelps et al. 2021, Oliver et al. 2022, Pickett et al. 2022; see Soss and Weaver 2017 for review). Thus, our present investigation proceeds with the premise that such perceptions do exist and drive demands for changes in both the levels and patterns of police interventions in civilian lives (which we operationalize in detail below). Although identifying actual bias in police practices remains important, we are, for our current purpose, agnostic about whether and how the police interventions we observe are just or fair, focusing instead on compliance with external accountability pressures.
It is in this broad context that the Police Data Initiative was introduced by the U.S. federal government under the Obama administration in May 2015. Launched as part of the broader federal-level police reforms following escalating tensions between police and civil society, the PDI was introduced on the premise that enhancing external accountability can help police gain trust and legitimacy with the communities they serve (President’s Task Force on 21st Century Policing 2015). In particular, the focus of the President’s Task Force—established in the wake of the killing of Michael Brown and the beginning of the Black Lives Matter movement in 2015—was on how police and law enforcement officers profile and discriminate against citizens based on race, among other characteristics. For example, one of the Task Force’s recommendations emphasizes “Law enforcement agencies should adopt and enforce policies prohibiting profiling and discrimination based on race, ethnicity, national origin, religion, age, gender, gender identity/expression, sexual orientation, immigration status, disability, housing status, occupation, or language fluency” (President’s Task Force on 21st Century Policing 2015, p. 28). In a similar vein, it also evoked the need to diversify the workforce in terms of race, among others, to manage biases and “improve understanding and effectiveness in dealing with all communities” (President’s Task Force on 21st Century Policing 2015, p. 16).
The PDI’s design had two primary components of accountability: transparency and enforcement. For the former, it required participating police departments to publicly release previously internal traffic stop data, including timing, location, and nature of engagement. The PDI also implemented a broader apparatus for systematic collection, maintenance, and publication of traffic stop information. This was carried out through university research centers and other nonprofit organizations, such as the National Policing Institute (President’s Task Force on 21st Century Policing 2015), to ensure disclosed information received proper analysis and oversight (cf. Lewis and Carlos 2022, Sharkey et al. 2022, Buntaine et al. 2024).
The latter component, enforcement, is largely indirect here, as it operates primarily through reputational exposure and normative or political pressures rather than formal legal intervention. Administratively, the PDI included technical tools and assistance to elicit public assessments and reputational enforcement (see Caplan et al. 2015). That is, the PDI’s enforcement channel was mainly about making stop patterns legible to external audiences so that external scrutiny, via media, civic groups, and social movement groups, for instance, could translate into reputational and normative consequences. Specifically, local police departments were required to partner with advocacy groups to facilitate the dissemination and analysis of disclosed information. From a technical standpoint, police departments collaborated with organizations such as Code for America and private-sector technology firms, including Socrata, ESRI, and CI Technologies, which furnished technical expertise or software solutions to facilitate data extraction and public accessibility. Furthermore, the National Policing Institute concurrently developed a national “public safety open data portal” to enhance information availability. At the federal level, the White House Presidential Innovation Fellows and the U.S. Chief Technology Officer and Chief Data Scientist created guidelines through Open Data Handbook and Open Data and Policing Handbook. These efforts also fostered community engagement initiatives, such as the Summerware hackathon held by the New Orleans Police Department in 2015—one of the PDI-participating departments—partnering with Operation Spark, a nonprofit organization that teaches coding to youth and engages them in analyzing police data.
These components of the accountability initiative were compulsory for participating departments. That is, individual police officers could not opt out (cf. bodycams in Ariel et al. 2016a, b, c). More broadly, it was designed to compel officers to “embrace a culture of transparency” (President’s Task Force on 21st Century Policing 2015, p. 13), based on which, they were, in theory, subject to rewards or punishments from various stakeholders. In this way, the PDI serves as a clear treatment of an external accountability initiative.
But it is also important to note that at the organizational level, the PDI was not “imposed” by the federal government on select local police departments (cf. Overman et al. 2021, Overman and Schillemans 2022). Two contextual features are worth noting. The first is that participating departments all voluntarily participated in it, and there are many others that did not (The White House 2016). Nevertheless, this self-selection was made by the leadership, such as mayors or police chiefs, rather than rank-and-file officers. Once their police departments decided to participate in the PDI, rank-and-file officers could not opt out of any part of the accountability process implemented through the PDI. The second source of selection is the policymaking process (The White House 2014): members of some (but not all) local police department leadership teams were involved in the process of designing the PD in that they were invited to the White House during the policymaking process and presumably provided some types of input. Given this involvement of some police departments in shaping the intervention itself, we do not view the PDI as an exogenous treatment on each police department leadership’s behavior. However, given that our focus is on rank-and-file officers’ responses to the external accountability initiative, we see it as possible to draw some inferences about the PDI’s effects on how these officers make and allocate policing as a public service. We further illustrate possible sources of bias that may arise from such voluntary participation and subsequent caveats that are warranted for our inference below.
In sum, using the adoption of PDI in May 2015 as an external accountability initiative targeting rank-and-file police officers, we examine initial and sustained compliance and the underlying conditions. Traffic stops here are especially useful as a type of public service that police use their discretion to allocate relatively freely from other constraints, as they are typically initiated by police (unlike responses to 911 calls; cf. Shoub et al. 2021, Karunakaran 2024, Ananthakrishnan et al. 2025). Stops were also the primary measure of police intervention in the design of the PDI. We thus see traffic stops as a suitable empirical measure of organizational responses to external demands under the PDI (cf. Phelps et al. 2021).1
Data
Twenty-one local police departments started participating in the PDI, including 19 municipal police departments and two county police departments, in May 2015 (The White House 2016). But in order to estimate the PDI’s effect on traffic stop–making patterns, it is crucial to account for how traffic stops were made prior to its implementation. These data are available from the Stanford Open Policing Project (SOP) (Pierson et al. 2020), which collected traffic stop data from each state through Freedom of Information Act (FOIA) requests and made them publicly available since 2017 (see Su 2021, Ekstrom et al. 2022, Grosjean et al. 2023, Powell 2023).2 The SOP Project has collected data from nearly 100 million traffic stops by 33 state patrol agencies and 55 municipal police departments, mostly from 2010 to 2016, although data coverage varies by state and year. This availability of the pre-PDI data allows us to examine changes in police’s traffic stop–making behavior plausibly induced by the PDI. Despite this availability of data that predate the PDI, we here assume that police officers were not aware until May 2015 that their traffic stop data would be subject to external observation to this extent and that the technical availability of traffic stop data before the PDI had not systematically influenced how police officers made stops during that time period.3 Therefore, we attribute differences before and after the PDI to the PDI’s impact on how traffic stops are made, notwithstanding the caveats we note below.
For many police departments, this data set contains information as to each traffic stop, including the date, location, nature of the violation, and the officer’s identification number, though its availability varies across departments. There is information on stop outcomes for some departments (e.g., arrests, citations, warnings, no action), but this is not the case for most departments. Such availability of information also varies with respect to stopped drivers (e.g., race, age, or gender) and the reason for the stop. Given these constraints, our final sample comes from 36 local police departments in the SOP data set, which offers details regarding the exact timing and location of traffic stops (i.e., latitude and longitude coordinates; see Figure 1 and Online Appendix A, Table A1). Among them, six police departments participated in the PDI (treatment group), whereas the remaining 30 did not (control group). Based on the timestamps associated with traffic stops, we use a difference-in-differences framework to estimate changes in the overall number of stops following the implementation of the PDI (see below for more on the analytical strategy). If the overall number of stops changed after the implementation of the PDI in the treatment group compared with that in the control group, we see that as indicating the PDI’s influence.
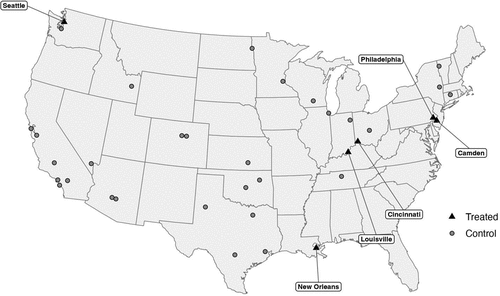
Notes. Black triangles indicate six police departments (PDs) that participated in the Police Data Initiative (PDI) and therefore constitute our treatment group in the difference-in-differences analysis. Gray circles indicate 30 PDs that did not participate in the PDI and are used as our control group. For more detailed information on police departments in the sample, see Table A1 in Online Appendix A.
Yet changes in the overall number of traffic stops may only tell a partial story. At the extreme, even if the overall number of traffic stops remained constant following the PDI, officers may have changed how they allocated traffic stops across different neighborhoods (e.g., fewer stops in neighborhoods of more Black residents). The issue of allocation is what often led to the introduction of the PDI: different types of neighborhoods, especially those with different racial compositions, are believed to experience traffic stops in ways that seem to deviate from expected patterns based on factors such as population size. To address the question of stop allocation across different neighborhoods, we investigate how police departments distribute traffic stops across neighborhoods with different racial compositions before and after the PDI.
In particular, we focus on neighborhoods, or regional communities more broadly, that often share common culture and history (Sampson 1987, Sampson and Raudenbush 1999, Hipp 2007, Marquis et al. 2011, Greve and Rao 2012, Sharkey and Faber 2014) as well as socioeconomic characteristics (cf. Olzak 2021; Chetty et al. 2022a, b). Experiences with police also tend to differ by neighborhoods (Smith 1986, Terrill and Reisig 2003, Braga et al. 2019), partly because police actions are also governed by directives in their “precincts” or “beats” that cover certain neighborhoods (Hassell 2007). Based on this conceptual rationale, we define neighborhoods at the U.S. Census Bureau tract level (e.g., Drakulich 2013, Drakulich and Crutchfield 2013, Ananthakrishnan et al. 2025).4 Data on tract-level neighborhoods are available from the National Historical Geographic Information System (NHGIS) (Manson 2020) and the 2015 American Community Survey (ACS). Our analysis focuses on tracts whose population is greater than 100 based on the 2015 ACS, as tracts smaller than this threshold may barely qualify as residential areas, and often serve as special-use tracts for airports, public parks or forests, or bodies of water.
Analytical Strategy and Sample Construction
To isolate the dynamic treatment effect, we employ a difference-in-differences framework using 36 police departments whose stop records before and after the PDI are available—six treated departments that adopted the PDI and 30 control departments that did not. We define treatment as occurring in the first week of May 2015, when the PDI was launched and news of its adoption reached rank-and-file officers without prior consultation (The White House 2016).
Our main analyses compare all treated departments against all control departments. Individual departments may have particular trends in traffic stop patterns (e.g., seasonality) that are unlikely to generalize across departments. Relying on single-department estimates would therefore be more susceptible to idiosyncratic disturbances, making it difficult for us to differentiate systematic treatment effects from such idiosyncrasies (Donald and Lang 2007, Conley and Taber 2011, Lipsitz and Starr 2022). In turn, aggregating across departments whose data are available—drawn from 36 cities across the country—should help reduce the influence of any one department’s particularities, including seasonal patterns and thus make it more plausible that observed changes reflect the PDI (Silver 2012).
Nevertheless, aggregating departments raises concerns that outlier departments among treated or control groups might disproportionately affect the treatment effect. Therefore, in order to address this possibility, we also conduct some post hoc analyses where we systematically exclude one treated department at a time (Online Appendix B). We see these analyses not merely as diagnostic tools for detecting possible outliers but as substantively meaningful exercises. In particular, insofar as our empirical tests as a whole are explicitly exploratory and try to probe the durability of the PDI as an external accountability measure, such post hoc analyses should also help us reveal its empirical scope.
Finally, our empirical design relies on a six-week pretreatment period. For posttreatment periods, we begin with the six weeks immediately following the PDI’s implementation and then incrementally extend the window by four-week intervals: 6 weeks, 10 weeks, 14 weeks, iterating through 30 weeks posttreatment before the year 2015 ends. Each comparison contrasts the same six-week pretreatment period against these dynamic posttreatment windows. This approach allows us to examine both initial compliance and its persistence without imposing predetermined definitions of “short-term” or “long-term” effects.
Inferential Caveats Based on Potential Sources of Bias
Nevertheless, inferences from our findings should be made with caution because of three possible sources of bias, which stem from the nature of our data set and also police departments’ voluntary participation in the PDI.
Our Sample Includes Only Police Departments Whose Data Are Available from the SOP.
Insofar as such data availability is not random, this may imply that departments in our sample respond more fully to external regulatory pressures (e.g., data disclosure based on FOIA, accountability based on PDI). If so, treated departments available in the SOP may be more likely to adhere to the implicit and explicit intent behind the PDI (i.e., “decrease inappropriate uses of force”) than treated departments not in the SOP.
We address this selective sampling in two ways. First, we compare the sampled versus nonsampled departments based on observables from a different data set (Online Appendix A). This comparison shows that there is no statistically or substantively significant variation in observables, such as the size of the population they serve or that of the department. Nevertheless, there may be unobservable differences between departments in our sample and those not in our sample. Given this limitation, we interpret our findings as reflective of “more compliant” departments, which are more likely to comply with external demands and sustain such compliance.
The Adoption of the PDI Was Not Entirely Exogenous—Police Departments Voluntarily Participated in the PDI, Rather than Being Randomly Assigned to It.
This concern is perhaps more fundamental, so one of the authors conducted interviews with high-ranking officers in one of the treated police departments (Seattle). To be sure, such interviews may not reflect the “true” nature of the adoption of the PDI (Jerolmack and Khan 2014), but the interviews confirmed that the PDI was adopted by the mayor and, most importantly, without consultation with rank-and-file officers. Nonetheless, even if this is the case, the self-selection into the PDI in and of itself may have been guided by the decision maker’s (e.g., mayor’s) own forecasts of the PDI’s likely consequences. This self-selection at the departmental level raises questions about whether compliance patterns we observe reflect PDI effects or some confounding ones—that is, preexisting departmental characteristics that influenced both PDI adoption and initial or sustained compliance. For example, adopting departments may have been under heightened political pressure, led by reform-oriented leadership, or already on trajectories that would have changed stop patterns independently of the PDI. If so, the treatment effects we estimate below can be understood as local to this particular population of voluntary adopters and may either overestimate the PDI’s independent effect (if adopters were already changing) or underestimate the difficulty of achieving similar outcomes in departments that would not have voluntarily participated.
We also address this potential endogeneity in two ways. First, we assess the degree to which the treated group is different from the control group in supplementary analyses, again based on observables from a separate data set (Online Appendix A). Second, we interpret post-PDI changes in treated departments as reflective of “more willing” departments, which are again more likely to comply with external demands and sustain such compliance. We come back to this point in the discussion section below.
Police Officers May Underreport Stops They Make and/or Falsely Report Stops as Having Been Made in a Different Location than the Actual Location.
Insofar as the PDI may induce more false reporting (Ody‐Brasier and Sharkey 2019) and/or avoidance (Anteby and Chan 2018), this may be a general problem. This concern thereby warrants an inferential caveat: effects consistent with the intents behind the PDI’s design (i.e., “decrease inappropriate uses of force”) should be interpreted with extra caution. A flipside of this caveat is that any findings contrary to durability of initial compliance—for example, increases in the overall number of stops or in the relative number of stops in neighborhoods with more Black residents—may be a conservative estimate. We address this last possibility further in the section titled “Consideration of Different Mechanisms” below.
Estimation
Based on this analytical strategy and inferential framework, we estimate the following model using ordinary least squares (OLS):
We include tract fixed effects, which allows us to control for unobserved heterogeneity at the tract level that remains constant over time. Because tracts are nested within departments, this also controls for all time-invariant department-level characteristics, such as department culture or organizational practices (e.g., Ouellet et al. 2019). In our case, whereas the amount (i.e., the overall volume) and allocation of traffic stops (i.e., the distribution of stops across tracts by Black-resident share) could be associated with unique tract characteristics (e.g., Kirk and Papachristos 2011), those fixed effects help alleviate these concerns.
We cluster standard errors at the tract level. The conventional practice in difference-in-differences estimation is to cluster at the level of treatment assignment, which, in our case, is the police department (Bertrand et al. 2004, Cameron and Miller 2015). However, department-level clustering is likely unreliable in our setting because our sample includes 36 departments, with just six in the treatment group. This number of departments in the treatment group falls well below the threshold at which cluster-robust variance estimation is considered dependable, as the asymptotic theory underlying these standard errors requires a large number of clusters; otherwise, the resulting estimates tend to be biased (Cameron and Miller 2015). This problem may become especially salient when the number of treated clusters is very small (MacKinnon and Webb 2017, 2020).
We thus cluster standard errors at the tract level instead, which accounts for serial correlation within tracts over time. This assumes that, conditional on tract and week fixed effects, residuals are uncorrelated across tracts within the same department. Especially in our analysis on how the PDI shifted the distribution of stops across tracts with different racial compositions, the treatment effect varies at the tract level, which makes tract-level clustering more appropriate for capturing this heterogeneity. Because tract fixed effects absorb time-invariant department-level characteristics (i.e., each tract belongs to exactly one department), the remaining concern is time-varying, department-specific variations not entirely captured by the common week effects. However, we believe this concern is unlikely to pose a serious threat in our setting. Most of all, we are not aware of any major policy changes or operational disruptions within these departments during the time frame of our analysis apart from the PDI itself and an idiosyncratic event that took place in Philadelphia during this time period, which is explained below. Second, although some decisions are made at the department level, much of the variation in policing also reflects neighborhood-specific circumstances (e.g., local crime patterns). Third, our sample covers multiple cities in different states. This means that any unobserved department-specific shock would need to coincide in timing across them to bias our estimates, which is less plausible by the geographic and institutional diversity of our sample. We nonetheless acknowledge that our standard errors may understate uncertainty to the extent that correlated, department-wide shocks beyond the PDI are present. Therefore, we see it as an inherent limitation of our setting with only a few treated units, which we note below when interpreting our findings.
The period before the treatment is defined as weeks leading up to the first week of May 2015, whereas the period after the treatment is defined as weeks following the first week of May 2015. The choice of and presents a unique challenge partly because this choice needs to help us examine sustained compliance, but also because there are methodological trade-offs between longer and shorter periods to consider (e.g., Egami and Yamauchi 2023) (we find consistent outcomes when defining it as four or eight weeks before the PDI). For , we define the six weeks preceding the PDI as the pre-PDI period. For , we begin with six weeks after the PDI and subsequently extend the post-PDI period by four weeks, reaching up to 30 weeks post the initial treatment. This incremental approach allows us to trace the durability of compliance over time. Whereas longer posttreatment periods do raise concerns about confounding events, such confounders would need to systematically affect only the treatment group’s traffic stop patterns but not the control group’s patterns. Because PDI adoption was voluntary, it is possible that these treated departments are jointly susceptible to a common confounder. We address this concern below when we compare analyses from shorter versus longer posttreatment periods. In testing how the PDI as an external accountability initiative changed the allocation of traffic stops and thereby changed the allocation of traffic stops across tracts with different characteristics, Equation (1) can be extended as Equation (2) so that we can estimate heterogeneous effects of the treatment across neighborhoods with proportionally more or fewer Black residents:
Results
Descriptive Statistics
Figure 2 shows a histogram illustrating the distribution of traffic stops per capita across 36 local police departments within the sample for the entire year of 2015 (i.e., including stops from pre- and post-PDI). As usual with this type of data, the distributions are skewed heavily to the right. The mean number of weekly stops at the tract level is 8.05, and the mean number of weekly stops per capita at the tract level is 0.0023 (that is, on average, 23 tract-level weekly stops per 10,000 people). Among the six police departments in our sample that participated in the PDI (treatment group), the average weekly tract-level stops are 12.2, and that of tract-level stops per capita is 0.0035. Among the 30 non-PDI police departments in our sample (control group), the average weekly tract-level stops are 7.16, and that of tract-level stops per capita is 0.0020. These differences in level between the control and treatment groups are not problematic per se for our analytical strategy, given that we are interested in the relative change between them after the adoption of the PDI.

Notes. Data for this figure come from 36 police departments (PDs) in the final sample. Panels (b) and (c) offer a closer look at (a) by splitting it into two subpanels that include stops per capita below 0.025 vs. those at 0.025 or above. The y-axis of (a) is log transformed, whereas the y-axes of (b) and (c) are not.
A notable impetus behind the PDI was the imbalance in the number of stops made across different neighborhoods (i.e., uneven allocation of policing), especially depending on their demographic composition, such as the proportion of Black residents. Figure 3 breaks down the distribution of the tract-level number of traffic stops per capita by each week across four quantile groups based on the proportion of Black residents within each city. This confirms the common suspicion that often underpins external accountability initiatives such as the PDI we investigate. For example, the average per-capita number of stops is almost twice as large in tracts with the highest compared with the lowest Black resident populations (i.e., Q4 and Q1 tracts, respectively). Again, we here are agnostic to how actually “justifiable” such imbalance is, given that there may also be other confounding factors that drive that imbalance. Nevertheless, we focus on the fact that the PDI explicitly problematized such disparity and thereby the status quo provision and allocation of stops.
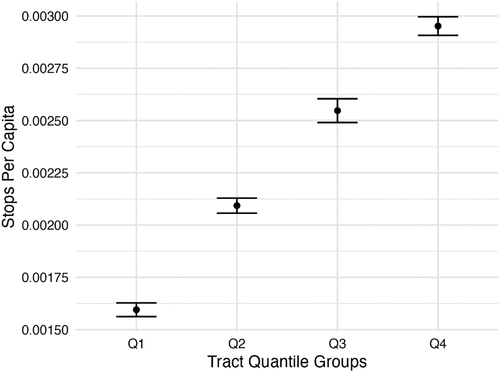
Notes. This figure illustrates the average number of traffic stops per capita in tracts based on the proportion of Black residents. Tracts are divided into four quantile groups, based on the proportion of Black residents.
Difference-in-Differences Estimation of the PDI’s Effects
Parallel Pretrend Assumption.
An important assumption in our difference-in-differences framework is that if the PDI had not taken place, the control and treatment groups would have displayed parallel trends. To assess the plausibility of this assumption, we examine whether the tract-level number of traffic stops per capita exhibits similar trends prior to the PDI between the treatment and control groups. To do so, we estimate an event-study model over the full sample window (six weeks before through 30 weeks after the PDI) by regressing the weekly number of traffic stops per capita on interaction terms between the indicator of the PDI adoption and the week indicators, with tract and week fixed effects and the week immediately prior to the PDI as the reference period. Although one preperiod coefficient is statistically different from zero at the p < 0.05 level (p = 0.041; see Figure 4 for a visualization of this pattern), the Wald test fails to reject the null hypothesis that this set of coefficients are all equal to zero at the p < 0.05 level (F = 2.21). To further probe possible violations of the parallel trends assumption, we conducted a sensitivity test for the parallel trends assumption using the approach suggested by Rambachan and Roth (2023) with relative magnitude bounds (see Figure B1 in Online Appendix B). This sensitivity test, in short, examines the relative degree to which our results may be sensitive to possible violations of the assumption. Our results seem robust to the extent that relative magnitude bounds (i.e., ) are smaller than 0.6.5 Taken together, we interpret these findings as offering reasonable support for the ground that the treatment and control groups did not exhibit different trends in police stop patterns before the PDI.
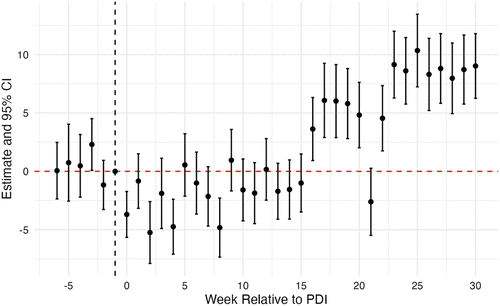
Notes. This figure is based on an event-study model estimation with a set of interaction terms between the treatment indicator and the week indicators, with one week before the Police Data Initiative (PDI) serving as the reference category. The analysis is based on the observations up to six weeks before the PDI and up to 30 weeks after the PDI.
The PDI’s Initial Effects on the Overall Number of Traffic Stops.
After establishing the comparability of the treatment and control groups before the PDI, we now test how officers made traffic stops differently after the PDI. The unit of analysis is the number of stops per capita so that each neighborhood’s population size is taken into account. Table 1 reports these analyses where the treatment effect is estimated at the tract level while accounting for the fixed effects of week and tract. Standard errors are clustered at the tract level. We are interested in the difference-in-differences estimator, which is the interaction between the treatment indicator (i.e., six treated departments vis-à-vis 30 control departments) and the posttreatment period indicator.
|

Table 1. OLS Estimation of the PDI Effect on the Amount of Traffic Stops per 10,000 People
| Outcome | Stops per capita | ||||||
|---|---|---|---|---|---|---|---|
| Pre-period | 6 weeks | ||||||
| Post-period | 6 weeks | 10 weeks | 14 weeks | 18 weeks | 22 weeks | 26 weeks | 30 weeks |
| Model | (1) | (2) | (3) | (4) | (5) | (6) | (7) |
| Treatment × Post | −2.81*** | −2.62*** | −2.36** | −1.17+ | −0.49 | 0.87 | 1.82* |
| (0.78) | (0.75) | (0.72) | (0.70) | (0.73) | (0.75) | (0.75) | |
| Tract FE | Y | Y | Y | Y | Y | Y | Y |
| Week FE | Y | Y | Y | Y | Y | Y | Y |
| Number of observations | 66,976 | 87,584 | 108,192 | 128,800 | 149,408 | 170,016 | 190,624 |
| Number of tracts | 5,151 | 5,151 | 5,151 | 5,151 | 5,151 | 5,151 | 5,151 |
Notes. Clustered robust standard errors are given in parentheses. FE, fixed effects.
****p < 0.1; *p < 0.05; **p < 0.01; ***p < 0.001.
In estimating the effect of the PDI on the overall number of traffic stops per 10,000 people, Model 1 in Table 1, based on the sample between six weeks prior to and six weeks after the PDI, indicates a decrease of about 2.81 stops per 10,000 people after the PDI (p < 0.001). During the same sample period, the average number of stops per capita in the underlying 13-week sample was about 24 stops per 10,000 people, so this corresponds to about an 11.7% reduction (= −2.81/24). To put this effect size in practical terms, consider a hypothetical police department with sample-average characteristics6: 143 tracts, each with a population of about 4,262. The estimated reduction of 2.81 stops per 10,000 people per week translates to about 171 fewer stops per week at the department level (= 2.81 × 4,262/10,000 × 143) under the assumption that traffic stops are evenly spread across tracts during this period. That is, during the first six weeks after PDI adoption, this police department would make 171 fewer traffic stops each week than it would have without the policy. Overall, this finding suggests that the PDI elicited initial compliance.
The PDI’s Over-Time Effects on the Overall Number of Traffic Stops.
However, this decline in the number of stops in the treated departments does not necessarily imply sustained compliance—a critical distinction that may reveal the temporal limits of external accountability. Models 2 and 3 indeed report that extending the postperiod by four and eight weeks (i.e., making the postperiod 10 and 14 weeks), respectively, results in a smaller magnitude of the decline. This suggests the gradual erosion of initial compliance, where analyses with longer postperiods show progressively smaller declines in the overall number of stops per 10,000 people after the PDI. The temporal trajectory becomes more pronounced with longer postperiods after the PDI: the initial compliance eventually becomes statistically insignificant (i.e., Models 4 through 6) and then turns positive and statistically significant with a postperiod of 30 weeks, indicating not merely a return to baseline behavior but a complete reversal. The coefficient in Model 7 indicates that, relative to the control group, the treatment group experienced an increase of about 1.82 stops per 10,000 people after the PDI (p < 0.05). This is about a 7.8% increase compared with the average number of stops per 10,000 (= 1.82/23.4) in the underlying 37-week sample. For a department of average size in our sample (143 tracts with mean population of 4,262), this translates to about 111 additional stops per week at the department level (= 1.82 × 4,262/10,000 × 143), assuming an even spread of traffic stops across tracts during the postimplementation period.
This gradual erosion of initial compliance and the subsequent reversal are visually illustrated in Figure 4. It, in short, shows the trajectory from initial compliance to a reversal: the overall number of stops decreases immediately after the treatment, but the decline becomes less salient over time, eventually reversing direction such that later weeks show relatively more stops in treated departments than in control ones. There is an abrupt jump at around 16 weeks after the treatment, which may potentially raise questions about confounders and/or outliers; therefore, we parse out these results further below in post hoc analyses. Also, the sharp decline observed around 21 weeks after the treatment coincided with Pope Francis’ September 2015 visit to Philadelphia, Pennsylvania, one of the treated departments. This was considered one of the largest events ever hosted in Philadelphia, drawing large crowds and extensive security preparations. In response, city officials instituted widespread road closures and implemented “traffic boxes” throughout the city to limit private vehicle access, resulting in significantly reduced traffic volumes during this period (City of Philadelphia 2015, Terruso 2015). We further probe this week more specifically in post hoc analyses below as well.
Overall, these findings show that the PDI was effective in eliciting decline in the overall number of stops in its initial period but that such effects disappeared over time and even reversed in the longer term. Again, when we consider the aforementioned inferential caveats, these findings may highlight limits to the durability of the PDI’s effects even more, insofar as the self-selection was at least partially driven by the mayor’s or police chief’s confidence that they were already good enough or their anticipation that their police officers would sustainably decrease the overall number of traffic stops after adopting the PDI.
Nevertheless, one possibility is that the initial compliance and subsequent reversal at the aggregate level disguise distributive changes across different neighborhoods. For instance, if the initial compliance (i.e., decline in the overall number of stops) disproportionately occurred in neighborhoods with more Black residents and if the reversal occurred in neighborhoods with fewer Black residents, it may be the case that the PDI arguably still elicited intended changes in the allocation of traffic stops. We therefore turn below to an analysis of the PDI’s heterogeneous effects across different neighborhoods to explore this possibility.
The PDI’s Initial Effects on the Allocation of Traffic Stops.
We now test whether the PDI achieved initial compliance in addressing the PDI’s redistributive objectives across neighborhoods (tracts in our operationalization). If we observe that tracts with a higher proportion of Black residents experienced a greater decline in the number of stops during the initial period, it may suggest that police successfully complied with the PDI’s goal of addressing uneven police intervention distribution based on race. By contrast, if we observe that tracts with a lower proportion of Black residents experienced a greater decrease in stops, such conclusions would be difficult to draw, given the status quo distribution of traffic stops.
Therefore, Table 2 presents analyses where we examine the effect of the PDI on the number of stops per 10,000 across different neighborhoods, based on their proportions of Black residents. In these analyses, we use standardized Black resident ratios by demeaning and normalizing the raw Black ratios within each police department to account for heterogeneity across tracts and cities in racial compositions (see Online Appendix B and Figure B2). Similar to those in Table 1, models presented in Table 2 examine shorter periods compared to longer ones. Models 1 through 3 report a negative and significant triple interaction effect (p < 0.10 and then p < 0.05 as the post-PDI period increases). This implies that during the initial weeks (up to the 14-week posttreatment period) following the implementation of the PDI in the treated police departments, the decrease in traffic stops per 10,000 was more pronounced in tracts with a higher proportion of Black residents.
|
Table 2. OLS Estimation of the PDI Effect on the Allocation of Traffic Stops per 10,000 People
| Outcome | Stops per capita | ||||||
|---|---|---|---|---|---|---|---|
| Pre-period | 6 Weeks | ||||||
| Post-period | 6 weeks | 10 weeks | 14 weeks | 18 weeks | 22 weeks | 26 weeks | 30 weeks |
| Model | (1) | (2) | (3) | (4) | (5) | (6) | (7) |
| Treatment × Post | −2.82*** | −2.64*** | −2.37** | −1.19**** | −0.50 | 0.86 | 1.81* |
| (0.78) | (0.75) | (0.72) | (0.70) | (0.73) | (0.75) | (0.75) | |
| Post × Black Ratio | 0.81** | 0.85** | 0.67* | 0.67* | 0.67* | 0.59**** | 0.56**** |
| (0.29) | (0.29) | (0.26) | (0.28) | (0.29) | (0.30) | (0.30) | |
| Treatment × Post × Black Ratio | −1.17**** | −1.54* | −1.27* | −0.56 | 0.04 | 1.03 | 1.67* |
| (0.66) | (0.64) | (0.61) | (0.62) | (0.67) | (0.71) | (0.75) | |
| Tract FE | Y | Y | Y | Y | Y | Y | Y |
| Week FE | Y | Y | Y | Y | Y | Y | Y |
| Number of observations | 66,976 | 87,584 | 108,192 | 128,800 | 149,408 | 170,016 | 190,624 |
| Number of tracts | 5,151 | 5,151 | 5,151 | 5,151 | 5,151 | 5,151 | 5,151 |
Notes. Clustered robust standard errors are given in parentheses. FE, fixed effects.
****p < 0.1; *p < 0.05; **p < 0.01; ***p < 0.001.
The PDI’s Over-Time Effects on the Allocation of Traffic Stops.
However, this initial distributive compliance exhibits a similar setback over time, as observed in the overall number of stops. The effect gradually diminishes over time and loses statistical significance as we extend the posttreatment period (Models 4 through 6). Eventually, when we examine the posttreatment period of 30 weeks in Model 7, the triple interaction becomes positive and significant at the p < 0.05 level. Along with the positive and significant treatment effect of the PDI, as reported in Table 2, Model 7, this finding suggests that more Black tracts within the treatment group experienced, on average, an even higher number of traffic stops per 10,000 compared with similar tracts in the control group that did not implement the PDI.
Figure 5 illustrates this dynamic reversal of the initial effects. It shows marginal effects in two panels where the dynamic effects across shorter and longer post-PDI periods are visualized based on Model 2 and Model 7 in Table 2, which, respectively, consider the 10-week and 30-week post-PDI periods. In each of these panels, the x-axis shows two standard deviations above and below the mean of standardized Black resident proportion, whereas the black point estimates and error bars represent departments that participated in the PDI, and the gray ones represent those that did not. Here, the estimates are the average marginal effects of the change between the pre- and postindicator. Figure 5(a), which captures the initial period (i.e., 6 weeks before and 10 weeks after the initiative), shows that tracts with a higher percentage of Black residents (“+2SD”) experienced a significant decrease in traffic stops per capita, whereas tracts with a lower percentage of Black residents (“−2SD”) did not show significant changes in either direction. Nevertheless, Figure 5(b), which shows a reversal in a longer term (i.e., six weeks before and 30 weeks after the initiative), shows that tracts with a higher percentage of Black residents had an increase in traffic stops per capita, whereas tracts with a lower percentage of Black residents saw a decline.

Notes. This figure is based on regression estimations as reported in Model 2 and Model 7 in Table 2, which, respectively, consider the 10-week and 30-week post-PDI periods. The x-axis shows two standard deviations above and below the mean of standardized black ratios. The black point estimates and error bars represent departments that participated in the PDI. The gray ones represent those that did not. The estimates show the marginal effect of Black resident ratios on the outcome in the post-PDI period relative to the pre-PDI period, derived from the three-way interaction term.
Our main specification so far pools the entire posttreatment window and estimates an average treatment effect across all post-PDI weeks. This approach, however, faces a problem of dilution: as the window expands, early and late effects are averaged into a single coefficient. To more clearly show the dynamic evolution, we partition the 30-week posttreatment period into several mutually exclusive buckets (e.g., weeks 0–6, 7–12, 13–18, 19–24, and 25–30) and replace the pooled post indicator with bucket-specific dummies, following the approach by Liaukonytė et al. (2023).7Figure 6(a) reports the results of this bucketed estimation. In the first six weeks following the PDI, traffic stops decline by 2.81 per 10,000 residents per week (p < 0.001; same as the postsix estimate from Table 1, Model 1), and this reduction persists through weeks seven to 12 (p < 0.05). The transition occurs in weeks 13–18, where the estimate turns positive and is marginally significant (p < 0.1). By weeks 19–24, stops increase by 4.65 per 10,000 (p < 0.001), and this escalates further to 8.46 in weeks 25–30 (p < 0.001). The three-way interaction in Figure 6(b) also shows a largely similar dynamic trajectory.

Notes. This figure is based on regression estimations of the following “bucketed” equation: where indexes the five posttreatment buckets (e.g., for weeks 0–6 and for weeks 25–30), and the pretreatment period serves as the reference category. Each estimates the average treatment effect within a six-week window. In (a), traffic stops decline (p < 0.001) in the first six weeks following the PDI, and this decline persists through weeks 7–12 (p < 0.05). The transition occurs in weeks 13–18, where the estimate turns positive and is marginally significant (p < 0.1). By weeks 19–24, stops increase (p < 0.001), and this escalates further in weeks 25–30 (p < 0.001). The three-way interaction in (b) also shows a similar trajectory.
These findings reveal that the PDI initially achieved compliance across both dimensions of its accountability framework: reducing the overall stop volumes (as reported in earlier models in Table 1) and generating more equitable distribution by decreasing stops disproportionately more in neighborhoods with higher proportions of Black residents (as reported in earlier models in Table 2). Insofar as part of the PDI’s explicit objectives was to address both, these findings in the initial periods correspond to those objectives. These compliance effects persisted until 14 weeks after the PDI’s adoption and also mitigated the existing disparity in the distribution of traffic stops across neighborhoods with more or less Black residents, as illustrated in Figure 3. However, complete reversals also manifested on both fronts. As a result, initial gains from the PDI were only short-lived. Furthermore, we find evidence for increases in the overall number of stops, especially in neighborhoods with more Black residents. This suggests not merely a return to the preexisting inequities prior to the PDI’s implementation but a reinforcement in both the level and distribution of police interventions.
Accounting for the Status Quo Patterns of Traffic Stops Across Different Police Departments.
These analyses so far show evidence against the premise of sustained compliance. Instead, it seems to have elicited increases in police interventions and reinforced uneven allocation patterns beyond pre-PDI baselines. One possible reason for such reversals may lie in the status quo conditions of those organizations. In particular, departments whose status quo practices were most incompatible with the PDI’s objectives—those with higher baseline stop rates or more uneven distributions—may show more pronounced initial compliance as they first react to external accountability, followed by strong reversions to established patterns given their underlying structural and/or cultural status quo conditions. As a result, compliance may be especially ephemeral in those departments, even if it occurs initially.
Therefore, we here examine whether the dynamic reversal occurs based on the status quo patterns of departments’ traffic stop rates and allocation. In order to examine this possibility, we first take into account the number of traffic stops per capita in 2014—that is, the year before the introduction of the PDI—as the status quo number of traffic stops made by each department. We then categorize departments into two groups: those below and those above the empirical median of traffic stops per capita in 2014 (see Figure B3(a) in Online Appendix B for the distribution of departments in our sample on these dimensions). Then, we rerun the previous analyses for the respective subsamples, where we test whether officers from departments with higher versus lower status quo number of stops exhibit different compliance dynamics.
Panel A of Table 3 presents analyses using departments with more traffic stops than the median (“above-median” sample). With this subsample, we find patterns similar to the dynamic reversal as previously reported for the entire sample: there initially is a significant decline in the number of stops (up to 14 weeks after the PDI, as in Models 1 through 3), followed by a gradual increase as the posttreatment period extends (26 to 30 weeks after the PDI, as in Models 6 and 7).8 The same patterns, however, do not appear in panel B, whose analyses focus on the “below-median” sample. These analyses instead show consistent drops in traffic stops per capita over both short- and long-term periods (from 10 weeks to 26 weeks after the PDI, as shown in Models 2 through 6), although the coefficient becomes not significantly different from zero when the posttreatment period reaches 30 weeks in Model 7.
|
Table 3. OLS Estimation of the PDI Effect on the Amount of Traffic Stops per 10,000 People
| Outcome | Stops per capita | ||||||
|---|---|---|---|---|---|---|---|
| Pre-period | 6 weeks | ||||||
| Post-period | 6 weeks | 10 weeks | 14 weeks | 18 weeks | 22 weeks | 26 weeks | 30 weeks |
| Model | (1) | (2) | (3) | (4) | (5) | (6) | (7) |
| Panel A: Sample of police departments with above median number of stops per capita | |||||||
| Treatment × Post | −4.74*** | −3.57** | −2.78* | −0.79 | 0.34 | 2.44* | 3.95*** |
| (1.23) | (1.18) | (1.13) | (1.11) | (1.15) | (1.17) | (1.19) | |
| Tract FE | Y | Y | Y | Y | Y | Y | Y |
| Week FE | Y | Y | Y | Y | Y | Y | Y |
| Number of observations | 34,788 | 45,492 | 56,196 | 66,900 | 77,604 | 88,308 | 99,012 |
| Number of tracts | 2,676 | 2,676 | 2,676 | 2,676 | 2,676 | 2,676 | 2,676 |
| Panel B: Sample of police departments with below median number of stops per capita | |||||||
| Treatment × Post | −0.71 | −1.98*** | −2.35*** | −2.12*** | −1.66* | −1.24**** | −0.96 |
| (0.58) | (0.57) | (0.56) | (0.59) | (0.65) | (0.68) | (0.65) | |
| Tract FE | Y | Y | Y | Y | Y | Y | Y |
| Week FE | Y | Y | Y | Y | Y | Y | Y |
| Number of observations | 30,992 | 40,528 | 50,064 | 59,600 | 69,136 | 78,672 | 88,208 |
| Number of tracts | 2,383 | 2,383 | 2,383 | 2,383 | 2,383 | 2,383 | 2,383 |
Notes. Clustered robust standard errors are given in parentheses. FE, fixed effects.
****p < 0.1; *p < 0.05; **p < 0.01; ***p < 0.001.
We conduct analogous analyses on whether police departments with greater status quo imbalance in stop allocation exhibit more pronounced reversals. For this, we first compute an “imbalance score”—a Pearson’s correlation coefficient between the percentage of Black residents in tracts and the tract-level number of traffic stops per 10,000 in 2014 for each police department. As the correlation coefficient for a police department increases, it means that in 2014, more traffic stops per 10,000 residents were made in tracts with more Black residents. Thus, a negative coefficient indicates that fewer stops per capita were made in tracts with more Black residents, whereas a positive coefficient indicates the reverse (see Figure B3(b) in Online Appendix B for the distribution of this imbalance score). Perhaps expectedly, based on Figure 3, most departments have positive values for this correlation coefficient. Even when some departments have negative values, their absolute values do not seem large in magnitude, compared with absolute values for departments with positive coefficients.
Based on this imbalance score, we again categorize police departments into two groups based on whether their imbalance score exceeds or falls below the median. Then, we rerun the same analyses conducted in Table 2 for the respective subsamples to examine how officers from departments with more versus less uneven allocation of traffic stops prior to the PDI respond over time. Panel A of Table 4 reports findings from these analyses for the “above-median” sample (i.e., police departments with higher imbalance scores). In this “above-median” subsample, the dynamic reversal is pronounced: the PDI’s treatment effect in eliciting a decline in the number of traffic stops seems to be initially more salient in neighborhoods with more Black residents, as shown in Model 2 (b = −1.71; p < 0.05; in unreported analyses using intermediate post-PDI windows of 4, 8, and 12 weeks, this interaction is significant at p < 0.05 for the eight- and 12-week windows and at p < 0.1 for the four-week window). But this initial compliance disappears and then reverses when longer periods are considered, as shown in Models 6 and 7 (p < 0.05 and p < 0.01, respectively).
|
Table 4. OLS Estimation of the PDI Effect on the Allocation of Traffic Stops per 10,000 People
| Outcome | Stops per capita | ||||||
|---|---|---|---|---|---|---|---|
| Pre-period | 6 weeks | ||||||
| Post-period | 6 weeks | 10 weeks | 14 weeks | 18 weeks | 22 weeks | 26 weeks | 30 weeks |
| Model | (1) | (2) | (3) | (4) | (5) | (6) | (7) |
| Panel A: Sample of police departments with above median correlations between tract black residents and number of traffic stops | |||||||
| Treatment × Post | −3.98*** | −4.20*** | −3.74*** | −1.86* | −0.85 | 1.21 | 2.62** |
| (1.00) | (0.94) | (0.91) | (0.88) | (0.92) | (0.94) | (0.95) | |
| Post × Black Ratio | 0.64**** | 0.59 | 0.37 | 0.10 | −0.03 | −0.17 | −0.20 |
| (0.35) | (0.36) | (0.31) | (0.29) | (0.32) | (0.36) | (0.40) | |
| Treatment × Post × Black Ratio | −1.44**** | −1.71* | −1.30 | −0.00 | 0.98 | 2.36* | 3.22** |
| (0.86) | (0.83) | (0.79) | (0.80) | (0.87) | (0.94) | (1.00) | |
| Tract FE | Y | Y | Y | Y | Y | Y | Y |
| Week FE | Y | Y | Y | Y | Y | Y | Y |
| Number of observations | 31,499 | 41,191 | 50,883 | 60,575 | 70,267 | 79,959 | 89,651 |
| Number of tracts | 2,422 | 2,422 | 2,422 | 2,422 | 2,422 | 2,422 | 2,422 |
| Panel B: Sample of police departments with below median correlations between tract black residents and number of traffic stops | |||||||
| Treatment × Post | −3.14** | −1.46 | −0.62 | −0.30 | 0.08 | −0.09 | −0.40 |
| (1.17) | (1.12) | (1.09) | (1.13) | (1.21) | (1.38) | (1.48) | |
| Post × Black Ratio | 0.94* | 1.06* | 0.92* | 1.14* | 1.24** | 1.22** | 1.19** |
| (0.43) | (0.45) | (0.40) | (0.45) | (0.46) | (0.46) | (0.44) | |
| Treatment × Post × Black Ratio | −0.44 | −0.70 | −0.72 | −0.74 | −0.66 | −0.46 | −0.43 |
| (1.04) | (1.03) | (0.97) | (0.99) | (0.99) | (1.01) | (1.01) | |
| Tract FE | Y | Y | Y | Y | Y | Y | Y |
| Week FE | Y | Y | Y | Y | Y | Y | Y |
| Number of observations | 34,281 | 44,829 | 55,377 | 65,925 | 76,473 | 87,021 | 97,569 |
| Number of tracts | 2,637 | 2,637 | 2,637 | 2,637 | 2,637 | 2,637 | 2,637 |
Notes. Clustered robust standard errors are given in parentheses. FE, fixed effects.
****p < 0.1; *p < 0.05; **p < 0.01; ***p < 0.001.
However, these patterns are largely absent in “below-median” departments, which, by design, have low imbalance scores. Panel B of Table 4 shows these analyses, where we find limited evidence that the PDI’s effects vary by the proportion of Black residents in different neighborhoods, as indicated by the statistically noisy estimates of the three-way interaction coefficients across models in Table 4. In sum, these findings from Tables 3 and 4 suggest that the dynamic reversal of the PDI’s initial effects was only salient in departments whose status quo practices were more in conflict with the PDI’s objectives.
Post Hoc Analyses on the “Jump” in the Overall Number of Stops 16 Weeks After the Treatment
One notable anomaly in our findings, especially evident in Figure 4, is the relatively abrupt increase in the number of stops per capita in the treated departments compared with that in the control departments at around 16 weeks posttreatment. Arguably, the biggest concern is a confounder that might have affected the treated departments, but not the control ones, thereby distorting the PDI’s effects at that time point, although we have no substantive reason to believe that such a confounder took place. Thus, we first turn to the next possibility—that the jump may be driven by some outliers, either in the treated or control group, that disproportionately shaped the treatment effects. To address this possibility, Online Appendix B presents results from a series of analyses where we repeat the main analyses, as presented in Tables 1 and 2, while excluding one of the six treated police departments at a time. The idea here is to assess whether idiosyncratic trends in one of the treated departments drove the abrupt increase and, if so, how its exclusion might shape the overall findings.
These results are presented in Figure B4 and Tables B1 and B2 in Online Appendix B. Although any conclusions from these analyses should be preliminary and tentative, there seems to be little evidence that the overall increase in the number of stops over time is solely attributable to outliers. That is, each figure shows a clear increase in the overall number of stops over time. In finding out sources of the abruptness, the most informative might be the analysis excluding the Camden Police Department (CPD) (Figure B4(c)) or that excluding the Philadelphia Police Department (PPD) (Figure B4(e)). Each shows a clear increase in the overall number of stops over time, but also less abrupt than that shown in Figure 5. This hints that the increase in the overall number of stops over time is likely general and applies to the treatment group as a whole, although the abruptness of the increase may be more attributable to idiosyncratic trends from either or both of these departments.9 These analyses also hint that confounders may not be the culprit behind the abruptness: if there were confounders that affected the treated departments but not the control ones, the abruptness associated with the increase should appear relatively uniformly in this analysis. But it shows that the abruptness is more salient when the PPD (and CPD) is (are) included. Consequently, although this analysis does not completely rule out the possibility of confounders, it suggests that that seems unlikely.
Taken together, these leave-one-out analyses point to a distinction worth drawing between two empirical patterns. The first is the erosion of initial compliance: across all specifications, the initial negative treatment effects attenuate as the posttreatment window extends. The second pattern is the reversal beyond pre-PDI baselines, where the treatment effects eventually turn positive and statistically significant. This pattern is present in the full sample, and its direction is consistent across most specifications, whereas its statistical significance seems to be sensitive to the inclusion of PPD, which, as the largest treated department in our sample, contributes a substantial share of the observations that inform the longer-term estimates. Although not an artifact of any single department, the reversal finding is less precisely estimated when the sample is reduced, as would be expected given the size of our treated group.
Consideration of Different Mechanisms
The findings presented above show that compliance with the PDI was short-lived, with treated departments reverting to and even backsliding on their preintervention levels and patterns of traffic stops. The bases for short-lived compliance outlined earlier—short-lived monitoring and enforcement, superficial compliance, and adherence to the demand from the incumbent audience—may operate as distinct mechanisms behind the three empirical patterns we find: (1) the initial compliance (i.e., decrease in the number of stops, relative to pre-PDI, especially in neighborhoods with more Black residents), followed by (2) a reversion to existing patterns, and (3) the reversal (i.e., increase in the number of stops, relative to pre-PDI, especially in neighborhoods with more Black residents), especially in organizations with more problematic status quo conditions. Thus, we here assess the extent to which each mechanism can plausibly account for the patterns found in our empirical analyses. Table 5 summarizes what aspects of our evidence are consistent with each mechanism, what aspects are harder to reconcile, and what would be needed to adjudicate among them.
|
Table 5. Assessment of Potential Mechanisms Against Empirical Patterns
| Potential mechanism | Empirical patterns | Directions for future research | ||
|---|---|---|---|---|
| Initial compliance to erosion | Reversal beyond baseline | Reversal concentrated in departments with “problematic” status quo | ||
| Short-lived monitoring and enforcement: external scrutiny that induced initial compliance fades over time | Consistent | Difficult to reconcile | Consistent with erosion, not reversal | Direct observation of audience attention over time. Longer observation window to test postreversal stabilization. |
| Superficial initial compliance: initial compliance is perfunctory and not institutionalized | Consistent | Difficult to reconcile | Consistent with erosion, not reversal | Observation on whether departments adopted accompanying structural changes such as new training, revised metrics, and/or community engagement processes. |
| Increasing adherence to the demand from the incumbent audience: attention is shifted from the reform-oriented audience to the incumbent one—the latter of whom wants status quo reinforcement | Consistent | Consistent | Consistent | Direct observation of police attention to heterogeneous stakeholder demands. Observation on audience demand for interventions across neighborhoods. |
Note. These mechanisms are not mutually exclusive and may co-occur.
Short-Lived Monitoring and Enforcement
The external scrutiny that induced initial compliance may not last over time because the audience loses interest and/or prioritizes other concerns and directs resources to those concerns. In our context of policing, social movements, such as Black Lives Matter, may have initially increased awareness of excessive and inappropriate police interventions among the broader public. Yet this scrutiny may have quickly dissipated, possibly because of the perception that the problem was “solved” once the PDI showed early signs of compliance (Loewenstein et al. 2011). This complacency may have been especially quick to arrive in cities and counties where initial compliance was more salient, as in departments whose status quo practices diverged more from the PDI’s demands.
This mechanism, however, faces some limits. In particular, this mechanism cannot as easily explain why the number of stops rose above pre-PDI levels over time, rather than simply returning to the baseline, both overall and in neighborhoods with more Black residents. One possibility within this mechanism’s framework is that police initially reduced stops in response to the external demand, but when they later noticed that external scrutiny was fading, they “overcompensated” by making even more stops than before. Police might have done this to address any problems they believed resulted from their initial reduction in stops and/or to strategically reassert their authority over those areas. This explanation fits with our finding that only the departments that had initially reduced stops later increased the number of stops beyond baseline. If this “overcompensation” dynamic is in place, we would expect the number of stops to eventually level off as departments settle into a new equilibrium. Our empirical tests did not find such an outcome, although that may be because our observational window was too short to capture such longer-term patterns. But future research should be able to more directly probe this mechanism by examining an even longer window.
Superficial Initial Compliance
Complementarily but distinctively, short-lived compliance may reflect the difficulty of changing entrenched organizational routines and procedures. That is, police departments may have initially complied with the demands behind the PDI by simply reacting to the adoption, yet sustained compliance may require more substantial and costly changes. In the policing context, these may include new training programs, revised performance metrics and evaluation systems, and/or community engagement processes—all of which may be stalled by organizational inertia. However, such institutionalization of compliance requires not only political will but also administrative navigation—the latter of which is often logistically challenging also (cf. Harris et al. 2024, Canales et al. 2025). These challenges also seem especially salient in departments whose status quo conditions already reflect greater distance from those demanded outcomes.
Nevertheless, the mechanism based on institutional inertia also faces a major limitation. In short, it cannot easily explain why stops later increased beyond pre-PDI levels. If organizational inertia is the main mechanism, we would expect departments to simply return to their baseline levels of stops, not necessarily to exceed them. Arguably, the findings on the increase in the number of stops, especially in neighborhoods of more Black residents, strain this inertia-based mechanism even more, insofar as inertia is by definition an organizational force that maintains the status quo, resisting changes one way or the other. Nevertheless, it still remains possible that this mechanism occurred concurrently with some mechanism(s) that could also account for the increased number of stops post-PDI.
Increasing Adherence to the Demand from the Incumbent Audience
This mechanism has two premises. First, external audiences are not necessarily monolithic and comprise diverse stakeholders with potentially conflicting preferences. For instance, whereas some audiences (e.g., civil rights groups, reform advocates) may advocate for certain outcomes, other audiences may prefer different outcomes. Second, there is some ambiguity as to which audience exerts the most pressure. In our policing context, this mechanism implies that police departments may have initially responded (temporarily) to the most vocal or politically salient audience who advocated for the PDI but gradually shifted toward serving a more powerful one. That is, social movements such as Black Lives Matter may have initially won enough support to help implement the PDI. Consequently, police departments may have initially paid greater attention to demands from those members of the public. However, support for such demands may have been an exception rather than a lasting rule. Also, there may be ambiguity around which demand truly represents the amorphous “public.” Therefore, external accountability may have been “co-opted” by other members of the public who have more resources to understand disclosed information and enforce their demands on police departments via political, administrative, and other channels. In fact, those members of the public may prefer—or be seen by police as preferring—more police interventions, especially in neighborhoods with more Black residents (Quillian and Pager 2001). This possibility seems further salient for departments whose status quo conditions may have already reflected such preferences and political landscapes.
This mechanism also may provide an explanation for the empirical patterns that posed a challenge to prior mechanisms. In particular, consider how the PDI may (also) serve as a convenient tool for the more powerful audience to exert their power over police. Police may have responded initially to the external demand to lower the number of stops shortly after the PDI, but if departments are strategically catering to powerful audiences who prefer more police interventions, stops may increase beyond baseline levels and remain elevated.
Nevertheless, we do not have direct evidence for this mechanism. For instance, direct observation of police attention and perceptions on what different external stakeholders demand and whose demand they should adhere to would help test this mechanism (cf. Patil 2019). A complementary test could come from what those stakeholders may perceive as the justifiable levels of police intervention in different neighborhoods (cf. Quillian and Pager 2001). Therefore, even though this mechanism on police adaptation to the incumbent audience’s demand is consistent with our findings, we remain cautious in ruling it in as one that definitively drives our observed outcome.
Naturally, these mechanisms are not mutually exclusive. Rather, some complementarity almost seems inevitable. For example, if monitoring and enforcement are short-lived (as in the first mechanism), sustained compliance would depend more heavily on institutionalization, which is itself difficult to achieve (as in the second mechanism). Yet, at the same time, these mechanisms are analytically distinct and may operate independently of one another. Our findings help make progress by identifying not only the presence of reversal of initial compliance but also the organizational conditions under which such reversal occurs. Future research may be better positioned to isolate which mechanism(s) are most responsible for such outcomes.
Last, it is worth returning to an inferential caveat that may account for this short-lived compliance: initial underreporting of stops. However, we see that as an unlikely driver of the observed pattern. The idea here is that police officers underreport stops they make shortly after the PDI adoption, but they overreport them after a while. This seems highly unlikely, given that delayed reporting of stops would create administrative complications. For instance, stopped drivers would receive citations wrongly marked for a day in the future, which becomes a legal liability for both officers and departments. Also, when interviewed, police officers expressed doubts about whether delayed reporting would ever happen. Therefore, although we cannot definitively rule it out, we do not consider this a plausible mechanism.
Discussion
Although external accountability initiatives often capture the public’s imagination for their promise to elicit organizational compliance with the broader, external audience’s demands, the premise of sustained compliance has not been directly tested. In this paper, we use the PDI as a strategic case to attest to both the presence and contingency of its limits. Our examination shows that police departments initially responded to the PDI by decreasing the overall number of stops, especially in neighborhoods of more Black residents. Nevertheless, such effects were relatively ephemeral. In fact, treated police departments even increased the overall number of stops—again more pronounced in those neighborhoods with more Black residents. These dynamic reversals were especially salient in departments whose status quo practices prior to their PDI adoption diverged more from the PDI’s objectives. In sum, these findings clarify whether and when compliance under external accountability would last.
Implications on (External) Organizational Accountability
Our findings call for a reconsideration of a foundational premise underlying the external accountability literature—that once organizations respond to public disclosure and the threat of sanction, compliance will become self-reinforcing or at least sustain. The PDI precisely generated the immediate behavioral shifts that prior work documents (e.g., Chatterji and Toffel 2010, Bennedsen et al. 2022), yet those shifts proved short-lived and, in many departments, ultimately reversed. By documenting this cycle, we show that the presumed durability of externally induced change is precarious.
In relation to the few studies that do track longer-term effects of external accountability initiatives, the most direct comparison is to Lyons and Zhang (2023), whose findings we consider as the most exemplary to the question of durability and who find persistent reductions in gender pay inequality following mandatory salary transparency in Canadian universities. On this divergence, possible reasons may lie in the context. For instance, in their context, HR managers, who may be more susceptible to legal consequences (cf. Dobbin and Sutton 1998), are likely the primary drivers of these actions. By contrast, the actions in our context are taken by police officers who are more insulated from legal consequences, especially given the “qualified immunity” they often enjoy and the PDI’s “soft” enforcement regime. Also, the two contexts likely differ on how accountability pressures apply, as Lyons and Zhang (2023, p. 2031) carefully note: “Given the amplified discourse around gender inequality in recent years, such as in light of the #MeToo social movement, we expect similar types of policy launched today would result in significantly more media scrutiny directed toward more visible organizations, and as such, lead to larger responses, a higher likelihood of ‘over-correction,’ and potential unintended negative consequences down the road.” This comparison is analytically useful because the two settings differ in the stakeholder structure surrounding the focal organizational action. In Lyons and Zhang’s setting, salary transparency appears to have been implemented under relatively limited media and stakeholder scrutiny, which likely exposed university administrators to a more bounded set of external demands. In our setting, by contrast, municipal and county police departments are publicly accountable for frontline policing to multiple audiences whose preferences are salient and often conflicting. Put together, the two studies may collectively identify a boundary condition for durability: external accountability may be more likely to generate sustained compliance when the relevant audiences are relatively coherent, but more likely to erode or reverse when heterogeneous stakeholders create openings for incumbent audiences to recapture the initiative and steer the organization back toward the status quo—a dynamic consistent with the incumbent audience mechanism in Table 5.
Relatedly, it is worth noting potential idiosyncrasies of our empirical context that may have affected our findings. Policing in the United States has long been a central topic of discussions of government overreach and racial bias and disparities (Bittner 1967, Harris 2010, Drakulich 2013, Epp et al. 2014, Legewie 2016, Bell 2017, Fagan 2022). For this reason, it may have generated disproportionate attention and thereby political will (e.g., in forms of social movement activism such as Black Lives Matter) in the wake of events such as the killing of Michael Brown in August 2014. Yet, arguably, this attention quickly dissipated before the more widespread resurgence after the murder of George Floyd in 2020. The ebb and flow are perhaps an inevitable feature of any social movement activism that partly relies on emotional response to critical events (Jasper 2011, DeCelles et al. 2020). But they also imply limits to external accountability initiatives that, by design, rely on sustained attention and political will from external audiences to effect lasting organizational compliance (Lee et al. 2026; cf. Marx et al. 2026). In this way, our context may be a unique context where the ebb and flow are especially salient.
A more practical implication may also lie in the pronounced heterogeneity we observe between different police departments. Departments whose baseline practices diverged from the PDI’s objectives the most exhibited the strongest initial compliance and the steepest reversal. This pattern suggests that external accountability may interact with embedded routines in dynamic ways. For instance, the greater the initial distance between organizational practice and external expectations, the more likely early gains may be to erode without accompanying structural changes. External accountability initiatives, therefore, may require targeted and continuous attention from the audience that called for those initiatives, to prevent organizations with entrenched practices from reverting to the status quo.
In interpreting our findings this way, it is important to situate them in the treated departments’ self-selection into the PDI and the resulting endogeneity concern. As noted above, one reasonable interpretation is that our estimates primarily reflect how the PDI unfolded in “more willing” departments—that is, those whose leadership voluntarily opted into disclosure and the PDI’s (largely soft) accountability pressures. Yet this framing does not fully resolve selection into treatment. That is, even with treated and control departments appearing comparable on observables (Online Appendix A), the estimated differences may still be confounded by preexisting (and potentially unobserved) factors that shaped both PDI adoption and traffic stop dynamics. In other words, our design cannot definitively rule out that some of the observed trajectory reflects underlying differences that also made adoption more likely. In particular, the dynamic cycle we documented could reflect the influence of local pressures that might have prompted adoption in the first place, rather than the limitation of the PDI alone.
This concern, in turn, highlights two issues that future research may productively investigate. First, insofar as some organizations are more likely than others to adopt external accountability initiatives, the distinction between adopters and nonadopters may itself be theoretically and practically informative. This thereby invites research on the motives and constraints of organizational decision makers (e.g., mayors and police chiefs, in the case of the PDI) who choose to adopt such initiatives, as well as on which organizations are most likely to serve as initial gateways through which external audiences can begin to hold other organizations accountable.
Second, if the adoption of external accountability initiatives is driven by confounders and/or is endogenous to the outcomes we study here, the compliance dynamics we document may manifest differently among organizations that would not have voluntarily adopted the PDI but are hypothetically mandated to do so. On the one hand, if those organizations are less receptive to external accountability and/or have more entrenched status quo practices, mandated adoption could yield weaker initial compliance and/or sharper and more rapid backsliding. This would be a less favorable outcome from a reform perspective and would reinforce the core caution in our findings about durability. On the other hand, mandatory regimes may also entail more uniform implementation, stronger and more sustained monitoring, and clearer sanctioning authority. These features could make compliance more durable even among initially reluctant organizations, which underscores that durability may hinge on institutional design and enforcement capacity.
Such mandatory adoptions may also affect which of the three levers outlined in our theoretical framework dominates. Formal oversight that persists regardless of public attention could sustain monitoring and enforcement far beyond what the PDI appears to have achieved. Mandatory procedural changes could facilitate compliance to become routinized. Mandates by a higher authority could reduce the leverage of incumbent local audiences whose demands conflict with the initiative’s goals. Yet these same structural features could also intensify the resistance noted above if organizations perceive mandated accountability as externally imposed rather than internally legitimate. We therefore avoid treating our results as a universal effect of the PDI and instead present them as the first glimpse into how compliance under an external accountability initiative may unravel over time—“even” in departments that self-select into being held accountable.
Lastly, we highlight aforementioned inferential caveats. Our design includes only six treated departments, which constrains both the precision of statistical inference and the feasibility to cluster standard errors at the department level. Whereas our tract-level clustering does account for within-tract serial correlation and is directly appropriate for our allocation analysis where treatment effects vary across neighborhoods (Abadie et al. 2023), we note that such tract-level clustering may not fully capture the correlation across tracts within the same department. We see it as a limitation to our study that there is only a small number of treated departments, which thereby constrains our inferential precision.
Implications on Organizational Change
More broadly, our findings also speak to long-standing debates about how momentary shocks translate (or fail to translate) into enduring organizational change. Staudenmayer et al. (2002) argue that temporal “breaks” in routine activity create windows in which organizations can notice mismatches, experiment, and ultimately alter entrenched practices (cf. Stouten et al. 2018). The PDI indeed represents such a break: the sudden disclosure mandate prompted an immediate recalibration of traffic stop–making behaviors, and it actually did elicit significant changes. Yet the reversal we observe underscores that such a temporal window alone may be insufficient. Without complementary mechanisms that embed new practices into ongoing routines, organizations may simply snap back once the window closes. Our study thus highlights the conditional nature of shock-based change in organizations. Instead, more permanent change may depend on postbreak reinforcement.
In parallel, our results on heterogeneity in PDI’s initial and long-term effects inform our understanding of how status quo conditions may shape the durability of initial change. Police departments most misaligned with the PDI’s goals displayed the most salient initial compliance but also the most salient reversal, hinting that deeper structural misfits as well as greater external accountability may magnify both responsiveness and resistance. This pattern invites consideration of complementarity when organizational changes occur. For instance, status quo conditions may not merely be an opposing force to change but an elastic property that can absorb and then reassert itself after external pressure subsides. Future models of change should therefore incorporate path-dependent resistance that escalates with the degree of initial adaptation required.
Finally, the compliance-to-reversal cycle we document further raises the need to reframe organizational change as a dynamic, multistage process. Scholars often assess organizational change through observation at one time point, but our results caution that such an approach may conflate ephemeral adjustment with more sustained reform. This reinforces the notion of institutionalization and temporal sequencing as suggested by Staudenmayer et al. (2002) and Sauder and Espeland (2009), respectively, whereby initiatives for change must first breach routine and also become perceived, practiced, and reinforced as legitimate via institutionalization. External accountability initiatives such as the PDI may have cleared the first hurdle but not the second one.
Conclusion
We leverage the PDI as an opportunity to observe long-term as well as immediate effects of external accountability and show that the arc from compliance to durable change is neither linear nor guaranteed. By showing how early gains can erode and even invert within months, especially in departments whose prior routines most conflicted with external demands, we provide a source of caution to optimistic accounts of external accountability. Our findings therefore underscore the necessity of theorizing and measuring change as a longitudinal and evolving process. For practitioners and policymakers, we caution that well-intended external accountability initiatives must be paired with sustained enforcement if they are to generate reforms that outlast the initial attention.
Tae-Ung Choi and Minjae Kim contributed equally and are listed in alphabetical order. The authors appreciate the constructive engagement of the three anonymous reviewers and Associate Editor Amandine Ody-Brasier. The authors also thank audience members at presentations at Dartmouth College, Massachusetts Institute of Technology, Northwestern University, Rice University, Sungkyunkwan University, the Hong Kong University of Science and Technology, Yonsei University, the American Sociological Association Annual Meeting, the Academy of Management Annual Meeting, the Cornell ASQ Writing Workshop, the Hong Kong Strategy Symposium, and the Junior OT Conference. The authors also benefited from feedback on earlier versions of the paper from Emilio Castilla, Hang-Jun Cho, Laura Doering, Jeremy Fiel, Kylie Jiwon Hwang, Arvind Karunakaran, Bo Kyung Kim, John Cheonmok Kim, Brayden King, Adam Kleinbaum, Jiao Luo, Elizabeth Lyons, Andrew Papachristos, Lincoln Quillian, Hatim Rahman, Michael Sauder, Amanda Sharkey, Pavel Zhelyazkov, and Ezra Zuckerman Sivan. Finally, special thanks go to Minkyung Kim, without whom this paper could not have begun. All errors are the authors’ own.
1 The data do not contain information on with whom officers were patrolling while making traffic stops. The possibility that colleagues, including paired partners, may influence how officers make traffic stops (Ouellet et al. 2019; cf. Meuris 2023) is therefore not addressed and is a limitation of the study, although analyses not controlling for such influence should only be noisier and thereby more conservative, arguably. Interviews with rank-and-file officers suggest that officers record stops that they initiate as their own.
3 One of the authors conducted interviews with 10 officers of different ranks at the Seattle Police Department in 2019 in order to establish contextual validity of this and other assumptions (e.g., when officers were told of their department’s PDI adoption). Interviewees were contacted via the author’s personal connections and cold emails via LinkedIn.
4 To be sure, Census tract is an imperfect measure of “actual” neighborhoods. For instance, one way to define neighborhoods is by dividing a city along the borders used by citizens in the city. Another is to define neighborhoods by beats (i.e., geographical units used by police). But, to our knowledge, no high-quality data are available for neighborhood characteristics when neighborhoods are defined as such. The mismatch is not desirable, but it also should provide noisier estimates, where effects should be harder to detect.
5 As suggested by Rambachan and Roth (2023), relative magnitude bounds are used to relax the parallel trends assumption by setting limits on how much the trends can diverge after the treatment (i.e., ). When = 0.5, posttreatment deviations can be as large as half of the biggest pretreatment deviation observed. That our results remain significant at = 0.5 suggests that our results are robust to violations of the parallel trends assumption if posttreatment trend deviations are no larger than half of the largest observed difference in trends between treated and control groups in the pretreatment periods.
6 On average, local police departments in our analysis have 143 tracts, with an average tract population of 4,262. For the treated police departments, they cover, on average, 151 tracts. For the control police departments, they cover, on average, 141 tracts.
7 This bucketed approach offers several strengths. By aggregating six weeks per bucket rather than estimating week by week, it reduces noise relative to the event study while preserving the temporal trajectory that the single postdummy specification obscures. Also, because all bucket interactions enter a single regression, the estimates are jointly identified within one model. This contrasts with the approach in Table 1, where we estimate the model multiple times over different postperiod lengths and report a coefficient that averages over early and late effects.
8 Results are substantively similar when we exclude Camden PD (NJ) alone or both Camden PD (NJ) and Nashville PD (TN) from the sample, which appear to be outliers for the number of stops per capita (see Figure B3(a) in the online appendix).
9 Raw trends in the overall number of traffic stops for each department, which expectedly reflect a wide range of idiosyncrasies, are reported in Figure B6 in Online Appendix B.
References
- (2023) When should you adjust standard errors for clustering? Quart. J. Econom. 138(1):1–35.Crossref, Google Scholar
- (2025) Gentrification and racial distrust in communities: Evidence from 911 calls. Management Sci. 71(1):708–730.Abstract, Google Scholar
- (2018) A self-fulfilling cycle of coercive surveillance: Workers’ invisibility practices and managerial justification. Organ. Sci. 29(2):247–263.Link, Google Scholar
- (2016a) Report: Increases in police use of force in the presence of body-worn cameras are driven by officer discretion: A protocol-based subgroup analysis of ten randomized experiments. J. Experiment. Criminology 12(3):453–463.Crossref, Google Scholar
- (2016b) Wearing body cameras increases assaults against officers and does not reduce police use of force: Results from a global multi-site experiment. Eur. J. Criminology 13(6):744–755.Crossref, Google Scholar
- (2016c) Contagious accountability. Criminal Justice Behav. 44(2):293–316.Crossref, Google Scholar
- (2017) Police reform and the dismantling of legal estrangement. Yale Law J. 126(7):2054–2150.Google Scholar
- (2022) Do firms respond to gender pay gap transparency? J. Finance 77(4):2051–2091.Crossref, Google Scholar
- (2004) How much should we trust differences-in-differences estimates? Quart. J. Econom. 119(1):249–275.Crossref, Google Scholar
- (1967) The police on skid-row: A study of peace keeping. Amer. Sociol. Rev. 32(5):699–715.Crossref, Google Scholar
- (2019) Race, place, and effective policing. Annual Rev. Sociol. 45(1):535–555.Crossref, Google Scholar
- (2012) From smoke and mirrors to walking the talk: Decoupling in the contemporary world. Acad. Management Ann. 6(1):483–530.Crossref, Google Scholar
- (2024) Does the squeaky wheel get more grease? The direct and indirect effects of citizen participation on environmental governance in China. Amer. Econom. Rev. 114(3):815–850.Crossref, Google Scholar
- (2015) A practitioner’s guide to cluster-robust inference. J. Human Resources 50(2):317–372.Crossref, Google Scholar
- (2025) Shaping police officer mindsets and behaviors: Experimental evidence of procedural justice training. Management Sci. 71(11):8995–9013.Link, Google Scholar
- (2015) Open data, the criminal justice system, and the police data initiative. Data Civil Rights: New Era Policing Justice (Data & Society Research Institute, New York).Google Scholar
- (2010) How firms respond to being rated. Strategic Management J. 31(9):917–945.Crossref, Google Scholar
- (2022a) Social capital I: Measurement and associations with economic mobility. Nature 608(7921):108–121.Crossref, Google Scholar
- (2022b) Social capital II: Determinants of economic connectedness. Nature 608(7921):122–134.Crossref, Google Scholar
City of Philadelphia (2015) City releases collective, comprehensive details for WMoF, papal visit. Retrieved October 30, https://web.archive.org/web/20200510021405/https://www.phila.gov/news/oem/city-releases-collective-comprehensive-details-for-wmof-papal-visit/.Google Scholar- (2011) Inference with “difference in differences” with a small number of policy changes. Rev. Econom. Statist. 93(1):113–125.Crossref, Google Scholar
- (1998) The calculated and the avowed: Techniques of discipline and struggles over identity in big six public accounting firms. Admin. Sci. Quart. 43(2):293–327.Crossref, Google Scholar
- (2020) Examining anger’s immobilizing effect on institutional insiders’ action intentions in social movements. Admin. Sci. Quart. 65(4):847–886.Crossref, Google Scholar
- (2008) Organizational responses to environmental demands: Opening the black box. Strategic Management J. 29(10):1027–1055.Crossref, Google Scholar
- (1998) The strength of a weak state: The rights revolution and the rise of human resources management divisions. Amer. J. Sociol. 104(2):441–476.Crossref, Google Scholar
- (2007) Inference with difference-in-differences and other panel data. Rev. Econom. Statist. 89(2):221–233.Crossref, Google Scholar
- (2013) How firms respond to mandatory information disclosure. Strategic Management J. 34(10):1209–1231.Crossref, Google Scholar
- (2013) Perceptions of the local danger posed by crime: Race, disorder, informal control, and the police. Soc. Sci. Res. 42(3):611–632.Crossref, Google Scholar
- (2013) The role of perceptions of the police in informal social control: Implications for the racial stratification of crime and control. Soc. Problems 60(3):383–407.Crossref, Google Scholar
- (1999) The endogeneity of legal regulation: Grievance procedures as rational myth. Amer. J. Sociol. 105(2):406–454.Crossref, Google Scholar
- (2016) Through the mud or in the boardroom: Examining activist types and their strategies in targeting firms for social change. Strategic Management J. 37(12):2425–2440.Crossref, Google Scholar
- (2023) Using multiple pretreatment periods to improve difference-in-differences and staggered adoption designs. Political Anal. 31(2):195–212.Crossref, Google Scholar
- (2022) Racial demographics explain the link between racial disparities in traffic stops and county-level racial attitudes. Psych. Sci. 33(4):497–509.Crossref, Google Scholar
- (2014) Pulled Over: How Police Stops Define Race and Citizenship (University of Chicago Press, Chicago).Crossref, Google Scholar
- (2007) Rankings and reactivity: How public measures recreate social worlds. Amer. J. Sociol. 113(1):1–40.Crossref, Google Scholar
- (2016) Engines of Anxiety: Academic Rankings, Reputation, and Accountability (Russell Sage Foundation, New York).Google Scholar
- (2019) Reluctant disclosure and transparency: Evidence from environmental disclosures. Organ. Sci. 30(6):1207–1231.Link, Google Scholar
- (2022) No runs, few hits and many errors: Street stops, bias and proactive policing. UCLA Law Rev. 68:1584–1676.Google Scholar
- (2003) Reconceptualizing organizational routines as a source of flexibility and change. Admin. Sci. Quart. 48(1):94–118.Crossref, Google Scholar
- (2022) Activist protest spillovers into the regulatory domain: theory and evidence from the U.S. nuclear power generation industry. Organ. Sci. 33(3):1163–1187.Link, Google Scholar
- (2019) An empirical analysis of racial differences in police use of force. J. Political Econom. 127(3):1210–1261.Crossref, Google Scholar
- (1999) Taking Coase seriously. Admin. Sci. Quart. 44(1):145–157.Crossref, Google Scholar
Google (2012) Google diversity annual report 2022. Report, Google, Mountain View, CA.Google Scholar- (2012) Echoes of the past: Organizational foundings as sources of an institutional legacy of mutualism. Amer. J. Sociol. 118(3):635–675.Crossref, Google Scholar
- (2006) Testing for racial profiling in traffic stops from behind a veil of darkness. J. Amer. Statist. Assoc. 101(475):878–887.Crossref, Google Scholar
- (2023) Inflammatory political campaigns and racial bias in policing. Quart. J. Econom. 138(1):413–463.Crossref, Google Scholar
- (2010) The myth incarnate: recoupling processes, turmoil, and inhabited institutions in an urban elementary school. Amer. Sociol. Rev. 75(1):52–74.Crossref, Google Scholar
- (1984) Structural inertia and organizational change. Amer. Sociol. Rev. 49(2):149–164.Crossref, Google Scholar
- (2010)
The stories, the statistics, and the law why “driving while Black” matters . Rice SK, White MD, eds. Race, Ethnicity, and Policing (New York University Press, New York), 36–83.Google Scholar - (2024) Proud to belong: The impact of ethics training on police officers in Ghana. IZA Discussion Paper No. 17006, Institute of Labor Economics, Bonn, Germany.Google Scholar
- (2007) Variation in police patrol practices: The precinct as a sub‐organizational level of analysis. Policing 30(2):257–276.Crossref, Google Scholar
- (2007) Block, tract, and levels of aggregation: Neighborhood structure and crime and disorder as a case in point. Amer. Sociol. Rev. 72(5):659–680.Crossref, Google Scholar
- (2001) Not all events are attended equally: Toward a middle-range theory of industry attention to external events. Organ. Sci. 12(4):414–434.Link, Google Scholar
- (1979) Moral hazard and observability. Bell J. Econom. 10(1):74–91.Crossref, Google Scholar
- (2011) Emotions and social movements: Twenty years of theory and research. Annual Rev. Sociol. 37(1):285–303.Crossref, Google Scholar
- (2014) Talk is cheap. Sociol. Methods Res. 43(2):178–209.Crossref, Google Scholar
- (2024) Corporate social responsibility at the margins: Firms’ responses to marginal inclusion on the Vault Law 100 ranking. Strategic Management J. 45(12):2548–2576.Crossref, Google Scholar
- (2024) Frontline professionals in the wake of social media scrutiny: Examining the processes of obscured accountability. Admin. Sci. Quart. 69(3):747–790.Crossref, Google Scholar
- (2011) Strategic environmental disclosure: Evidence from the DOE’s voluntary greenhouse gas registry. J. Environ. Econom. Management 61(3):311–326.Crossref, Google Scholar
- (2015) Greenwash vs. brownwash: Exaggeration and undue modesty in corporate sustainability disclosure. Organ. Sci. 26(3):705–723.Link, Google Scholar
- (2010) The contentiousness of markets: Politics, social movements, and institutional change in markets. Annual Rev. Sociol. 36(1):249–267.Crossref, Google Scholar
- (2007) Social movements as extra-institutional entrepreneurs: The effect of protests on stock price returns. Admin. Sci. Quart. 52(3):413–442.Crossref, Google Scholar
- (2011) Cultural mechanisms and the persistence of neighborhood violence. Amer. J. Sociol. 116(4):1190–1233.Crossref, Google Scholar
- (2025) Robbing Peter to pay Paul: The impact of California’s cap-and-trade program on toxic emissions. Management Sci. 71(6):5409–5418.Link, Google Scholar
- (2026) When the headlines fade, the story goes on: Investigating how local newspaper decline affects firm CSR engagement. Organ. Sci., ePub ahead of print March 20, https://doi.org/10.1287/orsc.2024.18968.Link, Google Scholar
- (2016) Racial profiling and use of force in police stops: How local events trigger periods of increased discrimination. Amer. J. Sociol. 122(2):379–424.Crossref, Google Scholar
- (1999) Accounting for the effects of accountability. Psych. Bull. 125(2):255–275.Crossref, Google Scholar
- (2022) Avoiding the appearance of virtue: Reactivity to corporate social responsibility ratings in an era of shareholder primacy. Admin. Sci. Quart. 67(4):1093–1135.Crossref, Google Scholar
- (2023) Frontiers: Spilling the beans on political consumerism: Do social media boycotts and buycotts translate to real sales impact? Marketing Sci. 42(1):11–25.Link, Google Scholar
- (2022) Low-wage workers and the enforceability of noncompete agreements. Management Sci. 68(1):143–170.Link, Google Scholar
- (1980) Street-Level Bureaucracy: Dilemmas of the Individual in Public Service (Russell Sage Foundation, New York).Google Scholar
- (2011) The limits of transparency: Pitfalls and potential of disclosing conflicts of interest. Amer. Econom. Rev. 101(3):423–428.Crossref, Google Scholar
- (2015) Environmental disclosure: Evidence From Newsweek’s green companies rankings. Bus. Soc. 54(5):632–675.Crossref, Google Scholar
- (2023) Salary transparency and gender pay inequality: Evidence from Canadian universities. Strategic Management J. 44(8):2005–2034.Crossref, Google Scholar
- (2017) Wild bootstrap inference for wildly different cluster sizes. J. Appl. Econometrics 32(2):233–254.Crossref, Google Scholar
- (2020) Randomization inference for difference-in-differences with few treated clusters. J. Econom. 218(2):435–450.Crossref, Google Scholar
- (2020) IPUMS national historical geographic information system: Version 15.0. Accessed April 1, 2024, https://www.ipums.org/projects/ipums-nhgis/d050.v15.0.Google Scholar
- (2011)
Introduction: Community as an institutional order and a type of organizing . Marquis C, Lounsbury M, Greenwood R, eds. Communities and Organizations, vol. 33 (Emerald Group Publishing, Leeds, UK).Crossref, Google Scholar - (2016) Scrutiny, norms, and selective disclosure: A global study of greenwashing. Organ. Sci. 27(2):483–504.Link, Google Scholar
- (2026) Minimum viable signal: Venture funding, social movements, and race. Management Sci. 72(4):3332–3350.Link, Google Scholar
- (2015) A dynamic process model of private politics activist targeting and corporate receptivity to social challenges. Amer. Sociol. Rev. 80(3):654–678.Crossref, Google Scholar
- (2023) Can racial diversity attenuate racial discrimination in service interactions? Evidence from cite-and-release decisions within police departments. Organ. Sci. 34(1):197–222.Link, Google Scholar
- (1985) An Evolutionary Theory of Economic Change (Harvard University Press, Cambridge, MA).Google Scholar
- (2022) The influence of pay transparency on (gender) inequity, inequality and the performance basis of pay. Nature Hum. Behav. 6(5):646–655.Crossref, Google Scholar
- (2019) Under pressure: Reputation, ratings, and inaccurate self‐reporting in the nursing home industry. Strategic Management J. 40(10):1517–1544.Crossref, Google Scholar
- (1991) Strategic responses to institutional processes. Acad. Management Rev. 16(1):145–179.Crossref, Google Scholar
- (2022) Black protests in the United States, 1994 to 2010. Sociol. Sci. 9(12):275–312.Crossref, Google Scholar
- (2021) Does protest against police violence matter? Evidence from U.S. cities, 1990 through 2019. Amer. Sociol. Rev. 86(6):1066–1099.Crossref, Google Scholar
- (2019) Network exposure and excessive use of force: Investigating the social transmission of police misconduct. Criminology Public Policy 18(3):675–704.Crossref, Google Scholar
- (2022) Toward a public administration theory of felt accountability. Public Admin. Rev. 82(1):12–22.Crossref, Google Scholar
- (2021) A validated measurement for felt relational accountability in the public sector: Gauging the account holder’s legitimacy and expertise. Public Management Rev. 23(12):1748–1767.Crossref, Google Scholar
- (2010) When worlds collide: The internal dynamics of organizational responses to conflicting institutional demands. Acad. Management Rev. 35(3):455–476.Crossref, Google Scholar
- (2004) A contextual study of racial profiling: Assessing the theoretical rationale for the study of racial profiling at the local level. Amer. Behav. Sci. 47(7):943–962.Crossref, Google Scholar
- (2019) “The public doesn’t understand”: The self-reinforcing interplay of image discrepancies and political ideologies in law enforcement. Admin. Sci. Quart. 64(3):737–769.Crossref, Google Scholar
- (2021) “We’re still dying quicker than we can effect change”: #BlackLivesMatter and the limits of 21st-century policing reform. Amer. J. Sociol. 127(3):867–903.Crossref, Google Scholar
- (2022) The American racial divide in fear of the police. Criminology 60(2):291–320.Crossref, Google Scholar
- (2020) A large-scale analysis of racial disparities in police stops across the United States. Nature Human Behav. 4(7):736–745.Crossref, Google Scholar
- (2023) De-policing, police stops, and crime. Policing 17:paac070.Crossref, Google Scholar
President’s Task Force on 21st Century Policing (2015) Final report of the President’s Task Force on 21st Century Policing. Report, President’s Task Force on 21st Century Policing, Washington, DC.Google Scholar- (2001) Black neighbors, higher crime? The role of racial stereotypes in evaluations of neighborhood crime. Amer. J. Sociol. 107(3):717–767.Crossref, Google Scholar
- (2023) A more credible approach to parallel trends. Rev. Econom. Stud. 90(5):2555–2591.Crossref, Google Scholar
- (2009) Responding to public and private politics: Corporate disclosure of climate change strategies. Strategic Management J. 30(11):1157–1178.Crossref, Google Scholar
- (1987) Urban Black violence: The effect of male joblessness and family disruption. Amer. J. Sociol. 93(2):348–382.Crossref, Google Scholar
- (1999) Systematic social observation of public spaces: A new look at disorder in urban neighborhoods. Amer. J. Sociol. 105(3):603–651.Crossref, Google Scholar
- (2009) The discipline of rankings: Tight coupling and organizational change. Amer. Sociol. Rev. 74(1):63–82.Crossref, Google Scholar
- (2023) From compliance to progress: A sensemaking perspective on the governance of corruption. Organ. Sci. 34(3):1184–1215.Link, Google Scholar
- (2019) Qualified immunity’s selection effects. Northwestern Univ. Law Rev. 114(5):1101.Google Scholar
- (2015) Can ratings have indirect effects? Evidence from the organizational response to peers’ environmental ratings. Amer. Sociol. Rev. 80(1):63–91.Crossref, Google Scholar
- (2014) Where, when, why, and for whom do residential contexts matter? Moving away from the dichotomous understanding of neighborhood effects. Annual Rev. Sociol. 40(1):559–579.Crossref, Google Scholar
- (2022) The impact of mandated pay gap transparency on firms’ reputations as employers. Admin. Sci. Quart. 67(4):1136–1179.Crossref, Google Scholar
- (2021) Do female officers police differently? Evidence from traffic stops. Amer. J. Political Sci. 65(3):755–769.Crossref, Google Scholar
- (2012) The Signal and the Noise: Why So Many Predictions Fail-But Some Don’t (Penguin, New York.Google Scholar
- (1986) The neighborhood context of police behavior. Crime Justice 8:313–341.Crossref, Google Scholar
- (2017) Police are our government: Politics, political science, and the policing of race–class subjugated communities. Annual Rev. Political Sci. 20(1):565–591.Crossref, Google Scholar
- (2002) Time to change: Temporal shifts as enablers of organizational change. Organ. Sci. 13(5):583–597.Link, Google Scholar
- (2018) Successful organizational change: Integrating the management practice and scholarly literatures. Acad. Management Ann. 12(2):752–788.Crossref, Google Scholar
- (2021) Discretion in traffic stops: The influence of budget cuts on traffic citations. Public Admin. Rev. 81(3):446–458.Crossref, Google Scholar
- (1996) The two faces of governance: responses to legal uncertainty in U.S. firms, 1955 to 1985. Amer. Sociol. Rev. 61(5):794–811.Crossref, Google Scholar
- (2003) Neighborhood context and police use of force. J. Res. Crime Delinquency 40(3):291–321.Crossref, Google Scholar
- (2015) City: New road closings, fencing for pope visit; help for businesses. Philadelphia Inquirer (August 13) https://web.archive.org/web/20210305195126/https://www.inquirer.com/philly/news/pope/20150814_City__New_road_closing_and_fencing_for_pope_visit__help_for_businesses.html.Google Scholar
The White House (2014) Fact sheet: Task Force on 21st Century Policing. Accessed April 1, 2024, https://obamawhitehouse.archives.gov/the-press-office/2014/12/18/fact-sheet-task-force-21st-century-policing.Google ScholarThe White House (2015) Fact sheet: Creating opportunity for all through stronger, safer communities. https://obamawhitehouse.archives.gov/the-press-office/2015/05/18/fact-sheet-creating-opportunity-all-through-stronger-safer-communities.Google ScholarThe White House (2016) Fact sheet: White House Police Data Initiative highlights new commitments. https://obamawhitehouse.archives.gov/the-press-office/2016/04/22/fact-sheet-white-house-police-data-initiative-highlights-new-commitments.Google Scholar- (2006) Race and Policing in America: Conflict and Reform (Cambridge University Press, New York).Crossref, Google Scholar
- (1998) The symbolic management of stockholders: Corporate governance reforms and shareholder reactions. Admin. Sci. Quart. 43(1):127–153.Crossref, Google Scholar
Tae-Ung Choi is an assistant professor at Yonsei University. His research explores how organizations navigate social and environmental concerns amid competing demands and how stakeholders shape organizational responses. His PhD is in management and organizations from Northwestern University.
Minjae Kim is an assistant professor of organizational behavior at Yale University School of Management. His research addresses when, how, and why social actors coordinate their actions and their microlevel coordination leads to various macrolevel consequences in domains such as politics, entrepreneurship, cultural markets, and organizations.