


The Paradox of Inventors’ Job Security
Abstract
This paper investigates how job security affects the types of innovations generated by corporate inventors. By increasing inventors’ prospects of remaining with their current employer, job security strengthens their incentives to invest in firm-specific technological knowledge. Thus, whereas employment protection provides inventors with a safety net to fail that could facilitate exploration, it instead drives them to produce innovations that draw more heavily on internal technologies and are less novel. We test this argument using matched employer–employee data constructed from patent records. To examine inventor-level responses to increased job security, we exploit the staggered adoption of wrongful discharge laws across U.S. states between 1980 and 1999. Using cross-state variation over time in a difference-in-differences framework, we find that increased job security leads inventors to produce innovations that rely more intensely on their firms’ technologies, are less novel, and generate higher private value to their employers.
Funding: This work was supported by Grants PID2021-126435NB-C21 and PID2021-126153NB-I00, both funded by the Spanish Ministry of Science and Innovation (MCIN) / State Research Agency (AEI) / 10.13039/501100011033 and by the European Regional Development Fund (ERDF) “A Way of Making Europe,” and by Grant PID2024-155952NB-I00, funded by the Spanish Ministry of Science, Innovation and Universities (MICIU) / AEI / 10.13039/501100011033 and by the ERDF / European Union (EU)”.
Supplemental Material: The online appendix is available at https://doi.org/10.1287/orsc.2025.21133.
1. Introduction
Technological innovation is a prototypical human capital–intensive activity that is primarily conducted within firms today. Research suggests that inventors’ human capital plays a central role in explaining variation in innovation productivity across organizations (Bhaskarabhatla et al. 2021). This places inventors and their behavior at the center of the innovation process in research and development (R&D)–intensive firms. Hence, understanding the motivations shaping R&D workers’ actions is crucial for innovative organizations. Because innovation often involves experimentation, designing incentives that effectively foster innovation is particularly challenging. Given the uncertain and long-term nature of innovation, job security is widely regarded as a key factor influencing individuals’ incentives to innovate.
Several streams of research examine the relationship between job security and innovation. They mainly focus on the context of the broader workforce—workers, managers, or entrepreneurs—who may incorporate innovation into their routine activities or reallocate effort from those activities toward innovative pursuits. Drawing on psychological research, Amabile and Conti (1999) argue that termination threats alter the work environment in ways that inhibit creativity, a core input to innovation. In the economics tradition, Manso (2011) suggests that insufficient job security undermines the exploratory behavior required for innovation by eliminating tolerance for early failure. Contracts that mandate termination following poor short-term performance reduce incentives to take risks and test unfamiliar approaches. Supporting this view, experimental evidence involving managers (Ederer and Manso 2013) and observational data on academic scientists (Azoulay et al. 2011) show that tolerance for failure promotes exploratory innovation. Similarly, Acharya et al. (2013, 2014) argue that job security encourages workers to innovate rather than to focus on routine tasks by protecting them from being held up by employers after they exert inventive effort. Empirical evidence from Acharya et al. (2014) and Ekinci and Wehrheim (2024) aligns with this view, showing that stronger employment protection is associated with higher patenting activity.
By focusing on the specific case of corporate R&D employees, this paper introduces an alternative mechanism through which job security influences innovative behavior. Drawing on human capital theory, we posit that increased job security incentivizes employee inventors to allocate more effort toward acquiring firm-specific human capital, which implies mastering technological knowledge whose economic returns are primarily realized within their current employer. This leads to a fundamental change in the nature of the innovations they generate: as inventors acquire more firm-specific human capital, their projects tend to draw more heavily on internal knowledge and exhibit lower novelty. Contrasting this mechanism with prior research, we identify a job security paradox: whereas employment protection provides the necessary safety to fail that facilitates exploration (Manso 2011), it simultaneously strengthens incentives for firm-specific human capital investment in ways that tilt inventive activity toward exploitation rather than novelty.
Whereas the safety-to-fail mechanism operates broadly in settings in which workers choose among actions with different risk–return profiles, the human capital channel emphasized in our study is particularly relevant for R&D professionals employed by innovative firms. First, for these individuals, innovation is not an occasional activity but a core mandate. Their productivity depends critically on their accumulated technological knowledge, which subsequently shapes their future career trajectory. As a result, career concerns influence the direction of inventors’ human capital investments. Second, some of the technological knowledge available to these R&D employees is relatively firm-specific because of the existence of complementary assets within the organization. Because the returns to mastering this firm-specific knowledge are largely tied to continued employment at the focal firm, an increase in inventors’ prospects of staying with the company in the future increases their incentives to invest in it. Consequently, higher job security may shift corporate inventors’ focus toward firm-specific knowledge, leading to more localized search approaches that limit technological novelty and reduce the likelihood of breakthrough innovations.
To test our arguments, we exploit the staggered adoption of employee-friendly labor laws across U.S. states between the 1970s and the 1990s. Known as wrongful discharge laws (WDLs), these statutes introduce exceptions to the employment-at-will doctrine and restrict employers’ ability to terminate employees (Autor et al. 2006). This institutional setting allows us to examine the effects of plausibly exogenous increases in job security on the nature of inventive activity. Using patent data, we identify inventors employed by firms, their locations, and the technological characteristics of their R&D projects. Our sample tracks more than 82,000 unique inventors who are listed as inventors on granted U.S. patents, are employed by publicly traded firms, and work at U.S.-based facilities. We implement a staggered difference-in-differences (DiD) design using a stacked regression approach (Cengiz et al. 2019) and control for employer–employee match fixed effects, allowing us to isolate how changes in job security affect the behavior of a given inventor within a given firm. Our results show that increased job security shifts the nature of inventive activity: inventors rely more heavily on their firms’ prior technological knowledge, produce less novel innovations on average, and generate inventions with higher private economic value for their employers.
Our empirical analysis also provides complementary evidence that supports our proposed mechanism and is difficult to reconcile with alternative explanations. Most importantly, we examine whether the observed changes in innovation reflect inventors’ own decisions rather than shifts in employers’ innovation policies (Griffith and Macartney 2014, Keum 2020). To do so, we exploit differences in responses between inventors working in labs located in their employer’s headquarters (HQ) state and those based in other states. Because inventors outside HQ are typically further removed from centralized corporate decision making, they are likely to have greater autonomy in their innovation activities (Glaeser et al. 2023) and, thus, to respond more strongly to changes in job security. Consistent with this view, the effects are concentrated among inventors working outside corporate HQ. We also test whether innovation responses are driven by changes in employment protection in the inventor’s state of employment or in the firm’s HQ state when the two differ (Bena et al. 2022). Only changes in employment protection in the inventor’s state of employment affect innovation outcomes, suggesting that our results do not reflect broad firm-level policy adjustments. Moreover, we find evidence that the documented change in invention outcomes following increased job security varies according to inventor characteristics such as age or inventive experience. Taken together, these results indicate that our main findings primarily reflect inventors’ own decisions rather than their employers’ decisions.
This study makes several contributions to the literature. First, it provides a complementary perspective on the relationship between job security and innovation incentives by focusing on the career concerns of R&D professionals and the types of innovations they generate. Our results indicate that greater job security encourages inventors to invest in mastering firm-specific technological knowledge, leading to deeper exploitation of the employer’s existing knowledge base and, consequently, to less novel innovations. This finding refines the common view that job security generally favors exploratory innovation (Amabile and Conti 1999, Azoulay et al. 2011, Manso 2011, Ederer and Manso 2013) and documents the existence of an interesting paradox concerning the consequences of inventors’ job security. In settings in which human capital investments are important and can be firm-specific, job security may foster exploitative innovation even as it establishes the safety conditions typically thought to promote exploration. Whereas the safety-to-fail effect is likely to dominate in contexts with limited opportunities for firm-specific investment (e.g., Azoulay et al. 2010, Ederer and Manso 2013), the human capital mechanism we highlight is particularly salient for the innovation activities of R&D employees in the private sector. In these settings, job security increases alignment with internal firm resources but simultaneously discourages the pursuit of exploratory, path-breaking innovation.
Second, we contribute to the strategic human capital literature by showing how individual employee decisions can contribute to shaping firm-level innovation trajectories. Whereas prior research on employment protection primarily focuses on aggregate firm-level patent outcomes (Acharya et al. 2014, Keum 2020, Bena et al. 2022), we examine the microfoundations of this relationship at the inventor level. The study most closely related to ours is Ekinci and Wehrheim (2024), which also analyzes individual inventor outcomes but treats the transferability of inventors’ human capital across employers as exogenously determined. In contrast, we allow for the possibility that inventors actively choose the direction of their human capital investments. This allows us to shed light on how increased job security affects both the degree of firm specificity and the novelty of the innovations that inventors produce. In addition, we make a methodological contribution by evaluating the relationship between wrongful discharge laws and innovation using a stacked DiD design that is robust to staggered policy adoption, addressing concerns about two-way fixed effects estimators in this setting (Cengiz et al. 2019, Baker et al. 2022, Roth et al. 2023).
Finally, we contribute to the literature investigating how institutional constraints on labor mobility shape innovation outcomes. Prior research mostly examines the consequences of restrictions on workers’ voluntary mobility, such as those imposed by trade secret laws or noncompete agreements (see, e.g., Marx et al. 2009, Conti 2014, Contigiani et al. 2018). Whereas that stream of research parallels our study of employment protection, the two institutional contexts trigger fundamentally different strategic mechanisms. Contractual restrictions on workers’ voluntary mobility, such as noncompete agreements, affect firms’ R&D investment decisions by preventing the leakage of critical knowledge to competitors. Conversely, employment protection laws do not interfere with a firm’s ability to prevent knowledge leakage; instead, they alter inventors’ expectations of capturing future returns on firm-specific human capital. Thus, whereas Conti (2014) finds that the protection against leakage afforded by noncompete agreements encourages firms to pursue riskier projects, our findings suggest that protection against involuntary job loss leads inventors to favor exploitative projects of lower inherent novelty. This difference underscores the divergent implications of voluntary and involuntary mobility restrictions for firms’ innovation trajectories.
2. Conceptual Framework
The development of technological innovations requires scientists and engineers in R&D to deliberately invest in acquiring the knowledge and skills needed to build new ideas. As Bhaskarabhatla et al. (2021) show, inventors’ human capital is a primary driver of innovation. Whereas their initial stock of knowledge is largely shaped by formal education (Toivanen and Väänänen 2016), inventors continue to build human capital throughout their careers. In their daily search for solutions, R&D professionals are continually exposed to new technologies and ideas. The tools they use, the projects in which they engage, and the colleagues with whom they collaborate all play a critical role in shaping the evolution of their human capital (Akcigit et al. 2018, Bhaskarabhatla et al. 2021).
As a nonroutine task, R&D grants scientists and engineers considerable autonomy in how they approach problems (Bailyn 1985). This discretion allows inventors to shape, at least in part, the type of human capital they accumulate.1 This matters because both the quantity and nature of accumulated human capital influence the market value of their skills (Topel 1990). A useful lens for analyzing these investments is the classic distinction in human capital theory between general skills—valuable across employers—and firm-specific skills—valuable primarily within the current employer (Becker 1962). Research on inventors’ interfirm mobility underscores the relevance of this distinction for R&D workers. For example, Marx et al. (2009) find that inventors specialized in narrow technological fields are disproportionately affected by noncompete clauses, which restrict job mobility and effectively increase the firm specificity of their human capital. Similarly, Palomeras and Melero (2010) show that knowledge characteristics associated with high firm specificity—such as complementarity with coworkers’ knowledge—reduce an inventor’s external market value, thereby limiting mobility.
Prior research also illustrates that inventors adjust their behavior in response to factors that affect their career prospects. In environments in which interfirm mobility is restricted by employer-friendly trade secret laws, Contigiani et al. (2018) find that R&D employees have weaker incentives to signal their quality to the external labor market and, as a result, reduce their quality-weighted patent output. At the same time, they shift toward developing general-purpose technologies that are more valuable in markets less affected by such legal constraints. Similarly, Marx et al. (2015) document that inventors in states where noncompete agreements become enforceable tend to relocate to states without such enforcement, seeking greater career flexibility. In a different context, Tandon and Toh (2022) show that inventors who are less concerned with their career prospects are less likely to align their search strategies with their firm’s technological priorities. Building on these insights, we argue that job security, by shaping inventors’ prospects of staying with their current employer, may affect their inventive behavior.
In particular, by increasing inventors’ expected tenure at their current firm, job security may influence their decisions regarding human capital accumulation. Employment protection does not guarantee continued employment but raises the cost of dismissal, thereby altering the probability and timing of job separation and increasing expected employment duration (Lazear 1990).2 Even when baseline job stability is relatively high, such changes in expected tenure can meaningfully affect incentives to invest in firm-specific human capital (MacLeod and Nakavachara 2007). When workers anticipate a longer employment relationship, they are more willing to commit to their employers and to invest in firm-specific skills that would otherwise be suboptimal because of the potential holdup problem associated with early termination (Wang and Barney 2006). A reduced fear of job loss may offset this effect to some extent by diminishing workers’ incentives to put effort into acquiring any type of human capital (Ichino and Riphahn 2005). However, greater job security still places a premium on the relative incentives to invest in firm-specific rather than general human capital. Hence, the level of job security determines the mix of skills that workers choose to develop. When job security is low, workers are more likely to prioritize general, transferable skills that are not subject to the holdup problem. In contrast, higher job security comparatively encourages greater investment in firm-specific skills (Wasmer 2006, MacLeod and Nakavachara 2007). Acharya et al. (2014), who view innovations as inherently firm-specific investments, theorize that employment protection incentivizes non–R&D-specialized workers to generate innovations rather than perform routine tasks by reducing the risk of employer holdup. The corporate governance literature also suggests that provisions protecting managers against takeovers, such as poison pills or staggered boards, may induce them to make firm-specific human capital investments via increased job security (Wang et al. 2016).
In the case of specialized R&D workers, the firm specificity of their human capital investments depends on how deeply their acquired knowledge is embedded in the firm’s technological background. The intellectual effort required to produce innovations involves dedicating time and energy to acquiring and recombining technological knowledge. In this context, investment in firm-specific human capital takes the form of greater effort devoted to understanding and building upon technologies in which the employer holds distinctive expertise relative to other firms. This, in turn, shapes the inventor’s knowledge-sourcing process toward domains closely aligned with the firm’s existing technological base. Firm-specific technological knowledge is particularly valuable to the inventor’s current employer as it fosters innovations that align closely with the company’s particular needs and resources by leveraging internal complementarities. Such innovations are, therefore, primarily valuable to the focal firm. Alternatively, inventors who allocate more effort toward general human capital accumulation develop the capacity to create innovations that are valuable to a broader range of employers but may not align as closely with the specific capabilities and resources of their current organization.
As a consequence, inventors’ job security influences the types of innovations that they generate, and this is the ultimate object of our study. As inventors perceive an extended expected tenure within their organizations, they are more inclined to engage with firm-specific technological domains in their inventive activity. This leads them to develop innovations that draw more heavily on the company’s existing stock of knowledge. In contrast, inventors who perceive lower job security place relatively greater value on more broadly applicable technological knowledge, which is portable across employers. Consequently, inventors with lower levels of job security tend to develop inventions that draw less heavily on the firm’s existing stock of knowledge.
Importantly, the shift toward greater reliance on firm-specific technological knowledge induced by higher job security also affects other relevant aspects of innovation outcomes. In particular, job security may lead inventors to develop innovations that (i) exhibit a lower degree of novelty and (ii) are less likely to become breakthrough innovations. According to the innovation and organizational learning literatures, novel technologies often emerge from a process of broad search and recombination (Fleming 2001). Inventors who allocate greater effort toward firm-specific human capital may, therefore, be less suited for broad recombination endeavors, which typically require integrating diverse external knowledge (Ahuja and Lampert 2001, Rosenkopf and Nerkar 2001, Phene et al. 2006). The emphasis on firm-specific knowledge tends to induce local search, limiting inventors’ exposure to diverse technological inputs and increasing the risk of path dependence and cognitive lock-in (Thrane et al. 2010). This inward-looking approach can prevent them from leveraging insights from external sources, and lower exposure to new knowledge and perspectives decreases their ability to detect new opportunities for recombination (Arts and Fleming 2018), making them less likely to approach technological projects in fresh, innovative ways.
Moreover, inventors who allocate substantial effort toward firm-specific human capital may become less inclined to adopt radically novel approaches in their R&D projects. Their focus on generating innovations that complement the firm’s existing resources and capabilities naturally leads them to build extensively on the organization’s prior technological advancements. Because they have high stakes in the technological domains in which they have invested, their incentive is to generate innovations that consolidate that trajectory and open new applications for it rather than to pursue radically new technologies that may shift paradigms. Thus, within the classic exploration–exploitation trade-off framework in organizational learning (March 1991), job security is expected to encourage inventors to engage more in exploitative rather than exploratory innovation.
The decline in novelty associated with higher job security may also hinder the generation of breakthrough innovations, that is, innovations with particularly strong technological impact. As previous literature notes, novel innovations tend to exhibit greater variability in technological impact and are, therefore, a significant source of breakthroughs (Fleming 2001, Arts and Veugelers 2015). By encouraging greater reliance on the organization’s existing technological knowledge base, job security narrows the range of elements available for recombination in the innovation process. Reduced experimentation with new technological elements, in turn, lowers the variance in innovation success and, therefore, the probability of an innovation becoming a technological breakthrough (Fleming 2001). Accordingly, we expect that high job security reduces the likelihood of producing highly impactful innovations.
3. Empirical Setting, Data, and Methods
3.1. Wrongful Discharge Laws
We exploit the implementation of employment protection laws to identify plausibly exogenous variation in the job security of employee inventors. Because these laws restrict employers’ ability to terminate employees, we assume that their introduction increased job security for affected workers. In Section 4.3.1, we provide evidence that the adoption of these employment protection laws is associated with decreases in inventor turnover, indicating greater job stability for this particular group of workers.
To estimate the effect of job security on inventor behavior, we use a stacked DiD approach that exploits variation in firing costs arising from the staggered adoption of WDLs by U.S. state courts between the 1970s and the 1990s. Under the traditional employment-at-will doctrine, employers could fire workers “for good cause, bad cause, or no cause at all” (Payne v. Western & Atlantic Railroad, Supreme Court of Tennessee, 1884). During the last quarter of the 20th century, however, many state courts recognized three common-law exceptions to employment at will: the good faith exception, the implied contract exception, and the public policy exception. These exceptions reduced employers’ ability to terminate workers and constrained their effective firing authority.3
The good faith exception implies a tacit agreement to terminate employment only in good faith and fair dealing, preventing employers from firing workers for bad cause, such as depriving them of commissions or pension benefits. A broad interpretation of this exception implies a general prohibition against termination without just cause, such as economic necessity or poor performance, and can, therefore, have far-reaching consequences (Dertouzos and Karoly 1992, Autor et al. 2007). Legal scholars consider this exception the most significant departure from employment at will and the most far-reaching of the three exceptions (Kugler and Saint-Paul 2004). It provides employees with both contract and tort causes of action, allowing claims for contractual losses, emotional distress, and potentially punitive damages, all of which can be highly uncertain.
The implied contract exception protects workers from dismissal when an employer has made an explicit or implicit promise not to terminate without good cause. Such promises may arise from employment contracts, personnel policy handbooks, or expectations based on firm practices. Employers can largely shield themselves from implied contract claims by explicitly stating that employment is at will, and survey evidence suggests that most employers take such steps to mitigate litigation risk (Sutton and Dobbin 1996).
The public policy exception protects employees against dismissals that violate an important public policy, such as performing jury duty or reporting employer wrongdoing. Prior work suggests that this exception has limited legal and economic significance because compensation awards are rare and courts apply it narrowly (Edelman et al. 1992, Autor et al. 2006).
Figure 1 illustrates the adoption of all three WDL exceptions in U.S. states from 1970 to 1999. Our primary focus is on the adoption of the good faith exception. Although any of the three exceptions may increase employment protection in principle, prior research emphasizes substantial heterogeneity in their economic consequences across employment relationships. In particular, MacLeod and Nakavachara (2007) highlight that the good faith exception is a mandatory rule that applies broadly to all employment relationships in contrast to the implied contract exception, which applies only in limited circumstances when a long-term understanding between employer and employee can be established. Because of this difference in scope and applicability, the implied contract exception is less likely to affect perceived job security for high-skill workers.
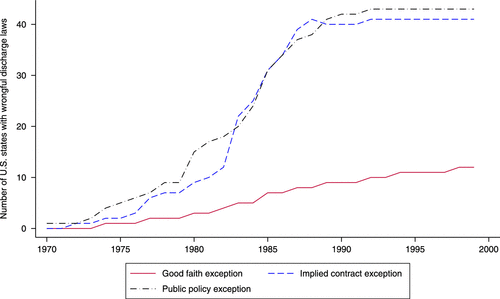
Notes. This figure shows the cumulative number of U.S. states that have recognized each wrongful discharge law exception. Data are from Autor et al. (2006).
Whereas Autor et al. (2006) find no robust aggregate employment or wage effects of the good faith exception, MacLeod and Nakavachara (2007) show that it has pronounced effects in occupations characterized by high levels of training and relationship-specific human capital, whereas its effects are muted or even negative in jobs requiring lower levels of human capital investment. They point out that estimates that average across heterogeneous workers may understate the relevance of the good faith exception for high-skill employees (such as employee inventors). Consistent with this, prior empirical research indicates that the adoption of this exception has significant implications for innovation, whereas the adoption of the implied contract and public policy exceptions does not (Acharya et al. 2014, Bena et al. 2022, Ekinci and Wehrheim 2024). We, therefore, focus on the good faith exception as our primary source of variation in employment protection.
A key identifying assumption in our analysis is that the adoption of the good faith exception is unlikely to be driven by unobserved changes in a state’s economic or political conditions correlated with innovation activity. Several pieces of evidence support this assumption. First, adoption occurs through state judicial precedents rather than prolonged legislative processes. Second, Acharya et al. (2014) show that adoption is not driven by shifts in political or economic conditions or by other labor regulations and that such decisions are unexpected. Third, we present a set of tests suggesting that the good faith exception generates plausibly exogenous variation in employment protection in our study of inventor behavior (Section 4.2.1).
3.2. Data Sources
Our sample consists of employee inventors at public firms in the United States. We obtain disambiguated inventor data and other basic information on patents from the U.S. Patent and Trademark Office’s (USPTO) PatentsView repository, which includes data on disambiguated inventors and patent filings since 1975. To associate inventors with firms, we use the updated Kogan et al. (2017) data from Stoffman et al. (2022), which assigns Center for Research in Security Prices (CRSP) firm identifiers to patent filings up to 2022. We then match these firms to Compustat using the Compustat-CRSP Merged database. For coding the introduction of WDLs, we follow prior literature and use the data from Autor et al. (2006), which provide state-level information on their adoption for the period 1970–1999 (see Online Table A.1).
To calculate control variables and those used in additional tests, we gather financial information from the Compustat Annual Files and state-level characteristics from the U.S. Bureau of Economic Analysis, the U.S. Bureau of Labor Statistics, and the U.S. Census Bureau as well as data on noncompete enforcement from Bird and Knopf (2009, 2015). We also use data on inventor age from Kaltenberg et al. (2023), text-based patent similarity data from Whalen et al. (2020), the private economic value of patents from Kogan et al. (2017), information on disruptive patented innovations from Funk and Owen-Smith (2017), and patent text novelty indicators from Kalyani (2024). Our working sample covers the years between 1975 and 2008, the period for which we can meaningfully track inventors and their innovations with patent data around the WDL introduction events codified in Autor et al. (2006).4
3.3. Stacked DiD Sample
To address the problems associated with staggered treatment timing when using traditional two-way fixed effects DiD estimators (de Chaisemartin and D’Haultfœuille 2020, Callaway and Sant’Anna 2021, Goodman-Bacon 2021), we employ a stacked DiD approach (Gormley and Matsa 2011, Cengiz et al. 2019, Xia et al. 2025) as recommended in recent econometrics literature (Baker et al. 2022, Roth et al. 2023, Wing et al. 2024). We use the coding of the adoption of the good faith exception provided by Autor et al. (2006) as our starting point. This coding is particularly appealing because it assigns a law change to the date of a precedent-setting court decision, ensuring that unexpected legal changes are used to assess their effects on outcome variables. We initially define the 13 U.S. states that adopted the good faith exception at different points in time (adoption events) as treated states and those that never adopted it as control states (see Figure 1 and Online Table A.1).
We examine the impact of the good faith exception over a five-year preadoption period and a 10-year postadoption period. We use a five-year preadoption period to minimize data loss because of insufficient observations in earlier years. We consider the 10 years after the adoption event to capture the long-term nature of innovation. If a state reversed the good faith exception, the postevent period ends at the reversal date. We exclude two states with adoption events that occurred before 1980 as we lack data for the entire pre-event period.
To identify treated inventors, we link the treated states to the PatentsView–Compustat data using the inventor’s location as reported in patent documents. Patent applicants are required to report their individual address on the patent application and have no economic incentive to misreport it (Alcácer and Zhao 2012). Whereas exact addresses are often unavailable, inventors’ states of residence are nearly always reported. Employment laws typically apply to the state where an employee works, and an advantage of our data is that the geographical information likely reflects the state where an inventor actually works rather than the state of the firm’s HQ. Because events with very few treated units can lead to unreliable estimates and potential bias (Wing et al. 2024), we drop four states that, after all sample filters are applied, contribute fewer than 25 treated inventors: Alaska (3), Nevada (7), Montana (12), and Wyoming (23). Our final sample includes seven adoption events, each with at least 160 treated inventors.5
We require candidate control inventors to have patented at least once within the event window (−5 to +10 years around the adoption decision) in any of the 37 states that never adopted the good faith exception as listed in Autor et al. (2006).6 We exclude inventors with patent filings in multiple states. We construct each event-specific data set by combining treated inventors with all control inventors who meet the above criteria for that event. Finally, we stack the seven data sets into a single combined file in which the unit of observation is the inventor–patent pair. Whereas the exact number of inventors varies by specification, our main sample comprises 9,148 unique treated inventors and 72,063 unique control inventors.7
3.4. Variables
3.4.1. Main Dependent Variable.
Given that the primary objective of our study is to investigate whether job security leads inventors to produce innovations that are more intensely based on the firm’s existing technological stock, we follow a large literature that relies on patent citation flows to measure this outcome (He and Wang 2009; Wang et al. 2009, 2017; Moeen et al. 2013; Alok and Subramanian 2023). Our main dependent variable, Share firm refs, measures the fraction of an inventor’s patent citations to prior art that reference patents owned by the inventor’s employer. Because patent law requires inventors to disclose the relevant prior art underlying an invention, citation patterns provide a meaningful indicator of the knowledge sources underlying inventive activity (Hall et al. 2001). A higher share of firm references, therefore, indicates greater reliance on the firm’s own prior technologies relative to external technologies. As documented by Moser et al. (2018), such references are an indicator of follow-on inventions within the same firm.
3.4.2. Main Independent Variables.
The most important independent variable in our analysis is the treatment indicator, Good faith, which equals one for all inventor–patent observations in the treatment group regardless of time and zero otherwise. The second key independent variable is the time indicator, PostGF, which equals one for all inventor–patent observations in the 10 years following the corresponding adoption event regardless of treatment and zero otherwise. These two variables allow us to define the interaction term Good faith PostGF, which equals one for inventor–patent observations in the treatment group during the 10-year postadoption period and zero otherwise.
3.4.3. Control Variables.
We include inventor-level controls to account for heterogeneity in career stage and experience that may affect incentives to build on firm-specific technological knowledge. Specifically, we control for inventor age (Ln(Age)) and its squared term (Ln(Age)2) as well as tenure with the current employer, measured by years since the inventor’s first patent application at the firm (Ln(1+Tenure)) and its squared term (Ln(1+Tenure)2). We also include firm-level controls capturing innovation-related characteristics, including firm size measured by annual net sales (Ln(Sales)), R&D intensity (Ln(1+R&D/Assets)), and patenting intensity (Ln(Pats/Assets)). Finally, we include state-level controls to account for variation in economic conditions, human capital supply, political environment, and legal institutions. These controls include real state gross domestic product (GDP) (Ln(Real state GDP)), real state GDP growth (Real state GDP growth), the number of degree-granting institutions (Ln(Colleges)), higher education enrollment (Ln(Enrollment)), state population (Ln(Population)), unemployment rate (Unemployment rate), political balance in the U.S. House (Political balance), and the state-year noncompete enforcement index (NCA).
Table 1 provides an overview of the data set. Panel A lists variable definitions, panel B reports summary statistics, and panel C reports for each adoption event the number and share of inventors resident in the adopting state and in never-adopting control states.
|

Table 1. Variable Definitions, Summary Statistics, and the Number of Treated Inventors by Event
| Panel A: Variable definitions | ||
|---|---|---|
| Variable | Definition | Source |
| Wrongful discharge laws variables | ||
| Good faith | An indicator variable that equals one if the inventor’s state of residence has adopted the good faith exception and zero otherwise | Autor et al. (2006), PatentsView |
| PostGF | An indicator variable that equals one if the inventor’s patent application date observation is from after the adoption of the good faith exception and zero otherwise | Autor et al. (2006), PatentsView |
| Implied contract | An indicator variable that equals one if the inventor’s state of residence has adopted the implied contract exception and zero otherwise | Autor et al. (2006), PatentsView |
| PostIC | An indicator variable that equals one if the inventor’s patent application date observation is from after the adoption of the implied contract exception and zero otherwise | Autor et al. (2006), PatentsView |
| Public policy | An indicator variable that equals one if the inventor’s state of residence has adopted the public policy exception and zero otherwise | Autor et al. (2006), PatentsView |
| PostPP | An indicator variable that equals one if the inventor’s patent application date observation is from after the adoption of the public policy exception and zero otherwise | Autor et al. (2006), PatentsView |
| Implied contract active | An indicator variable that equals one if the inventor’s state of residence has adopted the implied contract exception at patent application date t and zero otherwise | Autor et al. (2006), PatentsView |
| Public policy active | An indicator variable that equals one if the inventor’s state of residence has adopted the public policy exception at patent application date t and zero otherwise | Autor et al. (2006), PatentsView |
| Good faith active (neighboring state) | An indicator variable that equals one if a neighboring state to the inventor’s state of residence has adopted the good faith exception at patent application date t and zero otherwise | Autor et al. (2006), PatentsView |
| Good faith active (HQ state) | An indicator variable that equals one if the inventor’s assignee state has adopted the good faith exception at patent application date t and zero otherwise | Autor et al. (2006), PatentsView |
| Innovation variables | ||
| Share firm refs | The number of backward references in a patent that cite the inventor’s employer divided by the total number of backward references | Stoffman et al. (2022), PatentsView |
| Share similarity firm refs | The number of backward references in a patent that cite the inventor’s employer, weighted by patent text similarity scores, divided by the total number of backward references | Whalen et al. (2020), Stoffman et al. (2022), PatentsView |
| Turnover | An indicator variable that equals one if the inventor’s current patent and subsequent patent are assigned to different employers and zero otherwise | Stoffman et al. (2022), PatentsView |
| Ln(1+Coinventors) | The natural logarithm of (one plus) the total number of coinventors in a patent | PatentsView |
| Ln(1+New coinventors) | The natural logarithm of (one plus) the total number of new coinventors in a patent | PatentsView |
| Ln(Patent value) | The natural logarithm of the private economic value of a patent | Kogan et al. (2017), Stoffman et al. (2022) |
| Patent renewal | An indicator variable equal to one if a patent is renewed after twelve years, and zero otherwise | USPTO Patent Maintenance Fee Events |
| CD index | The CD index | Funk and Owen-Smith (2017) |
| mCD index | The mCD index | Funk and Owen-Smith (2017) |
| Text novelty | The number of new technical bigrams in a patent divided by the total number of technical bigrams | Kalyani (2024) |
| Top 5% cites | An indicator variable equal to one if a patent is among the top 5% of all patents with the same application year and NBER technology category in terms of forward citations received and zero otherwise | PatentsView |
| Control variables | ||
| Ln(Age) | The natural logarithm of the difference between the current patent application year and the inventor’s birth year | Kaltenberg et al. (2023), PatentsView |
| Ln(Age)2 | The square of Ln(Age) | |
| Ln(1+Tenure) | The natural logarithm of (one plus) the difference between the current patent application year and the inventor’s first application year with the employer | Stoffman et al. (2022), PatentsView |
| Ln(1+Tenure)2 | [The square of Ln(1+Tenure)] | |
| Ln(Sales) | The natural logarithm of the employer’s net sales per year | Compustat Annual Data Item #12 |
| Ln(1+R&D/Assets) | The natural logarithm of (one plus) the employer’s research and development expenditures per year divided by total assets | Compustat Annual Data Items #46 and #6 |
| Ln(Pats/Assets) | The natural logarithm of the employer’s total number of patents filed per year divided by total assets | Stoffman et al. (2022), Compustat Annual Data Item #6 |
| Ln(Colleges) | The natural logarithm of the number of degree-granting institutions of higher education in a given state per year | U.S. Census Bureau |
| Ln(Enrollment) | The natural logarithm of enrollment in institutions of higher education in a given state per year | U.S. Census Bureau |
| Ln(Real state GDP) | The natural logarithm of annual real state GDP | U.S. Bureau of Economic Analysis |
| Real state GDP growth | The continuously compounded real state GDP growth per state and year | U.S. Bureau of Economic Analysis |
| Ln(Population) | The natural logarithm of a state’s population in a given year | U.S. Bureau of Economic Analysis |
| Unemployment rate | A state’s unemployment rate in a given year | U.S. Bureau of Labor Statistics |
| Political balance | The ratio of Democrat-to-Republican representatives in the Lower House (House of Representatives) for a given state and year | U.S. Census Bureau |
| NCA | The score of noncompete enforcement per state and year | Bird and Knopf (2009, 2015), Garmaise (2011) |
| Panel B: Summary statistics (n = 1,235,472) | |||||||
|---|---|---|---|---|---|---|---|
| Variable | 5% | 25% | Median | Mean | 75% | 95% | Standard deviation |
| Good faith | 0.000 | 0.000 | 0.000 | 0.034 | 0.000 | 0.000 | 0.180 |
| PostGF | 0.000 | 0.000 | 1.000 | 0.670 | 1.000 | 1.000 | 0.470 |
| Implied contract active | 0.000 | 0.000 | 1.000 | 0.712 | 1.000 | 1.000 | 0.453 |
| Public policy active | 0.000 | 0.000 | 1.000 | 0.675 | 1.000 | 1.000 | 0.469 |
| Good faith active (neighboring state) | 0.000 | 0.000 | 0.000 | 0.037 | 0.000 | 0.000 | 0.188 |
| Good faith active (HQ state) | 0.000 | 0.000 | 0.000 | 0.119 | 0.000 | 1.000 | 0.323 |
| Share firm refs | 0.000 | 0.000 | 0.091 | 0.200 | 0.333 | 0.800 | 0.263 |
| Share similarity firm refs | 0.000 | 0.000 | 0.077 | 0.241 | 0.422 | 1.000 | 0.311 |
| Turnover | 0.000 | 0.000 | 0.000 | 0.166 | 0.000 | 1.000 | 0.372 |
| Coinventors | 0.000 | 1.000 | 2.000 | 2.165 | 3.000 | 6.000 | 2.190 |
| New coinventors | 0.000 | 0.000 | 1.000 | 1.381 | 2.000 | 5.000 | 2.042 |
| Patent value (in $millions) | 0.823 | 3.081 | 6.615 | 16.639 | 15.190 | 60.118 | 39.390 |
| Patent renewal | 0.000 | 0.000 | 0.000 | 0.470 | 1.000 | 1.000 | 0.499 |
| CD index | −0.105 | 0.000 | 0.027 | 0.129 | 0.143 | 1.000 | 0.284 |
| mCD index | −1.243 | 0.000 | 0.131 | 1.155 | 1.038 | 6.718 | 4.881 |
| Text novelty | 0.000 | 0.304 | 0.826 | 0.989 | 1.488 | 2.861 | 0.825 |
| Top 5% cites | 0.000 | 0.000 | 0.000 | 0.073 | 0.000 | 1.000 | 0.261 |
| Age | 30.000 | 35.000 | 41.000 | 41.320 | 47.000 | 55.000 | 7.792 |
| Tenure | 0.000 | 0.455 | 2.647 | 4.234 | 6.411 | 14.115 | 4.689 |
| Sales (in $billions) | 0.199 | 2.895 | 9.620 | 19.598 | 22.681 | 78.508 | 25.805 |
| R&D/Assets | 0.004 | 0.023 | 0.047 | 0.056 | 0.073 | 0.131 | 0.065 |
| Pats/Assets | 0.001 | 0.008 | 0.022 | 0.044 | 0.044 | 0.117 | 0.141 |
| Colleges | 47.000 | 70.000 | 142.000 | 154.048 | 204.000 | 321.000 | 92.681 |
| Enrollment (in millions) | 0.162 | 0.296 | 0.542 | 0.580 | 0.901 | 1.056 | 0.334 |
| Real state GDP (in $billions) | 47.522 | 121.228 | 217.725 | 261.246 | 350.888 | 634.812 | 178.645 |
| Real state GDP growth | 0.013 | 0.048 | 0.075 | 0.072 | 0.095 | 0.135 | 0.036 |
| Population (in millions) | 3.095 | 5.794 | 10.946 | 11.013 | 17.057 | 18.959 | 5.708 |
| Unemployment rate | 3.000 | 4.400 | 5.500 | 5.546 | 6.400 | 8.500 | 1.703 |
| Political balance | 0.600 | 1.000 | 1.314 | 1.450 | 1.667 | 2.439 | 1.073 |
| NCA | 2.000 | 3.000 | 5.000 | 4.319 | 5.000 | 6.000 | 1.424 |
| Panel C: Inventors by adoption event (adopting versus control states) | |||||
|---|---|---|---|---|---|
| Event | Adopting state | Adoption date (good faith decision) | Inventors in adopting state (%) | Inventors in nonadopting states (%) | Total inventors (event sample) |
| 1 | Connecticut | 06/1980 | 1,647 (4.9) | 31,864 (95.1) | 33,511 |
| 2 | California | 10/1980 | 4,880 (12.8) | 33,256 (87.2) | 38,136 |
| 3 | Oklahoma | 05/1985 | 428 (2.1) | 19,828 (97.9) | 20,256 |
| 4 | Arizona | 06/1985 | 902 (2.2) | 40,153 (97.8) | 41,055 |
| 5 | Idaho | 08/1989 | 554 (1.1) | 50,458 (98.9) | 51,012 |
| 6 | Delaware | 04/1992 | 577 (1.2) | 47,294 (98.8) | 47,871 |
| 7 | Louisiana | 01/1998 | 160 (0.5) | 33,549 (99.5) | 33,709 |
Notes. Panel A provides variable definitions and lists their sources. Panel B presents summary statistics. Panel C lists, for each adoption event, the adopting state, the court decision date, the number of inventors resident in that state, and the number of inventors in the never-adopting states that serve as the control pool.
3.5. Stacked DiD Estimation
To examine the effects of the adoption of the good faith exception on inventors’ firm-specific investments, we estimate the following stacked DiD regression:
A unique feature of our empirical design is that it allows us to include inventor firm event fixed effects, represented by . This set of employer–employee fixed effects accounts for the inventor’s innate ability, the employer’s unobserved innovation capabilities, and other time-invariant unobserved factors specific to the inventor, the employer, or the match between them (e.g., assortative matching). Furthermore, including these fixed effects rules out the possibility that the estimated effect of changes in employment protection on inventors’ behavior is driven by inventors who enter or leave employment or change employers.
4. Empirical Results
4.1. Main Results
We begin by investigating whether the increase in job security resulting from greater employment protection leads to a change in inventors’ reliance on their employer’s prior technologies. Figure 2 illustrates the dynamic effects of adopting the good faith exception on the share of backward references to firm-owned patents, comparing treated inventors with control inventors. The preadoption trends appear similar for the treatment and control groups, consistent with the parallel-trends assumption underlying our DiD approach. Specifically, we observe no significant differences in the share of firm references between treated and control inventors during the years preceding the adoption of the good faith exception. Furthermore, we observe no significant change in the adoption year or in the three subsequent years. A statistically significant increase emerges in the fourth year after adoption and persists thereafter. This pattern is intuitive as changes in inventor behavior typically require time to be reflected in their patents.
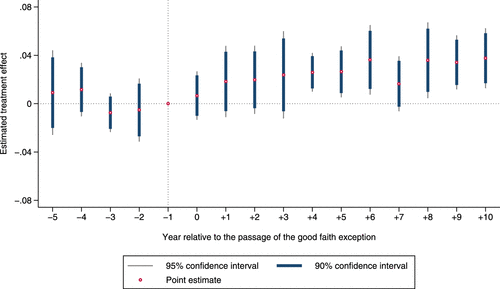
Notes. This figure plots the regression coefficients along with 95% and 90% confidence intervals for the dynamic effect of the good faith exception on inventors’ reliance on their employers’ prior technologies. The regression specification is similar to column (8) of Table 2. Coefficients for the interaction terms between the good faith treatment and year indicators are shown.
Table 2 presents the results from estimating Equation (1) with varying fixed effects schemes. Column (1) includes event-specific fixed effects for time, inventor, firm, state, and technology along with the good faith treatment indicator. Columns (2)–(4) progressively incorporate event-specific technology and regional trends. Columns (5)–(8) replicate these specifications but replace the separate event-specific fixed effects for inventor and firm with event-specific inventor–firm paired fixed effects, which represent our preferred choice. Across all specifications in Table 2, the treatment coefficient is positive, statistically significant, and ranges from 0.016 to 0.021. A coefficient of 0.020 in column (8) suggests that the good faith exception increases the inventor’s share of references to the inventor’s employer by approximately 2.0 percentage points compared with control inventors, corresponding to a 10.0% increase over the sample mean. This result is both economically and statistically significant, consistent with the visual evidence documented in Figure 2.
|
Table 2. Effect of the Good Faith Exception on the Types of Innovations Developed by Inventors
| Dependent variable: Share firm refs | ||||||||
|---|---|---|---|---|---|---|---|---|
| Estimation: Ordinary Least Squares (OLS) | (1) | (2) | (3) | (4) | (5) | (6) | (7) | (8) |
| Good faith PostGF | 0.016* | 0.017*** | 0.019** | 0.018*** | 0.018** | 0.019*** | 0.021** | 0.020*** |
| (0.008) | (0.006) | (0.009) | (0.006) | (0.008) | (0.006) | (0.009) | (0.007) | |
| Event-time fixed effects | Yes | Yes | ||||||
| Event-inventor fixed effects | Yes | Yes | Yes | Yes | ||||
| Event-firm fixed effects | Yes | Yes | Yes | Yes | ||||
| Event-state fixed effects | Yes | Yes | Yes | Yes | Yes | Yes | Yes | Yes |
| Event-technology fixed effects | Yes | Yes | Yes | Yes | ||||
| Event-technology-time fixed effects | Yes | Yes | Yes | Yes | ||||
| Event-region-time fixed effects | Yes | Yes | Yes | Yes | ||||
| Event-inventor-firm fixed effects | Yes | Yes | Yes | Yes | ||||
| Number of events | 7 | 7 | 7 | 7 | 7 | 7 | 7 | 7 |
| Number of states | 44 | 44 | 44 | 44 | 44 | 44 | 44 | 44 |
| Number of inventors | 84,763 | 84,341 | 84,523 | 84,070 | 83,390 | 82,947 | 83,146 | 82,674 |
| Number of observations | 1,281,666 | 1,271,086 | 1,275,683 | 1,264,461 | 1,264,118 | 1,253,238 | 1,257,988 | 1,246,477 |
Notes. This table presents stacked DiD results from OLS regressions examining the effect of the good faith exception on inventors’ reliance on their employers’ prior technologies. The unit of observation is the inventor–patent. Robust standard errors are clustered by state (reported in parentheses). Variable definitions are provided in Table 1. Number of events refers to the unique number of adoption events in the sample. Number of states refers to the unique number of states in the sample. Number of inventors refers to the unique number of inventors in the sample. Number of observations refers to the total number of inventor–patent observations in the sample.
*; **; ***.
Columns (1) and (2) of Table 3 present models comparable to column (8) of Table 2, but they focus on the implied contract and public policy exceptions instead of the good faith exception. Specifically, we construct two new data sets centered on the adoption of these exceptions, following the same procedure applied to the analysis of the good faith exception as detailed in Section 3.3. The results indicate that the treatment coefficients associated with the adoption of the implied contract and public policy exceptions are very small and statistically insignificant. This finding aligns with the legal literature on the topic and recent studies on innovation as discussed in Section 3.1. Columns (3)–(5) of Table 3 return to our main data set to estimate the impact of the good faith exception, progressively adding two variables that indicate whether the implied contract and public policy exceptions were active (i.e., in effect) in a given state at a given time. The good faith treatment coefficient remains positive with a slightly larger marginal effect compared with column (8) of Table 2. By contrast, the coefficients for the implied contract and public policy exception indicator variables remain very small and statistically insignificant.
|
Table 3. Effect of the Good Faith Exception and Other WDLs on the Types of Innovations Developed by Inventors
| Dependent variable: Share firm refs | ||||||||
|---|---|---|---|---|---|---|---|---|
| Estimation: OLS | (1) | (2) | (3) | (4) | (5) | (6) | (7) | (8) |
| Implied contract PostIC | −0.002 | |||||||
| (0.005) | ||||||||
| Public policy PostPP | 0.007 | |||||||
| (0.006) | ||||||||
| Good faith PostGF | 0.021*** | 0.021*** | 0.021*** | 0.021*** | 0.021*** | 0.022*** | ||
| (0.007) | (0.007) | (0.007) | (0.007) | (0.007) | (0.007) | |||
| Implied contract active | 0.004 | 0.004 | 0.003 | 0.003 | ||||
| (0.003) | (0.003) | (0.003) | (0.003) | |||||
| Public policy active | −0.001 | −0.001 | −0.001 | −0.001 | ||||
| (0.005) | (0.005) | (0.005) | (0.005) | |||||
| Controls | Yes | Yes | Yes | |||||
| Event-state fixed effects | Yes | Yes | Yes | Yes | Yes | Yes | Yes | Yes |
| Event-technology-time fixed effects | Yes | Yes | Yes | Yes | Yes | Yes | Yes | Yes |
| Event-region-time fixed effects | Yes | Yes | Yes | Yes | Yes | Yes | Yes | Yes |
| Event-inventor-firm fixed effects | Yes | Yes | Yes | Yes | Yes | Yes | Yes | Yes |
| Number of events | 27 | 26 | 7 | 7 | 7 | 7 | 7 | 7 |
| Number of states | 34 | 33 | 44 | 44 | 44 | 43 | 43 | 43 |
| Number of inventors | 37,953 | 35,853 | 82,674 | 82,674 | 82,674 | 81,211 | 81,211 | 81,211 |
| Number of observations | 788,705 | 1,082,229 | 1,246,477 | 1,246,477 | 1,246,477 | 1,235,472 | 1,235,472 | 1,235,472 |
Notes. This table presents stacked DiD results from OLS regressions examining the effect of different WDLs on inventors’ reliance on their employers’ prior technologies. Column (1) uses an implied contract–specific data set, whereas column (2) uses a public policy–specific data set. Columns (3)–(5) use the good faith–specific baseline data set and control for whether a given state has adopted the implied contract and public policy exceptions at the time of the patent application. Columns (6)–(8) repeat the specifications from columns (3)–(5) but include additional control variables. The unit of observation is the inventor–patent. Robust standard errors are clustered by state (reported in parentheses). Control variables and variable definitions are provided in Table 1. Number of events refers to the unique number of adoption events in the sample. Number of states refers to the unique number of states in the sample. Number of inventors refers to the unique number of inventors in the sample. Number of observations refers to the total number of inventor–patent observations in the sample.
*; **; ***.
Finally, columns (6)–(8) of Table 3 replicate the specifications of the previous three columns, also incorporating the control variables described in Section 3.4.3. The inclusion of these control variables has a limited impact on the estimated treatment effect. Column (8) of Table 3 includes the full set of control variables and constitutes our preferred specification. The treatment estimate indicates that inventors experiencing enhanced job security via the adoption of the good faith exception increase their reliance on firm-specific technologies by 2.2 percentage points with respect to the control group. This effect represents an 11.0% increase relative to the sample mean.11
4.2. Robustness Checks
4.2.1. Accounting for Changes in Local Economic Conditions.
The source of variation in job security exploited in our analysis occurs at the state level. It is, therefore, important to assess whether our results reflect unobserved changes in local economic conditions that might simultaneously influence both the adoption of the good faith exception and inventors’ reliance on firm-specific technologies. We address this concern with several robustness tests reported in Table 4.
|
Table 4. Effect of the Good Faith Exception on the Types of Innovations Developed by Inventors: Robustness Tests
| Dependent variable | Share firm refs | Share firm refs | Share firm refs | Share firm refs | Share similarity firm refs |
|---|---|---|---|---|---|
| Sample | Year 1990 | Excluding NBER subcategory 46 | All | All | All |
| Estimation: OLS | (1) | (2) | (3) | (4) | (5) |
| Good faith PostGF | 0.018** | 0.020*** | 0.020*** | 0.024*** | 0.022** |
| (0.009) | (0.007) | (0.007) | (0.008) | (0.010) | |
| Good faith active (neighboring state) | −0.009 | ||||
| (0.008) | |||||
| Other WDLs active | Yes | Yes | Yes | Yes | Yes |
| Controls | Yes | Yes | Yes | Yes | Yes |
| Event-state fixed effects | Yes | Yes | Yes | Yes | |
| Event-state-technology fixed effects | Yes | ||||
| Event-technology-time fixed effects | Yes | Yes | Yes | Yes | Yes |
| Event-region-time fixed effects | Yes | Yes | Yes | Yes | Yes |
| Event-inventor-firm fixed effects | Yes | Yes | Yes | Yes | Yes |
| Number of events | 6 | 7 | 7 | 7 | 7 |
| Number of states | 42 | 43 | 43 | 43 | 43 |
| Number of inventors | 42,615 | 78,886 | 81,208 | 81,211 | 81,211 |
| Number of observations | 605,565 | 1,184,703 | 1,235,454 | 1,235,472 | 1,235,472 |
Notes. This table presents stacked DiD results from OLS regressions examining the effect of the good faith exception on inventors’ reliance on their employers’ prior technologies. Column (1) excludes patents filed after 1990. Column (2) excludes patents filed in the NBER technological subcategory 46, which covers patents related to semiconductor devices. Column (3) includes event-specific state-technology paired fixed effects, which absorb time-invariant heterogeneity specific to state-technology pairs within each event window. Column (4) includes an additional control variable for whether a neighboring state (adjacent to the inventor’s state of residence) has adopted the good faith exception at the time of the patent application. Column (5) examines the share of firm references weighted by text-based similarity scores. The unit of observation is the inventor–patent. Robust standard errors are clustered by state (reported in parentheses). Other WDLs refers to the implied contract and public policy exceptions. Control variables and variable definitions are provided in Table 1. Number of events refers to the unique number of adoption events in the sample. Number of states refers to the unique number of states in the sample. Number of inventors refers to the unique number of inventors in the sample. Number of observations refers to the total number of inventor–patent observations in the sample.
*; **; ***.
First, Hall (2004) documents an explosive growth in patenting after 1990, particularly in industries that had not previously relied heavily on patents as an appropriability mechanism. If geographic specialization across industries is important, this trend could differentially affect our measure of firm-specific innovations across states. In column (1) of Table 4, we restrict the sample to the period from 1975 to 1990. The estimated treatment effect remains positive and statistically significant. In column (2), we exclude inventor–patent observations in the semiconductor industry, which experienced especially rapid patent growth during the sample period and accounts for a substantial share of U.S. patenting activity (Hall and Ziedonis 2001). Specifically, we exclude patents classified in NBER technology subcategory 46. The estimated coefficient remains similar in magnitude and statistically significant, suggesting that our results are not driven by developments in this sector.12 In column (3), we further account for heterogeneity in innovation regimes across state–technology combinations by including event–state–technology fixed effects. These fixed effects absorb all time-invariant differences in patenting intensity and innovation practices specific to a given state–technology pair within each stacked event window. The estimated treatment effect remains positive and statistically significant, indicating that our results are unlikely to be driven by persistent differences in state–technology innovation regimes.13
Second, Autor et al. (2004) observe that Southern states were slower to adopt the good faith exception and also experienced slower employment growth, whereas adoption was particularly prevalent in the Western states. To account for such regional differences, our baseline specification includes event-specific regional trends. In addition, column (4) of Table 4 includes an indicator for whether the good faith exception was active in a neighboring state. The coefficient on the neighboring state’s good faith exception is small and statistically insignificant, whereas the estimated treatment effect for the inventor’s own state remains positive and statistically significant. These findings suggest that regional economic conditions and spillovers are unlikely to explain our results.
4.2.2. Alternative (Text-Based) Measure for the Use of Firm-Specific Technologies.
We also assess the sensitivity of our results to the measure of inventors’ firm-specific innovations. Whereas the share of firm references is widely used in innovation studies for this purpose, concerns remain about the extent to which patent citations accurately capture knowledge flows (Kuhn et al. 2020, Whalen et al. 2020). For instance, Kuhn et al. (2020) highlight the increasing inclusion of potentially irrelevant references in patents over time. To address potential noise arising from this issue, we construct an alternative measure based on the text similarity between a patent and the firm-owned patents it cites. Text similarity between patent documents serves as a proxy for the technological proximity of the underlying innovations.
Specifically, following Whalen et al. (2020), we compute cosine similarity between vectorized representations of patent texts and use these similarity scores as weights on cited patents. Firm references that are more textually similar to the focal patent, therefore, receive greater weight. The resulting similarity-weighted share of firm references captures the extent to which cited firm-owned prior art is technologically proximate to the focal invention rather than more distant or generic. Accordingly, in column (5) of Table 4, we use this similarity-weighted share of firm references as an alternative dependent variable. The estimated treatment coefficient remains qualitatively similar to our baseline results, indicating that measurement error in patent citations is unlikely to drive our findings.
4.3. Evidence of the Mechanism
4.3.1. Employment Protection and Inventor Turnover.
To provide evidence that the effect of increased employment protection on inventor behavior operates through enhanced job security, we examine whether the adoption of the good faith exception leads to meaningful increases in job stability. Our analysis hinges on the premise that this legal shift extends expected employment duration, thereby strengthening the incentives for inventors to invest in firm-specific human capital. Whereas prior work indicates that the employment effects of the good faith exception are heterogeneous, they are most likely to take place in high-skill employment relationships characterized by idiosyncratic investments (MacLeod and Nakavachara 2007). As inventors exemplify this high-skill labor category, a reduction in their turnover serves as an indicator that the job security mechanism is active in our empirical setting.
In column (1) of Table 5, we estimate the impact of the good faith exception on inventor turnover. Following established approaches in the innovation literature (e.g., Marx et al. 2009, Melero et al. 2020), we identify turnover based on the assignment patterns of successive patents by an inventor, focusing on changes in the firms to which patents are assigned. Whereas we cannot distinguish between the effects of the good faith exception on voluntary and involuntary turnover, we find that its adoption leads to a 5.1-percentage-point decrease in overall separation, corresponding to a 30.7% reduction relative to the sample mean. This indicates that the legal change translates into a substantial increase in expected job stability for inventors, thereby providing an empirical foundation for our main argument: that longer expected horizons enable a shift toward investing in firm-specific technological knowledge.
|
Table 5. Effect of the Good Faith Exception on the Types of Innovations Developed by Inventors: Evidence on the Mechanism
| Dependent variable | Turnover | Share firm refs | Share firm refs |
|---|---|---|---|
| Estimation: OLS | (1) | (2) | (3) |
| Good faith PostGF | −0.051*** | ||
| (0.014) | |||
| Good faith PostGF 1(young inventors) | 0.082** | ||
| (0.039) | |||
| Good faith PostGF 1(old inventors) | 0.004 | ||
| (0.013) | |||
| Good faith PostGF 1(star inventors) | 0.008 | ||
| (0.035) | |||
| Good faith PostGF 1(nonstar inventors) | 0.026*** | ||
| (0.008) | |||
| Difference (young versus old inventors) | F4.58 | ||
| (p0.04) | |||
| Difference (star versus nonstar inventors) | F0.22 | ||
| (p0.64) | |||
| Other WDLs active | Yes | Yes | Yes |
| Controls | Yes | Yes | Yes |
| Event-state fixed effects | Yes | Yes | Yes |
| Event-technology-time fixed effects | Yes | Yes | Yes |
| Event-region-time fixed effects | Yes | Yes | Yes |
| Event-inventor-firm fixed effects | Yes | Yes | Yes |
| Number of events | 7 | 7 | 7 |
| Number of states | 43 | 43 | 43 |
| Number of inventors | 81,211 | 40,727 | 80,970 |
| Number of observations | 1,235,472 | 532,873 | 1,194,312 |
Notes. This table presents stacked DiD results from OLS regressions examining the effect of the good faith exception on inventor turnover and inventors’ reliance on their employers’ prior technologies across inventor age and star status. Column (1) examines the likelihood of inventor turnover. Column (2) defines young (old) inventors as those in the top (bottom) quartile based on their birth year. Column (3) defines star (nonstar) inventors as those in the top 10% (bottom 90%) based on their total number of citations received in the pre-event period. The unit of observation is the inventor–patent. Robust standard errors are clustered by state (reported in parentheses). Other WDLs refers to the implied contract and public policy exceptions. Control variables and variable definitions are provided in Table 1. Number of events refers to the unique number of adoption events in the sample. Number of states refers to the unique number of states in the sample. Number of inventors refers to the unique number of inventors in the sample. Number of observations refers to the total number of inventor–patent observations in the sample.
*; **; ***.
4.3.2. Heterogeneity Across Inventors with Different Career Concerns.
To further examine whether increased job security influences inventors’ incentives to allocate effort toward firm-specific human capital, we explore heterogeneity in our results across inventors with different levels of career concerns. Because employment protection increases expected tenure, its impact on incentives should be particularly pronounced for inventors whose career concerns make them more sensitive to job loss. If the observed rise in reliance on firm-specific technological knowledge reflects a reallocation of inventive effort induced by job security, the good faith exception should have a larger impact on these inventors.
We use two proxies to capture differences in career concerns among inventors. The first proxy is the inventor’s age. Evidence from specialized labor markets, such as mutual fund managers (Chevalier and Ellison 1999), suggests that younger employees are more likely to face termination than their older counterparts. In addition, younger employees’ promotion prospects are more adversely affected by poor performance outcomes resulting from bold actions. Consequently, career concerns are likely to be stronger for younger inventors, and the impact of increased employment protection should be more pronounced for them. Following Baginski et al. (2018), we classify inventors in the top quartile of age as old inventors and those in the bottom quartile as young inventors, using inventor birth year data from Kaltenberg et al. (2023).
The second proxy is whether the inventor is a star inventor. The career concerns of star and nonstar inventors differ systematically. Compared with nonstar inventors, star inventors contribute more to innovation success and firm performance, exert greater control over research resources, and generate knowledge spillovers to peers (Zucker et al. 1998, Azoulay et al. 2010). They are also more attractive to other firms, which gives them broader external job opportunities (Ganco et al. 2015). As a result, increased employment protection is likely less relevant for their career concerns. We define nonstar (star) inventors as those in the bottom 90% (top 10%) of the citation distribution in the five years preceding the adoption of the good faith exception (see, e.g., Tandon and Toh 2022).
Columns (2) and (3) of Table 5 present the results of this test. We augment our preferred specification with interactions between the good faith treatment indicator and variables representing inventors with different career concerns. As expected, the effect of the good faith exception on reliance on firm-specific technological knowledge is concentrated among younger and nonstar inventors. The treatment coefficient for young inventors is positive and larger than the corresponding estimate for the full sample, whereas the estimated effect for inventors nearing retirement is small.14 A similar pattern holds when comparing star versus nonstar inventors, with the estimated effect concentrated among nonstar inventors. These heterogeneity patterns are consistent with the proposed mechanism: increased job security raises expected tenure and thereby reallocates inventive effort toward firm-specific technological domains, particularly among inventors for whom career concerns are most salient.
4.4. Addressing Alternative Explanations
4.4.1. Firms’ Reaction to the Increase in Labor Adjustment Costs and Litigation Risks.
Our findings suggest that increased employment protection encourages inventors to deepen their mastery of firm-specific technologies. Alternatively, because employment protection raises labor adjustment costs (Autor et al. 2007, Bena et al. 2022), firms might proactively concentrate investment in existing technologies, curtailing riskier, novel R&D (Griffith and Macartney 2014). To assess whether such firm-level responses could be driving our results, we exploit the fact that approximately 38% of inventors in our sample are employed in states other than their firm’s HQ.15 Because geographic distance may limit firms’ ability to monitor and direct detailed R&D practices, inventors located outside HQ are plausibly less exposed to centralized innovation policy (Glaeser et al. 2023).
We first compare inventors working in the firm’s HQ state with those located elsewhere. Our treatment indicator corresponds to activation of the good faith exception in the inventor’s state of employment. If our main results were driven by centralized firm-level responses to adjustment costs, the effect should be most pronounced for HQ-based inventors, who are most directly subject to corporate-wide innovation mandates (Bena et al. 2022). In contrast, if the mechanism operates through inventor-level job security, the effect should be stronger among non-HQ inventors, whose greater autonomy allows for more significant behavioral adjustments (Glaeser et al. 2023). As shown in Table 6, column (1), the effect is large and statistically significant for inventors located outside the HQ state but small and insignificant for those in the HQ state.
|
Table 6. Effect of the Good Faith Exception on the Types of Innovations Developed by Inventors: Alternative Explanations
| Dependent variable | Share firm refs | Share firm refs | Share firm refs | Ln (1+Coinventors) | Ln(1+New coinventors) | Ln(1+No. of patents) |
|---|---|---|---|---|---|---|
| Sample | All | Non-HQ inventors | Non-HQ inventors | All | All | All (inventor- year level) |
| Estimation: OLS | (1) | (2) | (3) | (4) | (5) | (6) |
| Good faith PostGF 1(HQ inventors) | 0.008 | |||||
| (0.014) | ||||||
| Good faith PostGF 1(Non-HQ inventors) | 0.069*** | |||||
| (0.024) | ||||||
| Good faith PostGF | 0.069*** | 0.071*** | 0.005 | −0.014 | −0.026 | |
| (0.021) | (0.021) | (0.016) | (0.016) | (0.017) | ||
| Good faith active (HQ state) | 0.012 | |||||
| (0.013) | ||||||
| Difference (HQ versus non-HQ inventors) | F6.35 | |||||
| (p0.02) | ||||||
| Other WDLs active | Yes | Yes | Yes | Yes | Yes | Yes |
| Controls | Yes | Yes | Yes | Yes | Yes | Yes |
| Event-state fixed effects | Yes | Yes | Yes | Yes | Yes | Yes |
| Event-technology-time fixed effects | Yes | Yes | Yes | Yes | Yes | Yes |
| Event-region-time fixed effects | Yes | Yes | Yes | Yes | Yes | Yes |
| Event-inventor-firm fixed effects | Yes | Yes | Yes | Yes | Yes | Yes |
| Number of events | 7 | 7 | 7 | 7 | 7 | 7 |
| Number of states | 43 | 43 | 43 | 43 | 43 | 43 |
| Number of inventors | 77,442 | 31,428 | 31,428 | 81,211 | 81,211 | 68,608 |
| Number of observations | 1,164,048 | 430,888 | 430,888 | 1,235,472 | 1,235,472 | 686,240 |
Notes. This table presents stacked DiD results from OLS regressions examining the effect of the good faith exception on inventors’ reliance on their employers’ prior technologies, inventors’ collaboration patterns, and inventors’ productivity. In column (1), HQ (non-HQ) inventors are defined as those whose state of residence is the same as (different from) the state of the assignee. Column (2) restricts the sample to inventors whose state of residence differs from the state of the assignee. Column (3) repeats the specification from column (2) with an additional control variable for whether the assignee's HQ state had adopted the good faith exception at the time of the patent application. Columns (4) and (5) present the number of coinventors and the number of new coinventors, respectively, as outcomes of interest. Column (6) presents the annual number of patent applications filed by an inventor as the dependent variable. The unit of observation is the inventor–patent in columns (1)–(5) and the inventor–year in column (6). Robust standard errors are clustered by state (reported in parentheses). Other WDLs refers to the implied contract and public policy exceptions. Control variables and variable definitions are provided in Table 1. Number of events refers to the unique number of adoption events in the sample. Number of states refers to the unique number of states in the sample. Number of inventors refers to the unique number of inventors in the sample. Number of observations refers to the total number of inventor–patent observations in columns (1)–(5) and inventor–year observations in column (6).
*; **; ***.
We next focus exclusively on the subsample of non-HQ inventors. Column (2) replicates our main findings for this group. In column (3), we augment this specification with an indicator for whether the good faith exception is active in the firm’s HQ state. If centralized firm-level decision making were driving the results, this variable should carry some explanatory power. Instead, its coefficient is small and statistically insignificant, whereas the effect of the law in the inventor’s state of employment remains robust.
Finally, we address the possibility that WDLs represent an increase in labor litigation risk that leads firms to pursue derisking strategies. If the shift toward greater reliance on firm-specific technologies reflected firm-level retrenchment, the effects should be strongest among financially constrained firms, which are more sensitive to risk-induced cost shocks (Campello et al. 2010). Using standard measures of financial constraints measured prior to adoption (Almeida et al. 2004, Hadlock and Pierce 2010), we find no evidence supporting this interpretation (Online Table A.4). If anything, the effects are more pronounced among financially unconstrained firms. This pattern is consistent with our proposed mechanism: inventors respond most strongly to employment protection when the firm’s long-term stability and, thus, the expected return on firm-specific investment is highest. Overall, whereas we cannot fully rule out concurrent firm-level adjustments, the evidence in this section strongly supports the individual-level human capital mechanism as the predominant driver of our findings.
4.4.2. Changes in Collaboration Patterns and Innovation Effort.
We next examine whether our findings reflect, as theorized, inventors’ individual decisions to reallocate learning efforts toward firm-specific technological knowledge or whether they instead reflect changes in inventors’ collaboration behavior or overall innovation effort. Stronger employment protection may reduce inventor turnover and thereby limit the arrival of new collaborators within the firm. A reduced inflow of new colleagues could mechanically constrain exposure to external knowledge and increase reliance on internal technologies. If this mechanism were driving our results rather than a deliberate reallocation of inventors’ learning efforts toward firm-specific technologies, we would expect to observe declines in both the total number of collaborators and, in particular, the number of new collaborators. Columns (4) and (5) of Table 6 report the estimated effects of the good faith exception on the total number of coinventors and the number of new coinventors. The treatment coefficients are small and statistically insignificant in both cases, indicating that changes in collaboration patterns do not explain the observed increase in reliance on firm-specific technological knowledge.
We also investigate whether employment protection affects overall innovation effort. Prior work suggests that employment protection may either increase inventive effort by mitigating holdup problems (Acharya et al. 2014, Ekinci and Wehrheim 2024) or dampen effort by raising the cost of disciplining shirkers (Bradley et al. 2017, Francis et al. 2018). If such effort-based effects were operative in our setting, the increased reliance on firm-specific technological knowledge could reflect changes in innovation intensity rather than a reallocation of learning effort across technologies.
To assess this possibility, we aggregate the data to the inventor–year level and examine the impact of stronger job security on annual patent output.16 Column (6) of Table 6 shows that the estimated treatment effect is small and statistically insignificant, indicating no meaningful change in overall patenting. This result suggests that employment protection affects the direction rather than the intensity of inventive activity, consistent with a reallocation of effort toward firm-specific technological knowledge.17 Finally, Online Table A.5 examines additional citation-based measures of knowledge acquisition. Whereas backward citations to firm-owned patents increase following adoption, the total number of backward citations remains unchanged. This pattern also indicates a reallocation of effort toward firm-specific knowledge rather than a change in overall knowledge-search intensity. We also find that inventors place greater weight on high-quality firm references with no equivalent change in the quality of nonfirm references.
4.5. Innovation Novelty and Breakthrough Potential
Consistent with human capital theory, our results suggest that increased job security motivates inventors to allocate effort toward firm-specific human capital, reflected in a greater reliance on the organization’s internal technological knowledge base. At the same time, the innovation literature predicts that such a shift in incentives may lead to less novel technological advances as a stronger emphasis on firm-specific technological domains can result in increased local search and reduced exposure to diverse knowledge inputs (Ahuja and Lampert 2001, Rosenkopf and Nerkar 2001, Phene et al. 2006). This inward-looking search behavior may lead inventors to focus on incremental innovations that refine and extend the firm’s existing technological paradigm, overlooking more distant external knowledge. Because exposure to diverse knowledge sources is a key driver of novelty and breakthrough innovation (Fleming 2001), this reallocation of inventive effort may ultimately limit inventors’ capacity to generate radical and highly impactful technological advances.
To explore the implications of this mechanism for technological newness, we analyze the impact of job security on several widely used patent-level indicators of novelty. We begin by examining innovation disruptiveness, using the CD index and its extended version, the magnitude-weighted mCD index, as proposed by Funk and Owen-Smith (2017). These citation-based measures assess the extent to which an innovation disrupts a technological field by becoming a highly influential advance that renders prior knowledge less relevant. As Funk and Owen-Smith (2017) explain, the CD index captures the direction of a patent’s impact—whether it consolidates or destabilizes the existing technological trajectory—whereas the mCD index incorporates both the direction and magnitude of that impact (see also Azoulay et al. 2019). Columns (1) and (2) of Table 7 present the results, indicating that adoption of the good faith exception significantly reduces innovation disruptiveness. For example, column (1) shows that the CD index declines by 0.02 units, corresponding to a decrease of approximately 0.07 standard deviations.18
|
Table 7. Effects of the Good Faith Exception on Innovation Novelty, Breakthrough, and Value
| Dependent variable | CD index | mCD index | Text novelty | Top 5% cites | Ln(Patent value) | Patent renewal |
|---|---|---|---|---|---|---|
| Estimation: OLS | (1) | (2) | (3) | (4) | (5) | (6) |
| Good faith PostGF | −0.020** | −0.293** | −0.070** | −0.016*** | 0.093** | 0.045* |
| (0.008) | (0.143) | (0.029) | (0.004) | (0.036) | (0.022) | |
| Other WDLs active | Yes | Yes | Yes | Yes | Yes | Yes |
| Controls | Yes | Yes | Yes | Yes | Yes | Yes |
| Event-state fixed effects | Yes | Yes | Yes | Yes | Yes | Yes |
| Event-technology-time fixed effects | Yes | Yes | Yes | Yes | Yes | Yes |
| Event-region-time fixed effects | Yes | Yes | Yes | Yes | Yes | Yes |
| Event-inventor-firm fixed effects | Yes | Yes | Yes | Yes | Yes | Yes |
| Number of events | 7 | 7 | 7 | 7 | 7 | 7 |
| Number of states | 43 | 43 | 43 | 43 | 43 | 43 |
| Number of inventors | 81,211 | 81,211 | 81,211 | 81,211 | 81,211 | 81,211 |
| Number of observations | 1,235,472 | 1,235,472 | 1,235,472 | 1,235,472 | 1,235,472 | 1,235,472 |
Notes. This table presents stacked DiD results from OLS regressions examining the effects of the good faith exception on innovation novelty and value outcomes. Columns (1) and (2) report the effect on the disruptive potential of the innovation. Column (3) reports the effect on innovation novelty based on text analysis. Column (4) reports the effect on the breakthrough potential of the innovation. Column (5) reports the effect on the private value of the innovation to the patent holder, measured through stock price reactions to patent issuance. Column (6) reports the effect on patent renewal. The unit of observation is the inventor–patent. Robust standard errors are clustered by state (reported in parentheses). Other WDLs refers to the implied contract and public policy exceptions. Control variables and variable definitions are provided in Table 1. Number of events refers to the unique number of adoption events in the sample. Number of states refers to the unique number of states in the sample. Number of inventors refers to the unique number of inventors in the sample. Number of observations refers to the total number of inventor–patent observations in the sample.
*; **; ***.
Next, we rely on natural language processing techniques to assess innovation novelty based on patent text. Following Arts et al. (2021) and Kalyani (2024), we measure novelty using the share of two-word combinations (bigrams) that appear for the first time in the title, abstract, description, or claims of a patent. This measure captures the extent to which an innovation introduces novel conceptual elements and distinguishes more groundbreaking patents from more derivative ones. Column (3) of Table 7 reports results consistent with the disruptiveness analysis: adoption of the good faith exception leads inventors to produce innovations that are significantly less novel. Specifically, the estimated treatment effect implies a reduction in text novelty of 0.07 units, corresponding to a decrease of approximately 0.08 standard deviations.
Finally, we examine whether adoption of the good faith exception affects the likelihood of generating breakthrough innovations. Following prior research, we define breakthrough patents as those in the top 5% of the distribution of citations received from subsequent patents. Specifically, we construct an indicator equal to one if a patent ranks in the top 5% of patents filed in the same year and technological class (Ahuja and Lampert 2001, Phene et al. 2006). Column (4) of Table 7 presents the results. We again observe a negative and statistically significant effect: the likelihood of generating a breakthrough innovation is 1.6 percentage points lower for inventors experiencing increased job security, corresponding to a 21.9% decline relative to the sample mean. Taken together, the results in this section indicate that greater reliance on inventors’ firm-specific technological knowledge is associated with a systematic decline in the novelty and breakthrough potential of their innovations, consistent with predictions from the innovation and organizational learning literatures and with the exploration–exploitation trade-off highlighted in our theoretical framework.
4.6. Value of the Innovation to the Focal Firm
To further evaluate the economic implications of the firm-specific human capital mechanism, we examine how increased job security for employee inventors affects the value of their innovations to their employers. Our analysis does not yield an unambiguous prediction for this outcome. On the one hand, human capital theory suggests that greater job security mitigates the holdup problem, encouraging employees to make efficient firm-specific investments that enhance firm performance (Wasmer 2006, MacLeod and Nakavachara 2007). In the context of R&D, such investments should lead to innovations that are particularly valuable to employers as inventors allocate effort toward firm-specific human capital and exploit complementarities within the firm’s existing technological base. From this perspective, adoption of the good faith exception may increase the private, firm-specific value of innovations by better aligning them with the firm’s resources and capabilities.
On the other hand, the innovation and organizational learning literatures emphasize that firms often exhibit an inherent tendency toward exploiting their own technologies (Levinthal and March 1993). Absent countervailing incentives, this tendency can lead to excessive local search and reduced innovative performance (Ahuja and Lampert 2001, Rosenkopf and Nerkar 2001, O’Reilly and Tushman 2013). In this equilibrium context, firms typically design incentive structures that balance inventors’ incentives to invest in both firm-specific and general technologies. An exogenous increase in job security may, therefore, disrupt this balance, inducing an inefficiently high level of exploitation of firm-specific technologies and potentially reducing the value of the resulting innovations. Which of these forces dominates is ultimately an empirical question.
To address this question, we capture the private economic value of innovations to the focal firm using the stock market–based patent value measure proposed by Kogan et al. (2017) based on stock price movements following patent grants. As the authors note, this measure leverages the forward-looking nature of stock prices to estimate the private value of patented innovations to their holders based on ex ante information. Whereas other patent-based measures, such as citation counts, reflect broader technological or social value, this approach is designed to capture the private economic value of patented innovations to their owners. As emphasized by Farre-Mensa et al. (2020), stock market–based patent value measures incorporate not only the inventive component of an innovation but also its legal and strategic components, including the value of exclusionary patent rights.
Although the Kogan et al. (2017) measure is widely used in related studies, a concern is that it is inherently noisy at the individual patent level (Krieger et al. 2024, Arora et al. 2026). Beyond the strong distributional assumptions underlying its estimation, the measure is inferred from abnormal firm-day stock returns, which may reflect other contemporaneous firm-specific information in addition to the value of patent grants. More generally, stock market indicators of innovation value based on abnormal returns may be subject to evaluator bias if investors tend to overlook the value generated by exploitative innovations as suggested by Fitzgerald et al. (2021). To address these concerns, we complement the Kogan et al. (2017) measure with information from patent renewal decisions. Renewal decisions involve real economic costs and, therefore, reflect patentees’ private assessments of whether expected private returns exceed the costs of maintaining a patent (Schankerman 1998, Serrano 2010).19
Columns (5) and (6) of Table 7 show that increased job security for inventors leads, on average, to the development of innovations with higher private economic value for the focal firm. The estimated treatment effects imply that adoption of the good faith exception increases the stock market–based value of patents by approximately 9.3% and raises the likelihood of patent renewal by 4.5 percentage points, corresponding to an increase of about 9.6% relative to the mean renewal rate. These results are consistent with human capital theory, which predicts that increased expected tenure encourages efficient firm-specific human capital investments that firms might otherwise find too costly to incentivize because of the holdup problem.20
5. Discussion and Conclusion
This article examines the impact of job security on inventor behavior. We argue that increased employment protection alters the incentive structure for human capital investment, driving inventors to deepen their mastery of firm-specific technologies. This behavioral shift, particularly prevalent in the context of private-sector employee inventors, reveals what we term the job security paradox: whereas job security provides the safety to fail that should encourage technological exploration (Azoulay et al. 2011, Manso 2011), it concurrently increases the expected returns to firm-specific human capital investments in ways that favor exploitation over novelty.
Exploiting the staggered adoption of the good faith exception to employment at will across U.S. states between 1980 and 1999—a period during which many industries were transitioning toward more open innovation regimes that increased the relative returns to general and transferable knowledge—we find that greater job security leads inventors to rely more heavily on their firm’s established technological base. This shift is associated with less novel innovations that, on average, generate greater private economic value for employers. Our supplementary analyses reinforce the interpretation that these patterns reflect inventors’ behavioral responses to enhanced job security rather than shifts in firm-level innovation policy. Moreover, whereas changes in inventive output could, in principle, reflect altered effort, we find no evidence that increased job security affects either patent productivity or the overall intensity of knowledge search. Instead, the evidence points to a reallocation of inventors’ human capital investments toward firm-specific technologies.
A key feature of our inventor-level analysis is the ability to control for firm–inventor match fixed effects. This approach allows us to examine changes in innovative behavior within employer–employee matches following increases in job security, excluding changes driven by the reallocation of inventors across firms. As such, our design isolates inventors’ direct responses to employment protection from potential composition effects, representing an important methodological advantage over prior work. At the same time, we acknowledge that focusing on inventor-level behavior necessarily provides only a partial view of the broader firm-level consequences of wrongful discharge laws.
Notwithstanding this limitation, our findings offer valuable insights for both researchers and practitioners. Whereas existing work often portrays job security as a cornerstone of human resource policies designed to motivate risk-taking and creativity (Amabile and Conti 1999, Azoulay et al. 2011, Manso 2011, Ederer and Manso 2013), our analysis highlights a more nuanced role in corporate R&D settings. Professional inventors engage in creative work that requires sustained investments in knowledge acquisition, much of which can be idiosyncratic to their employer. Consequently, the prospect of a stable employment relationship encourages inventors to deepen their knowledge of internal technological paradigms rather than explore a broader range of general technologies. Although this pattern appears economically beneficial for firms, it does not necessarily promote highly novel technological outcomes. Given the central role of a specialized R&D workforce in technological progress, future research on innovation incentives should take into account the career-driven motivations that shape inventors’ learning and search behavior.
Our findings also contribute to research on employment protection and innovation by highlighting the importance of worker-level responses. Whereas prior studies primarily examine how employment protection affects firm-level R&D decisions, we focus on how changes in job security shape inventors’ knowledge acquisition and, in turn, the nature of the innovations they produce. More generally, existing work on employment protection and innovation focuses almost exclusively on how firms respond to labor laws in their HQ state (e.g., Acharya et al. 2014, Griffith and Macartney 2014, Keum 2020, Bena et al. 2022). In contrast, our results highlight the importance of considering employee-level responses to local labor regulations.
From a managerial perspective, our study underscores the importance of tailoring innovation incentives to the specific characteristics of the R&D workforce. Unlike the general workforce, professional inventors do not choose between innovating and maintaining routine production; instead, they decide how to conduct innovation, including where to search for knowledge and which technologies to prioritize in their human capital investments. As our analysis shows, job security can meaningfully influence these choices. To effectively implement their technological strategies, firms must, therefore, ensure that employment and human resource policies for R&D workers are aligned with their broader innovation objectives.
The authors are grateful to the editor, John-Paul Ferguson, for his editorial guidance and the three anonymous reviewers for their helpful comments. The authors also thank Andrea Fosfuri, Patrick Gaulé, David Martínez Miera, Gabriel Natividad, Pablo Ruiz-Verdú, Carlos Serrano, Anna Toldrà-Simats, and participants at the SKEMA Knowledge, Technology and Organisation (KTO) Workshop (2021), Madrid Work and Organizations Workshop (2022), Université de Bordeaux Economics of Innovation Workshop (2022), Barcelona School of Economics (BSE) Summer Forum (2022), Linked Employer-Employee Data (LEED) Workshop (2022), Strategic Management Society (SMS) Annual Conference (2022), Strategy, Innovation and Entrepreneurship (SEI) Workshop (2022), ZEW–Leibniz Centre for European Economic Research Conference on the Economics of Innovation and Patenting (2022), University of Amsterdam Organizing Innovation for the Global Talent Race Workshop (2023), ESADE Workshop on Entrepreneurship and Strategy (2023), Strategy Science Annual Conference (2023) and Danish Research Unit for Industrial Dynamics (DRUID) Conference (2023) for their valuable suggestions. The paper also benefited from comments received at seminars at Universidad Carlos III de Madrid, IE Business School, Universidad de Navarra, Universitat de les Illes Balears, Copenhagen Business School, Aalborg University, University of Groningen, and Bocconi University.
1 The assumption that inventors have some leeway in how they approach their innovation problems is foundational to our analysis. Naturally, this discretion always operates within the boundaries set by the organization’s management. As we show in Section 4.4.1, our empirical results are mostly driven by inventors who work away from corporate HQ and arguably enjoy a higher degree of autonomy (Glaeser et al. 2023).
2 In principle, increased employment protection could also encourage voluntary mobility by reducing the job insecurity derived from a new employment relationship of uncertain quality. The empirical evidence presented in Section 4.3.1, however, suggests that job security leads to reduced overall inventor turnover rates.
3 We refer readers to Dertouzos and Karoly (1992), Autor (2003), Kugler and Saint-Paul (2004), Autor et al. (2006, 2007), and MacLeod and Nakavachara (2007) for detailed discussions of these laws and their economic significance as a source of exogenous variation in firing costs.
4 Although information on patent filings in the PatentsView data is, in principle, available before 1975, the data prior to that year show significant gaps, which is problematic for computing citations to prior art. Therefore, our sample starts in 1975.
5 In Online Table A.2, we show that including those four states in the analysis makes little difference to our results.
6 When we include control variables, the number of control states falls to 36 because several state-level controls (e.g., political balance) are missing for Nebraska.
7 Because the same control inventor can appear in more than one adoption event, the unique inventor count is smaller than the sum of event-level total inventors from panel C of Table 1.
8 Because our unit of observation is the inventor–patent level, prolific inventors appear more often in the sample and have a higher influence in the estimation process. In additional unreported tests, we collapse the data to the inventor–patenting year level and reestimate the baseline specification (i) without weights and (ii) weighting each inventor–year cell by its patent count. In both cases, the estimated treatment effect remains virtually unchanged.
9 An event denotes one of the seven state-level court decisions that adopted the good faith exception (see Table 1, panel C). Because the analysis follows the stacked DiD approach, each adoption is treated as its own event, and all fixed effect interactions are defined relative to that event.
10 See Online Table A.1 for the definitions of regions.
11 As shown in panel C of Table 1, the number of treated inventors differs across events. This might raise concerns that our results are driven by a single large event. To address these concerns, we reestimate our main specification from column (8) of Table 3 for each individual event and report the results in Online Table A.3. Six of the seven stand-alone events yield a positive treatment coefficient, which is statistically significant in two cases (Oklahoma and Louisiana). One event has a negative and statistically significant coefficient (Arizona). The fact that most events individually show a positive treatment coefficient helps mitigate concerns that a single event could be driving our results. Furthermore, we rerun the analysis excluding the two events with individually significant positive treatment coefficients. When we do so, the treatment coefficient remains positive and statistically significant.
12 The results are similar if, alternatively, we exclude firms classified under Standard Industrial Classification code 3674 (semiconductors and related devices).
13 In unreported analysis, we also find that the treatment effect does not differ across states with different innovation profiles, measured by technological complexity and R&D intensity.
14 The results are very similar if, instead of grouping inventors according to age, we distinguish them according to their tenure at the firm (measured with years since their first patent with the employer) or their inventive experience (measured with their number of previous patents). The effect of the good faith exception is concentrated among inventors with short tenure and low experience (those in the lowest quartile of each category), whereas the estimated effect is small and nonsignificant for inventors in the highest quartile of both categories. The difference between the two groups is statistically significant in both cases.
15 Following Acharya et al. (2014), we define HQ location based on the patent assignee’s address.
16 Following Ge et al. (2016) and Contigiani et al. (2018), we construct an inventor–year panel spanning the period between an inventor’s first and last appearance in the patent–inventor data, excluding inventors who patent in only one year.
17 A shift toward exploitation does not have a theoretically clear effect on patent counts: it may yield more incremental patents or fewer if the new technological improvements are too minor to satisfy patentability requirements. By contrast, changes in inventor effort should lead to a predictable increase or decrease in patent volume. This analysis, therefore, serves to rule out effort-based explanations rather than to test our primary mechanism.
18 For index-based measures of novelty and disruptiveness, such as the CD, mCD, and text-novelty indices, mean values are less economically interpretable than for ratio or log-transformed outcomes. We, therefore, express effect sizes in standard deviation units to facilitate the interpretation and comparison of results across different metrics.
19 Patent renewals in the United States are required at 4, 8, and 12 years. Whereas we focus on renewal decisions at 12 years, our results remain very similar when considering renewal decisions at four and eight years.
20 In Online Table A.6, we report the effect of inventors’ job security on (i) the number of forward citations received by their patents (column (7)) and (ii) an indicator equal to one if a patent receives at least one citation (column (8)). Both measures proxy for the technological prominence of patents, and the corresponding treatment coefficients are statistically insignificant. This pattern indicates that increased job security raises the private value of innovations to the firm without increasing their overall technological impact, further supporting our interpretation that the results reflect greater reliance on firm-specific technological knowledge rather than shifts in technological leadership.
References
- (2013) Labor laws and innovation. J. Law Econom. 56(4):997–1037.Crossref, Google Scholar
- (2014) Wrongful discharge laws and innovation. Rev. Financial Stud. 27(1):301–346.Crossref, Google Scholar
- (2001) Entrepreneurship in the large corporation: A longitudinal study of how established firms create breakthrough inventions. Strategic Management J. 22(6–7):521–543.Crossref, Google Scholar
- (2018) Dancing with the stars: Innovation through interactions. NBER Working Paper No. 24466, National Bureau of Economic Research, Cambridge, MA.Google Scholar
- (2012) Local R&D strategies and multilocation firms: The role of internal linkages. Management Sci. 58(4):734–753.Link, Google Scholar
- (2004) The cash flow sensitivity of cash. J. Finance 59(4):1777–1804.Crossref, Google Scholar
- (2023) Does strengthening the property rights of employee-inventors spur innovation? Empirical evidence on freedom-to-create laws passed by U.S. states. J. Law Econom. 66(2):369–408.Crossref, Google Scholar
- (1999) Changes in the work environment for creativity during downsizing. Acad. Management J. 42(6):630–640.Crossref, Google Scholar
- (2026) Revisiting stock market signals as a lens for patent valuation. Organ. Sci., ePub ahead of print June 10, https://doi.org/10.1287/orsc.2025.20570.Link, Google Scholar
- (2018) Paradise of novelty—Or loss of human capital? Exploring new fields and inventive output. Organ. Sci. 29(6):1074–1092.Link, Google Scholar
- (2015) Technology familiarity, recombinant novelty, and breakthrough invention. Indust. Corporate Change 24(6):1215–1246.Crossref, Google Scholar
- (2021) Natural language processing to identify the creation and impact of new technologies in patent text: Code, data, and new measures. Res. Policy 50(2):104144.Crossref, Google Scholar
- (2003) Outsourcing at will: The contribution of unjust dismissal doctrine to the growth of employment outsourcing. J. Labor Econom. 21(1):1–42.Crossref, Google Scholar
- (2004) The employment consequences of wrongful-discharge laws: Large, small, or none at all? Amer. Econom. Rev. 94(2):440–446.Crossref, Google Scholar
- (2006) The costs of wrongful-discharge laws. Rev. Econom. Statist. 88(2):211–231.Crossref, Google Scholar
- (2007) Does employment protection reduce productivity? Evidence from U.S. states. Econom. J. 117(521):F189–F217.Google Scholar
- (2019) Does science advance one funeral at a time? Amer. Econom. Rev. 109(8):2889–2920.Crossref, Google Scholar
- (2011) Incentives and creativity: Evidence from the academic life sciences. RAND J. Econom. 42(3):527–554.Crossref, Google Scholar
- (2010) Superstar extinction. Quart. J. Econom. 125(2):549–589.Crossref, Google Scholar
- (2018) Do career concerns affect the delay of bad news disclosure? Accounting Rev. 93(2):61–95.Crossref, Google Scholar
- (1985) Autonomy in the industrial R&D lab. Human Resource Management 24(2):129–146.Crossref, Google Scholar
- (2022) How much should we trust staggered difference-in-differences estimates? J. Financial Econom. 144(2):370–395.Crossref, Google Scholar
- (1962) Investment in human capital: A theoretical analysis. J. Political Econom. 70(5):9–49.Crossref, Google Scholar
- (2022) Shielding firm value: Employment protection and process innovation. J. Financial Econom. 146(2):637–664.Crossref, Google Scholar
- (2021) Are inventors or firms the engines of innovation? Management Sci. 67(6):3899–3920.Link, Google Scholar
- (2009) Do wrongful-discharge laws impair firm performance? J. Law Econom. 52(2):197–222.Crossref, Google Scholar
- (2015) The impact of local knowledge on banking. J. Financial Services Res. 48(1):1–20.Crossref, Google Scholar
- (2017) Do unions affect innovation? Management Sci. 63(7):2251–2271.Link, Google Scholar
- (2021) Difference-in-differences with multiple time periods. J. Econom. 225(2):200–230.Crossref, Google Scholar
- (2010) The real effects of financial constraints: Evidence from a financial crisis. J. Financial Econom. 97(3):470–487.Crossref, Google Scholar
- (2019) The effect of minimum wages on low-wage jobs. Quart. J. Econom. 134(3):1405–1454.Crossref, Google Scholar
- (1999) Career concerns of mutual fund managers. Quart. J. Econom. 114(2):389–432.Crossref, Google Scholar
- (2014) Do non-competition agreements lead firms to pursue risky R&D projects? Strategic Management J. 35(8):1230–1248.Crossref, Google Scholar
- (2018) Trade secrets and innovation: Evidence from the “inevitable disclosure” doctrine. Strategic Management J. 39(11):2921–2942.Crossref, Google Scholar
- (2020) Two-way fixed effects estimators with heterogeneous treatment effects. Amer. Econom. Rev. 110(9):2964–2996.Crossref, Google Scholar
- (1992) Labor Market Responses to Employer Liability (RAND Corporation, Santa Monica, CA).Google Scholar
- (1992) Professional construction of law: The inflated threat of wrongful discharge. Law Soc. Rev. 26(1):47–83.Crossref, Google Scholar
- (2013) Is pay for performance detrimental to innovation? Management Sci. 59(7):1496–1513.Link, Google Scholar
- (2024) Holdup, knowledge transferability, and productivity: Theory and evidence from knowledge workers. J. Indust. Econom. 72(1):193–252.Crossref, Google Scholar
- (2020) What is a patent worth? Evidence from the U.S. patent “lottery”. J. Finance 75(2):639–682.Crossref, Google Scholar
- (2021) Innovation search strategy and predictable returns. Management Sci. 67(2):1109–1137.Link, Google Scholar
- (2001) Recombinant uncertainty in technological search. Management Sci. 47(1):117–132.Link, Google Scholar
- (2018) Labor law and innovation revisited. J. Banking Finance 94:1–15.Crossref, Google Scholar
- (2017) A dynamic network measure of technological change. Management Sci. 63(3):791–817.Link, Google Scholar
- (2015) More stars stay, but the brightest ones still leave: Job hopping in the shadow of patent enforcement. Strategic Management J. 36(5):659–685.Crossref, Google Scholar
- (2011) Ties that truly bind: Noncompetition agreements, executive compensation, and firm investment. J. Law Econom. Organ. 27(2):376–425.Crossref, Google Scholar
- (2016) Engineer/scientist careers: Patents, online profiles, and misclassification bias. Strategic Management J. 37(1):232–253.Crossref, Google Scholar
- (2023) Proximity and the management of innovation. Management Sci. 69(5):3080–3099.Link, Google Scholar
- (2021) Difference-in-differences with variation in treatment timing. J. Econometrics 225(2):254–277.Crossref, Google Scholar
- (2011) Growing out of trouble? Corporate responses to liability risk. Rev. Financial Stud. 24(8):2781–2821.Crossref, Google Scholar
- (2014) Employment protection legislation, multinational firms, and innovation. Rev. Econom. Statist. 96(1):135–150.Crossref, Google Scholar
- (2010) New evidence on measuring financial constraints: Moving beyond the KZ index. Rev. Financial Stud. 23(5):1909–1940.Crossref, Google Scholar
- (2004) Exploring the patent explosion. J. Tech. Transfer 30(1):35–48.Crossref, Google Scholar
- (2001) The patent paradox revisited: An empirical study of patenting in the U.S. semiconductor industry, 1979-1995. RAND J. Econom. 32(1):101–128.Crossref, Google Scholar
- (2001) The NBER patent citation data file: Lessons, insights and methodological tools. NBER Working Paper No. 8498, National Bureau of Economic Research, Cambridge, MA.Google Scholar
- (2009) Innovative knowledge assets and economic performance: The asymmetric roles of incentives and monitoring. Acad. Management J. 52(5):919–938.Crossref, Google Scholar
- (2005) The effect of employment protection on worker effort: Absenteeism during and after probation. J. Eur. Econom. Assoc. 3(1):120–143.Crossref, Google Scholar
- (2023) Invention and the life course: Age differences in patenting. Res. Policy 52(1):104629.Crossref, Google Scholar
- (2024) The creativity decline: Evidence from U.S. patenting. Working paper, Federal Reserve Bank of St. Louis, MO.Google Scholar
- (2020) Firing costs and the decoupling of technological invention and post-invention investments. Working paper, Columbia Business School, New York.Google Scholar
- (2017) Technological innovation, resource allocation, and growth. Quart. J. Econom. 132(2):665–712.Crossref, Google Scholar
- (2024) Standing on the shoulders of science. Strategic Management J. 45(9):1670–1695.Crossref, Google Scholar
- (2004) How do firing costs affect worker flows in a world with adverse selection? J. Labor Econom. 22(3):553–584.Crossref, Google Scholar
- (2020) Patent citations reexamined. RAND J. Econom. 51(1):109–132.Crossref, Google Scholar
- (1990) Job security provisions and employment. Quart. J. Econom. 105(3):699–726.Crossref, Google Scholar
- (1993) The myopia of learning. Strategic Management J. 14(S2):95–112.Crossref, Google Scholar
- (2007) Can wrongful discharge law enhance employment? Econom. J. 117(521):F218–F278.Google Scholar
- (2011) Motivating innovation. J. Finance 66(5):1823–1860.Crossref, Google Scholar
- (1991) Exploration and exploitation in organizational learning. Organ. Sci. 2(1):71–87.Link, Google Scholar
- (2009) Mobility, skills, and the Michigan non-compete experiment. Management Sci. 55(6):875–889.Link, Google Scholar
- (2015) Regional disadvantage? Employee non-compete agreements and brain drain. Res. Policy 44(2):394–404.Crossref, Google Scholar
- (2020) The effect of patent protection on inventor mobility. Management Sci. 66(12):5485–5504.Link, Google Scholar
- (2013) Supply portfolio concentration in outsourced knowledge-based services. Organ. Sci. 24(1):262–279.Link, Google Scholar
- (2018) Patent citations—An analysis of quality differences and citing practices in hybrid corn. Management Sci. 64(4):1926–1940.Link, Google Scholar
- (2013) Organizational ambidexterity: Past, present, and future. Acad. Management Perspect. 27(4):324–338.Crossref, Google Scholar
- (2010) Markets for inventors: Learning-by-hiring as a driver of mobility. Management Sci. 56(5):881–895.Link, Google Scholar
- (2006) Breakthrough innovations in the U.S. biotechnology industry: The effects of technological space and geographic origin. Strategic Management J. 27(4):369–388.Crossref, Google Scholar
- (2001) Beyond local search: Boundary-spanning, exploration, and impact in the optical disk industry. Strategic Management J. 22(4):287–306.Crossref, Google Scholar
- (2023) What’s trending in difference-in-differences? A synthesis of the recent econometrics literature. J. Econometrics 235(2):2218–2244.Crossref, Google Scholar
- (1998) How valuable is patent protection? Estimates by technology field. RAND J. Econom. 29(1):77–107.Crossref, Google Scholar
- (2010) The dynamics of the transfer and renewal of patents. RAND J. Econom. 41(4):686–708.Crossref, Google Scholar
- (2022) Small innovators: No risk, no return. J. Accounting Econom. 74(1):101492.Crossref, Google Scholar
- (1996) The two faces of governance: Responses to legal uncertainty in U.S. firms, 1955 to 1985. Amer. Sociol. Rev. 61(5):794–811.Crossref, Google Scholar
- (2022) Who deviates? Technological opportunities, career concern, and inventor’s distant search. Strategic Management J. 43(4):724–757.Crossref, Google Scholar
- (2010) Innovative path dependence: Making sense of product and service innovation in path dependent innovation processes. Res. Policy 39(7):932–944.Crossref, Google Scholar
- (2016) Education and invention. Rev. Econom. Statist. 98(2):382–396.Crossref, Google Scholar
- (1990) Specific capital and unemployment: Measuring the costs and consequences of job loss. Carnegie-Rochester Conf. Ser. Public Policy 33:181–214.Crossref, Google Scholar
- (2006) Employee incentives to make firm-specific investments: Implications for resource-based theories of corporate diversification. Acad. Management Rev. 31(2):466–476.Crossref, Google Scholar
- (2009) Firm-specific knowledge resources and competitive advantage: The roles of economic- and relationship-based employee governance mechanisms. Strategic Management J. 30(12):1265–1285.Crossref, Google Scholar
- (2017) Firm-specific knowledge assets and employment arrangements: Evidence from CEO compensation design and CEO dismissal. Strategic Management J. 38(9):1875–1894.Crossref, Google Scholar
- (2016) Increase in takeover protection and firm knowledge accumulation strategy. Strategic Management J. 37(12):2393–2412.Crossref, Google Scholar
- (2006) General versus specific skills in labor markets with search frictions and firing costs. Amer. Econom. Rev. 96(3):811–831.Crossref, Google Scholar
- (2020) Patent similarity data and innovation metrics. J. Empirical Legal Stud. 17(3):615–639.Crossref, Google Scholar
- (2024) Stacked difference-in-differences. NBER Working Paper No. 32054, National Bureau of Economic Research, Cambridge, MA.Google Scholar
- (2025) Escaping product market rivalry through innovation. Management Sci., ePub ahead of print December 12, https://doi.org/10.1287/mnsc.2024.08304.Google Scholar
- (1998) Intellectual human capital and the birth of U.S. biotechnology enterprises. Amer. Econom. Rev. 88(1):290–306.Google Scholar
David Wehrheim is associate professor of strategic management at IESE Business School, University of Navarra. He studies how firms and inventors create, protect, and disclose innovation with a focus on how financial markets, disclosure, and competition shape firms’ innovation decisions and how patents and employment protection affect the mobility and productivity of research and development workers. He received his PhD in business economics and finance from Universidad Carlos III de Madrid.
Eduardo Melero is associate professor of management at Universidad Carlos III de Madrid. His research studies how company policies and organizational structures provide workers with the incentives and tools to innovate and progress within and across organizations. He received his PhD in management from Universitat Pompeu Fabra.
Neus Palomeras is associate professor of management at Universidad Carlos III de Madrid. Her research examines how research and development workers and knowledge flows shape corporate innovation with a particular focus on inventor interfirm mobility, the organization of research teams, technological alliances, and technology licensing. She received her PhD in management from Universitat Pompeu Fabra.

