Driving Performance via Exploration in Changing Environments: Evidence from Formula One Racing
Abstract
Until recently, scholars have customarily lumped multiple dimensions of environmental change into single constructs, and usually ascertained that the more the context changes, the more value firms derive from higher levels of exploration. In sync with more recent studies focusing on specific dimensions of change, in this paper we borrow theoretical elements from systems theory to examine the possibility that the reward to developing innovative product components may itself be eroded by implicit and yet burgeoning costs to fit the new component technology into existing architectures, thereby dampening system performance. Specifically, we theoretically assess how varying magnitudes of industry regulatory changes affect the optimum level of firm exploration, and propose—counterintuitively vis-à-vis past literature—that the more radical (i.e., competence destroying), as opposed to incremental (i.e., competence enhancing), these changes are, the more the optimum intensity of firm exploration recedes. Based on quantitative as well as qualitative empirical analyses from the Formula One racing industry, we precisely trace the observed performance outcomes back to the underlying logic of our theory, stressing that impaired capabilities to integrate the new component in the architecture redesign and time-based cognitive limitations both operate to inhibit the otherwise positive relationship between firm exploration and performance. In the end, we offer new insights to theory and practice.
Introduction
Firms’ responses to environmental changes in terms of exploration efforts are an important but still open issue in the study of strategy and organizations (Gupta et al. 2006, March 1991, Posen and Levinthal 2012, Sørensen and Stuart 2000, Tushman and Romanelli 1985). Although enhancing their exploration efforts under conditions of environmental change can allow firms to adjust to new environments more effectively (e.g., Blundell et al. 1999; Teece et al. 1997; Tushman and Anderson 1986, p. 446), it can also entail increased costs, risks, and challenges of its own that may reduce or even outweigh the benefits it brings. As an example of a typical managerial dilemma, should an industrial equipment manufacturer respond to the so called “3D printing revolution” by engineering a 3D printer system based on the most consolidated technology available, or by developing a more advanced prototype that is new to the industry? In this paper, we investigate this aspect by examining levels of optimal exploration under different magnitudes of environmental change.
Extant literature on the subject of organizational responses to environmental change has provided mixed results and a multitude of perspectives. For example, earlier studies suggest that enhanced exploration in changing environments may yield neutral (e.g., Kim and Rhee 2009), net positive (e.g., Aghion et al. 2005, Blundell et al. 1999, Geroski 1995, Jansen et al. 2006), or even negative (e.g., Posen and Levinthal 2012) effects. Tushman and Anderson (1986, p. 445) argue that as environmental changes develop from incremental to radical, firms can no longer rely on improving efficiencies by refining what they already do, but rather may have more to gain from exploring new competencies and expertise. On the other hand, Posen and Levinthal (2012) warn that this may not always be the case. They suggest instead that as environments change ever more frequently, the best value a firm can derive from exploration can actually recede, because novel know-how either fails to materialize or decays much more quickly in concert with the more frequent changes in the environment.
We develop such arguments further in this paper. Specifically, we consider the relationship between the magnitude of environmental change and the optimal exploration by the firm. Our goal is to identify the best firm strategy, under the relatively steady periods with recurrent changes of minor degree as well as the sporadic radical jolts of radical magnitude. The variation in such magnitude of environmental change is an important issue and is a common occurrence, for example, during political change, when regulatory agencies implement new industrial policies designed to shape new competitive dynamics (Stewart 2011), or when the industry is subject to more major technological shifts, which tend to be less frequent than more incremental changes (Klepper 1997). Therefore, whether the value of exploration increases in this environment—as has broadly been suggested in prior literature—or decreases, due to other as yet ill understood mechanisms, remains an open question.
In contrast to earlier literature, we focus exclusively on a specific organizational mechanism and theorize that when environmental conditions undergo shifts of increasing magnitude, greater exploration is likely to constitute a suboptimal strategy. We argue that as the magnitude of environmental changes increases from incremental toward radical (Henderson and Clark 1990), greater exploration causes more challenges in the management of interdependencies across parts of complex systems (Simon 1962) and stretches the organization’s integration capabilities (Brusoni et al. 2001, Prencipe 1997). For this reason, under radical environmental changes, increasing exploration rapidly amplifies the costs of reintegrating and managing the architecture of the very system that embeds the innovation, and in the process outweighs the conventionally anticipated benefits. Alternatively, when environmental changes are smaller, more aggressive exploration generates superior performance because the integration costs of complex systems are more likely to be manageable, and thus the net gains of exploration positive. Our analyses reveal decreasing returns to exploration due to reasons that are unrelated to the well-known exploration–exploitation trade-off (March 1991). In fact, we observe that the performance outcomes of greater exploration involving complex systems decrease on their own, regardless of the relative level of exploitation. Hence, by theoretically and empirically assessing the costs of greater exploration in terms of architectural fit, we propose and find that more radical changes cause the optimal rate of exploration to occur at ever lower, and not higher, levels of exploration.
To isolate the causal mechanisms that relate complexity and integration into an existing architecture, we use an unconventional approach by combining quantitative and qualitative empirical analyses of Formula One (F1) racing. F1 is an innovation-intensive industry where firms—teams of engineers and drivers, backed by deep-pocketed organizations and sponsors—try to beat opponents with superior car design, safety, and performance (Castellucci and Ertug 2010, Jenkins 2010). The independent governing authority FIA (Fédération Internationale de l’Automobile) imposes environmental changes by releasing, once a year, a new set of rules that define basic guidelines for technology advances in the sport, thus influencing teams’ exploration strategies and F1’s overall competitive dynamics in each racing season. In this sense, the changes in industry regulations operate exogenously to the process of firm exploration. Our 30-year panel data set, which includes detailed codifications of all F1 car blueprints (over 300 vehicles), all FIA regulations, and all racing results, permits a robust long-term quantitative analysis of the exploration–performance association, as moderated by the FIA’s regulatory changes. In turn, our qualitative assessment of technical reports provides opportunities to not only compare exploratory strategies across F1 teams, but, more importantly, also help us ascertain, through unambiguous interpretations, the underlying logics of architectural misfits between winning and losing cars and teams (for a similar example of mixed method application, see Canales 2013). Because our empirical environment involves changes that vary greatly in magnitude (despite the predictability of their frequency), it suits the specificities of our theory well, and helps redress possible confusions between conceptual domains of environmental change (McCarthy et al. 2010).
In what follows, we first provide a detailed account of the scope of our research and develop our hypotheses. We then present the setup and results of our quantitative and qualitative analyses. In the final section, we further specify the confusions noted above and identify other implications for theory and practice.
The Magnitude of Exogenous Environmental Change
Studies of firms’ responses to environmental change are neither new nor uncommon (see Bourgeois and Eisenhardt 1988, Jansen et al. 2006, Kim and Rhee 2009, among others). But our cumulative understanding is bounded by the lack of precision in the use of constructs in extant research, which limits our ability to synthesize an empirical consensus, generalize patterns across studies, or understand the causal mechanisms that drive different empirical results. McCarthy et al. (2010) warn that the multidimensional constructs representing environmental change—e.g., dynamism (Baum and Wally 2003, Davis et al. 2009, Jansen et al. 2006), turbulence (Dess and Beard 1984), clock speed (Nadkarni and Narayanan 2007a, b), and velocity (Bourgeois and Eisenhardt 1988)—inhibit our ability to comprehend its fundamental antecedents and consequences.
In line with McCarthy et al. (2010, p. 604), we tackle this issue by stressing that underlying such different terms are two conceptually distinct constructs: the rate (e.g., Child 1972, Wholey and Brittain 1989) and the magnitude (e.g., Abernathy and Clark 1985, Tushman and Anderson 1986) of change. The former represents the frequency of changes in the environment, and reflects time lags between successive shifts, whereas the latter represents the size of the discontinuity of a new (technological) paradigm (Hannan and Freeman 1977, Levins 1968). Although studies on magnitude are less common in the current literature, partly due to the difficulties of quantifying it (McCarthy et al. 2010, p. 608), there have been several insightful studies involving frequency.
Posen and Levinthal (2012) recently used a simulation model to show that when the frequency of change is extreme, firms are better off avoiding having to chase fast-moving targets; that is, more exploration does not pay off, because the more rapid decay of generated know-how decreases its expected net returns. However, frequency and magnitude represent distinct and complementary dimensions of change, so the theoretical logic serving the former does not automatically transfer to the latter. Specifically, when the frequency of change is constant (or even decreasing), the swift obsolescence of innovations—which, according to Posen and Levinthal (2012), limits the expected value of exploration—is not an issue, so that intense exploration may turn out to be the best strategic approach in such environments.
However, we posit that other distinct issues may arise, which are linked to different levels of magnitude of environmental change. In fact, although environmental changes may take place occasionally (or only once), they can still be intense enough to reshape technological standards. This distinction between frequency and magnitude matters, because as technological leadership can quickly crumble, firms may tend to continuously explore newer solutions (Tushman and Anderson 1986), but in doing so they encounter problematic misfits with the overarching platform where these new solutions should be integrated. Consider the recent evolution in data storage technologies, for instance. The Blue-ray format, since it involves a shorter laser wavelength, permits the storage of vastly greater quantities of data on a disk, promising major gains for film and video-game consumers. But concerns regarding the integration of this format with existing consoles and display sets, the availability of content, and the production tooling and systems required significantly curtailed its widely anticipated success (Yoffie and Rossano 2012).
We conceptualize the magnitude of environmental change to be either incremental or radical (Tushman and Anderson 1986, Henderson and Clark 1990) and consider how this variation affects the value of firm exploration. Tushman and Anderson (1986, p. 439) explain that when environmental changes demand incremental innovation, they are likely to be “competence enhancing,” because firms can react by exploiting the potential of their existing designs and technologies. Such incremental adaptation by firms does not draw from any dramatically new science, but rather involves firms tinkering, perhaps rather marginally, with their existing products and processes. In contrast, when changes demand radical innovation, they are likely to be “competence destroying,” because they may compel firms to rethink their entire sets of scientific, engineering, and design principles and skills (see also Henderson and Clark 1990, p. 9). Basically, the distinction between the two is one of degree, in terms of whether their adaptation to the new environment fundamentally alters the set of firm competencies and skills associated with the new technologies (Tushman and Anderson 1986, p. 442). Consequently, this variance induces important effects on an industry’s competitive dynamics; that is, whereas the former reinforces the dominance of established technologies, and so increases the competitive advantage of incumbents, the latter destroys the know-how superiority of market leaders, so decreasing their competitive advantages and opening up opportunities for new entrants (Abernathy and Clark 1985, Anand et al. 2010, Dess and Beard 1984, Ettlie et al. 1984, Henderson and Clark 1990, Tushman and Anderson 1986).
Another issue in the study of firm responses to their environments relates to the sources of environmental change, which can be diverse, ranging from institutional, technological, political, market demand, and even legal domains (March 1991, p. 71; McCarthy et al. 2010, p. 609; Tushman and Anderson 1986, p. 440). Generally speaking, the more an environmental change is exogenous (i.e., external) to the industry players, the more uncertain and unpredictable this will be to the incumbents (March 1991). Thus, radical innovations based on established proprietary know-how (e.g., the launch of the iPhone) represent industry shocks that are endogenously defined by specific organizations (i.e., Apple), whereas the emergence of new technologies with cross-industry application potentials (e.g., digital imaging during the 1990s, or 3D printing currently), or new industry regulations (e.g., policies that curb the use of refrigerant gases for air conditioning devices), represent examples of change stemming from exogenous sources.
In our model, we focus on the latter type of situation. Specifically, we examine the effects of environment changes as those triggered by a regulatory agency that, although fundamentally involved in the industry, is independent of any of its competitive actors. Conceptually, regulatory changes reflect “the change in laws and regulations that affect an industry” (McCarthy et al. 2010, p. 609) and are deemed to be “of great importance to organization scholars” (Hambrick and Abrahamson 1995, p. 1434). Regulations can involve a range of business activities, such as pricing, production methods, and technological specifications (Ashford et al. 1985), and are usually imposed by an impartial external agency, such as the state, institutions, or other industry controlling bodies (Stewart 2011). In heavily regulated industries such as pharmaceuticals, aerospace, defense, and healthcare (Ashford et al. 1985, Stewart 2011), although the regulations may reflect some general industry needs, ultimately they are enacted by authorities that are exogenous to its firms and aim broadly at matters of collective utility, such as better consumer welfare, faster competitive dynamics, greater producer safety, unified technological standards, and even enhanced ecological preservation. In the process—and the point of central relevance to our study—these policies influence firm choices about how much and in which directions they should explore and innovate (Ashford and Hall 2011, Porter 1996) so that they can comply with regulatory changes and so compete in the new environment. So our focus on regulatory changes enables us to study the optimal exploration strategies that firms engage in to respond to these environmental changes.
Exploration-Based Strategies and Firm Performance
Prior research has shown that exploration is relevant for firm performance (March 1991) because it enables firms to discover new knowledge—via learning by searching—that better fits the new environment in which they operate. Some researchers have considered exploration and exploitation as orthogonal and thus achievable simultaneously (Baum et al. 2000, Beckman 2006, Koza and Lewin 1998, Rothaermel 2001). In contrast, other studies have emphasized firms’ inability to conduct both concurrently at intensive levels due to scarcity of resources (March 1996, 2006), instead suggesting inverted-U-shaped relationships between exploration (or exploitation) and performance.1
We start from this latter notion that exploration brings benefits in a curvilinear manner (i.e., benefits first rise, then fall), but offer a distinct rationale relative to this previous literature. We stress that overexploration is linked with issues of its own, unrelated to the well-known exploration–exploitation trade-off (March 1991), and which are instead related to the challenges of fitting new components into existing and already well-integrated system architectures. Our inverted-U relationship thus reflects the logic that as firms explore increasingly more, they may not be able to benefit fully from the value and novelty of what they discover. Exploration examined at the component level overlooks cognitive complications at the system level, which firms handling complex products—e.g., those composed of various interdependent parts—must grapple with, even when their explorations yields new components that are indeed superior. Hence, we argue that, even assuming a firm can strike the right level of exploratory efforts vis-à-vis the novelty value of the components it discovers (as in the Blu-ray example), it must still grapple with the challenge of integrating those components into its complex product architecture, and this challenge varies with the extent of its exploratory efforts.
The notion of product or system architecture reflects the fact that multiple components must fit together satisfactorily to make a coherent system (Brusoni and Prencipe 2001). The distinction between the product as a whole (i.e., the system) and its parts (i.e., components) has a long history in the literature (see, among others, Alexander 1964; Henderson and Clark 1990, p. 11; Marples 1961; Simon 1962). Simon (1999, p. 16) explains that because such multiple parts can interact in nontrivial ways, the whole system takes a value that is more than the sum of the individual parts. Given the hierarchy of relations, the performance of each component element not only depends on its own inherent qualities, but also becomes a function of the output of others it connects to, such that increasing the adjustments at the component level can multiply the risk of system misfit. Thus, systems that are highly complex, i.e., where individual parts interact with multiple others,2 take significantly longer to emerge efficient through an evolutionary process (Simon 1962, 1999).
Our first hypothesis builds on the underlying logic of an inverted-U-shaped relationship as being more attuned to the problems of balancing the architecture of a system as novel component-level upgrades are introduced (Henderson and Clark 1990, Simon 1962). Conceptually, when individual components are innovated to fit a new environment more aptly, they yield performance improvements vis-à-vis the old ones. But the logic of system decomposability suggests that the concomitant risk of system misfit increases the more the new component relies on technologies far from the original design (Brusoni et al. 2001). The more distinct and specialized the novel components become, the more likely they are to distort the established homeostasis of the system as a whole, and throw the entire architecture out of balance (Simon 1962, p. 6). For example, new emissions standards may compel automakers such as Ford and General Motors (GM) to respond to new regulatory demands by developing engines with lower emissions. But, because such firms are likely to hold stronger engineering competencies associated with traditional engine designs, they may struggle to retrofit such new components to existing powertrain, axle, and wheel subsystems and so deliver consumers acceptable vehicle performance and safety. Hence, as exploration increases, it first enhances performance, but the farther from its existing know-how base a firm explores new component knowledge, the more it must rethink a complex set of component interdependencies involving the whole product system’s architectural fit, so that, beyond an optimum level, the marginal benefits of exploration will begin to decrease. We therefore propose the following:
Ceteris paribus, the performance of firms relying on complex products first increases and then decreases as exploration at the component level rises.
A subsequent question that arises is how the inverted-U relationship noted above behaves when subject to environmental change of varying magnitudes. At a base level, several prior research strands suggest that the more the environment changes, the more firms gain from further exploration (Brusoni et al. 2007, Jansen et al. 2006). However, March (1991) argues that a firm’s knowledge only creates value insofar as the environment in which it operates remains the same. Received empirical wisdom about competitive dynamics also suggests that radical change can reduce the gap between leaders and followers, making the playing field more equal, so boosting followers’ impetus to innovate (Aghion et al. 2005, Blundell et al. 1999, Geroski 1995).3 As environmental changes erode the competitive gap between players, rivalry intensifies, thus affecting rents asymmetrically—reducing preinnovation rents by more than it reduces postinnovation ones—and leading firms to innovate to escape current competition. Similarly, Tushman and Anderson (1986) argue that “incremental changes” are “competence enhancing” because they “permit firms to exploit their existing competence and expertise”; whereas “radical changes” are “competence destroying” because they “break the existing know-how base for the product class,” hence lowering barriers “for new technologies to emerge” (Abernathy and Clark 1985, pp. 445–446). Thus, incremental changes drive “orderliness and consolidation,” whereas radical ones can “alter a product class.” As a result, the former reinforces existing advantages and decreases incentives to explore, whereas the latter destroys existing advantages, and so encourages exploration (Tushman and Anderson 1986, p. 446).
In our research, we argue that most prior studies have overlooked the organizational challenges of greater exploration, particularly when it comes to issues of integrating novel components into complex systems. As changes of increasing magnitude may trigger issues that, at the margin, grow more rapidly than the benefits of exploration, it may be easy to overestimate the net gains if these issues are ignored. We consider the genesis of such organizational issues in terms of the firm’s capacity to integrate novel components into the system, given the limits on time and its cognitive capacity.
Novel components generated in response to radical environmental changes can impose exacting demands on the architecture of product systems (Henderson and Clark 1990, Brusoni et al. 2001). At a base level, environment shifts spawn crises in the internal fit between system components since they all fit the environment at distinct levels of specialization. But the system performance problem can quickly grow much more severe, depending on a firm’s capacity (or lack thereof) to integrate the system’s interrelated parts (Brusoni and Prencipe 2006). Even where interdependencies between elements are minor, once a firm extends its component technologies searches, it is likely to have to devote exponentially more time and resources to synchronize all its systems’ parts properly (Simon 1962), as the know-how needed to solve such architectural problems is often implicit and hidden across various organizational fields (Henderson and Clark 1990, Simon 1962). So when regulatory changes increase to significant levels, the costs of the information processing associated with architectural fit tend to grow considerably. This implies that beyond the skills needed to invent new components, the system integration capabilities of firms—which Prencipe (1997, p. 1261) identifies as those needed to manage their entire system’s dynamics—come to bear additional burdens. Thus, when responding to environmental changes of greater magnitude, firms that enhance their exploration levels may be challenged by the risk of system failure, even if the novel components they seek to integrate are themselves technologically superior. For this reason, we suggest that as regulatory changes impose more radical technology upgrades, the optimum level of exploration beyond what is needed for minimum compliance will tend to recede.
The constraints on time and firm’s cognitive capacity play an important role in this argument. Simon (1976) suggests that once a complex system is exposed to environmental change, the information required to coordinating and fitting the multiple parts together increases exponentially. Organizations often rely on cognitive as well as experiential frameworks (Gavetti and Levinthal 2000, p. 113) to coordinate the changing parts of complex systems. Given the radical nature of the changes in the environment, as well as in the novelty of the components, their cognitive frameworks are less likely to prove adequate to the challenge of designing a new architecture, ex ante. At the same time, in terms of their experiential frameworks, the demands on information and computation will necessitate ever more experiments if the system is to evolve more integrated, and these can subject the organization to greater risk of failure (Simon 1976). Because the integration of the system rests on the interdependencies of its parts, greater magnitudes of change make it harder to predict the net gains from component-level upgrades (Brusoni et al. 2001). At a base level, organizations tend to use simple heuristics of system architectures, which are effective tools to reduce search costs. But when regulatory changes grow in magnitude, the complexity of system architecture can increase beyond the organization’s cognitive limits, making the process of trial-and-error learning both costly and risky. In this case, the firm may become unable to foretell how well new arrangements of components will fit into a cohesive architecture. Hence, we reason that when environmental changes are increasingly more radical, the inflection point at which exploration levels are at their optimum (H1) will recede:
Ceteris paribus, the magnitude of environmental change negatively moderates the curvilinear relationship between firm exploration and performance; that is, the greater the magnitude of such change, the lower the level of exploration at which firm performance will be maximized.
Quantitative Analysis Methods
Data: Formula One Racing
We test the above hypotheses using data from Formula One racing and (as explained later) derive the underlying theoretical mechanisms driving the results by grounding a discussion of a particular F1 racing season (i.e., 2009) characterized by changes of high magnitude.
The F1 industry is made up of about a dozen firms (i.e., teams) that compete in a yearly calendar of races on different tracks around the world. Each team designs and develops a new car prototype every year, and deploys two official race drivers, some test drivers, and an additional group of up to 500 designers, mechanics, engineers, and managers. Teams race to reach the top spot in two classifications: the World Drivers’ Championship and the World Constructors’ Championship. Cars’ finishing places in each race earn the winning driver and team—and a few runners-ups—scaled numbers of points that accumulate to a final tally at the end of the season. The industry governing body, the FIA, releases yearly updates of its regulations and technical protocols for the sport, through which it indirectly controls the teams’ technological advances.4 The resources the teams outlay to align with the FIA’s regulations, as well as those used to compete in the F1 series, are mostly repaid by returns deriving from global visibility and supply and sponsorship contracts, as well as the commercialization of their innovations.
Several qualities contribute to make this the ideal setting for our study—indeed, as Gino and Pisano (2011, p. 70) state, “Racing may seem a long way from the world of business, but in fact…it represents a perfect laboratory for research.” To begin with, the context permits broad generalizability of results due to its similarities with many other well-regulated technology-based industries. For instance, firms compete based on the preemption and deployment of their best assets (i.e., technology, key employees, capitals); exogenous forces (i.e., technical regulations) are significant in inducing changes in the competitive environment; and the ensuing competitive dynamics result from the interplay between these factors. Similar effects occur across many other industries such as pharmaceuticals, aerospace, manufacturing, chemicals, electronics, agribusiness, military engineering, healthcare, etc. (Ashford et al. 1985, Stewart 2011), but unlike in F1, regulatory changes are hard to track and codify in reliable ways over time in these other environments, thus only allowing for single event or case studies (Stewart 2011). In contrast, F1 favors the combination of qualitative and quantitative analyses; that is, on the one hand, it facilitates empirical analyses that are at once robust and consistent because it offers precise metrics for regulatory changes and firm exploration, as well as for performance, which “is unambiguously measurable by lap times and race results” (Gino and Pisano 2011, p. 70), and on the other, it allows for the analysis of qualitative data that reveal the several theoretical mechanisms operating in the process with considerable precision. More importantly, F1 offers an environment where firms (i.e., teams) compete by fine-tuning the delicate integration of the complex systems represented by their race cars. This quality is very pronounced in our later analysis of their exploration choices during the 2009 season. In the words of Paddy Lowe, Mercedes F1 technical chief:
These cars are about system performance, not individual elements. It’s about how you put it all together. It’s the power unit, the efficiency of the power unit, the aerodynamics, and the manner in which they’re all put together. It’s the collective efficiency of that package from a power, aero and suspension point of view, as well as the weight point of view.
It is worth noting that various strategy scholars have recently extracted key theoretical insights from empirical studies in racing settings (e.g., Aversa et al. 2015, Bothner et al. 2007, Castellucci and Ertug 2010, Jenkins and Floyd 2001, Jenkins and Tallman 2010, Khanna et al. 2003, Ross and Sharapov 2015).
We built our entire data set from archival data. Scholars have recently cited F1 as one of the ideal research settings thanks to availability of “big data” (George et al. 2014). We examined all official FIA regulation releases to track all regulatory changes from 1981 (the year the FIA demanded all teams develop their car building skills in house, and forbade the outsourcing of chassis manufacturing) up to 2010. We followed the technological developments in each car by scrutinizing specialized press releases, scientific/quasi-scientific research articles, sports commentaries, and race reports, all of which came from known industry sources, such as Formula 1 Technical Analysis (Piola 1992–2010), The Great Encyclopedia of Formula 1 (Menard et al. 2010), Who Works in Formula One (Gregoire 1990–2010), Autosport Magazine, and the official F1 database Forix. Our final data set includes 345 team-year observations from a total of 49 racing teams over 30 years. On average, 10–15 teams (20–30 cars) competed per season. Our data set reports no missing team-year covariate values.
Measures
PerformanceWe take the best rank classification attained by either of a team’s two drivers in each race as representing the team’s performance in that race, and then average these performance scores across all races in the season, so that teams with lower averages outperform those with higher averages.5 Next, to construct a scale assigning higher values to better performers, we computed a measure for each team’s season performance by setting it as the denominator, and that of the winning team as the numerator, so that our index indicates the winner as 1 and gives all other teams values less than 1 but greater than 0. Our performance metric thus captures the average distance by which each team lags behind the winner in each season. This rank-based measure is both consistent with suggestions by industry experts we consulted and in line with prior research in race-car environments (Bothner et al. 2007, Castellucci and Ertug 2010). To be sure, we also considered alternative dependent variables (e.g., normalized team points at the end of the year), and the consistency in the results makes us confident in our metric choice.
Our independent and control variables arise from our thorough archival data codification. First, aided by a panel of industry experts, we crafted a set of coding criteria to track the 30 annual FIA regulatory changes over our study period and the associated technological updates in team cars. Three scholars who were intimately familiar with the industry processed the coding independently, and their results were then compared, yielding an interrater agreement level above 0.9. This high consistency is not surprising, as each team’s technical updates can be objectively observed via detailed car blueprints complemented by experts’ comments published in some of the archival sources listed above. The coders reviewed the few diverging values carefully and discarded those about which they could not arrive at an agreed interpretation. The coding process led to the two independent variables listed next and various control variables detailed below.
Change in Technical RegulationsThe magnitude of the environmental regulatory change reflects variations in the FIA technical rules across six core technology areas: chassis, engine, tires, mechanics, electronics, and aerodynamics. To develop this measure, the three coders analyzed every regulatory release, assigning each a value ranging from 0 (no change) to 3 (radical change) in each of these six areas. In cases where rules altered the status quo in a limited way, we assigned intermediate scores of either 1 or 2. To validate our metrics, we triangulated our scores with additional external sources, such as commentaries in the specialist press. The experts’ explanations and the emphases highlighted in technical articles helped us capture the more subtle qualities of each new rule and assess the magnitude of its influence on the cars’ architectures. Finally, we averaged the six scores to obtain a single overall rating for the magnitude of each year’s regulatory change.
Extent of Firm ExplorationWe used the same approach to gauge nonmandatory technological upgrades, i.e., those executed in addition to compliance with compulsory FIA demands, by examining the teams’ car blueprints and the technical releases published in several sources. Thus, this metric captures a team’s tendency to search for technological solutions that are more or less distant from the baseline technical setup defined by the FIA. Components based on unexplored industry-level knowledge belong to this explorative category. In this sense, ours is a measure of the level of firm exploration relative to expected baseline industry behavior. Since every team’s two cars are essentially identical—or differ only in their race setup—this variable is a team-specific measure, and its value applies to both team cars.
ControlsWe created three additional variables to control for possible alternative time-variant explanations. First, we coded teams’ decisions to replace drivers (Change Drivers) and the chief engineers (Change Engineers) for each team-year observation. For each control, the intensity of the changes took a value of 0 (no redefinition of the team), 1 (partial redefinition of the team), or 2 (full redefinition of the team). The third control, Adaptation Experience (AE), considers the impact of a team’s accumulated general proficiency and experience in technological adaptation up to season t − 1. To arrive at this measure, we first developed an index of the annual level of generic changes in each team’s car design. F1 racing teams design and manufacture their own car prototypes every year, and their architectures usually include some elements of discontinuity with respect to the prior year’s model, but this degree of dissimilarity may vary substantially across seasons. We also obtained a measure of degree of dissimilarity across subsequent prototypes (call it δtk for year t and team k) by reconstructing the history of each team’s prototype after decomposing the car into the six car architectural components listed earlier. The coders evaluated the changes to each subsequent car model in each of these areas on a scale from 0 to 3, assigning 0 for “no change,” 3 for “major discontinuity,” and intermediate values for incremental component modifications, whether they were technological fine-tunings (1) or more significant adjustments (2). They then averaged these values across the six areas to create an index of the level of adaptation in each team’s prototype car. Thus, the values of δtk represent the intensity of the changes that team k adopts between years t − 1 and t, and Adaptation Experience represents the accrued values of δtk from the team’s accumulated experience up to period t − 1.
Last, we also controlled for fixed effects. This is important because such controls adjust for the standard errors produced by repeated measures of organizations over time, as well as helping handle any time-invariant characteristics of the different racing teams. Each F1 team is likely to be associated with a specific group of organizations that share a common interest in success in the industry. Such time-invariant team-level features that may account for superior performance include budget levels, reputation, or any other general capabilities that may help attract the best human capital or other valuable tangible and intangible resources in the market. Controlling for team fixed effects is particularly effective in singling out the differential impacts of the central independent variables (Change in Technical Regulations and Extent of Firm Exploration) on performance with relatively limited confounding effects. Table 1 reports a summary of the main descriptive statistics and correlations.
|

Table 1: Means, Standard Deviations, and Correlations
| Variable | Mean | SD | (1) | (2) | (3) | (4) | (5) | (6) |
|---|---|---|---|---|---|---|---|---|
| 1. Performance | 0.37 | 0.26 | 1 | |||||
| 2. Change Drivers | 1.00 | 0.67 | −0.29 | 1 | ||||
| 3. Change Engineers | 0.62 | 0.73 | −0.04 | 0.09 | 1 | |||
| 4. Adaptation Experience | 1.40 | 0.79 | 0.24 | −0.13 | −0.05 | 1 | ||
| 5. Extent of Firm Exploration | 0.79 | 0.46 | 0.15 | −0.14 | 0.04 | −0.01 | 1 | |
| 6. Change in Technical Regulations | 0.62 | 0.45 | 0.06 | 0.02 | 0.01 | 0.04 | −0.06 | 1 |
Quantitative Analysis Results
To test H1 and H2, we defined two dynamic panel models, represented in Equations (1) and (2):
We ran these two models with a generalized method of moments (GMM) estimator (Arellano and Bond 1991, 1998).6 This option offers several attractive properties compared to canonical panel data estimation via the ordinary least squares (OLS) method. First, it allows us to account for performance trend effects (Roodman 2009b). Both the lagged value of the dependent variable and the lagged value of the fixed effects can give rise to dynamic panel biases, so OLS coefficient estimates risk being biased and inconsistent (Nickell 1981). Second, the GMM method provides a suitable set of tools to account for any endogeneity, predetermination, and reverse causality that may arise because the independent variables Change in Technical Regulations and Extent of Firm Exploration may correlate with error terms in future time periods. In fact, this estimator runs the model as a system of equations in which the variables can be instrumented with lagged variables. Thus, by adopting the conventional approach in Stata Module xtabond2 (Roodman 2009b), we modeled fixed effects and controls as exogenous, the independent variables as predetermined, and the lagged dependent variable as endogenous. Because of the large number of panels, the high resulting number of available moment conditions was a potential source of overfitting bias (Baltagi 2009), so, as Roodman (2009a, b) suggests, the number of instruments we used was consistently fewer than the number of groups.
Table 2 reports the coefficients, significance levels, and number of instruments, as well as the results of Wald, Arellano–Bond Type 1 and 2, and Sargan–Hansen tests (Roodman 2009b).7 Model 1 includes the controls. We find a positive trend in performance that is captured by the positive and significant coefficient in the lagged dependent variable, confirming the benefits of our choice of GMM estimation. In Model 2 (Equation (1)), with only the main effects, there is a positive and significant coefficient for Extent of Firm Exploration and a negative and significant one for its quadratic term (EXP)2, suggesting an inverted-U relationship, as predicted in H1. To provide stronger evidence of the inverted-U curvilinear relationship, as suggested by Lind and Mehlum (2010), we also examined whether the positions of the extremum point fall within the range of the observed data. Specifically, we first estimated the position of the extremum point (B = 1.665, p < 0.01) on EXP and its related confidence interval (CI) by using the delta method (CI, [0.989, 2.341]). Then, we verified that the confidence interval is indeed inside the data range of EXP (i.e., CI, [0.989, 2.341] ⊂ [0, 2.833]).8
|
Table 2: Results of Two-Way System GMM Blundell and Bond (1998) Model Estimation
| (1) | (2) | (3) | |
|---|---|---|---|
| Intercept | 0.231∗∗∗ (0.050) | 0.133∗ (0.052) | 0.076 (0.060) |
| Performancet−1 | 0.347∗ (0.143) | 0.285∗∗ (0.105) | 0.323∗∗ (0.103) |
| Change Drivers | −0.046 (0.028) | −0.051∗ (0.020) | −0.045∗ (0.020) |
| Change Engineers | −0.001 (0.020) | −0.002 (0.015) | −0.008 (0.014) |
| Adaptation Experience | 0.013 (0.030) | 0.032 (0.023) | 0.017 (0.024) |
| Extent of Firm Exploration | 0.174∗∗ (0.063) | 0.258∗∗∗ (0.071) | |
| (Extent of Firm Exploration)2 | −0.052∗ (0.025) | −0.056∗ (0.025) | |
| Change in Technical Regulations | 0.030 (0.028) | 0.106∗ (0.051) | |
| Firm Exploration × Change in Technical Regulations | −0.127∗ (0.052) | ||
| Firm fixed effects | Yes | Yes | Yes |
| Wald (χ2) | 35.00∗∗∗ | 52.39∗∗∗ | 112.40∗∗∗ |
| # Instruments | 6 | 18 | 22 |
| AR(1) | −2.43∗ | −2.34∗ | −2.44∗ |
| AR(2) | 1.71 | 1.58 | 1.78 |
| Sargan–Hansen | 3.53 | 10.65 | 15.53 |
Notes. N = 346. Robust standard errors are in parentheses.
∗p < 0.05; ∗∗p < 0.01; ∗∗∗p < 0.001.
In Model 3 (Equation (2)), the coefficient of the two-way interaction term between Extent of Firm Exploration and Change in Technical Regulations is negative and significant (B = −0.127, p < 0.05), suggesting support for H2. To gain further insight into the moderation effect of the curvilinear relationship in Model 3, we further conducted a graphical analysis using conventional approaches (Aiken and West 1991, Bauer and Curran 2005, Cohen et al. 1983). Figure 1 reports the fitted values (based on Model 3) of the relationship between the Extent of Firm Exploration and Performance at three representative levels of the moderator (Change in Technical Regulations)—at the mean, and at minus and at plus one standard deviation (Aiken and West 1991). The graphical analysis fully supports the effects predicted in H2. In fact, the level of performance peaks around an exploration level of about 2.1, when regulatory changes are low. In contrast, when the moderator is set one standard deviation above the mean, the value of exploration at which performance peaks is about 1; beyond this value, exploration becomes increasingly dysfunctional.9
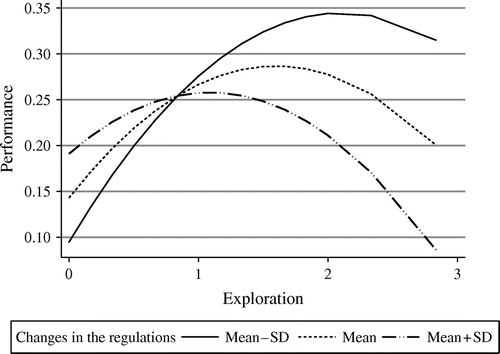
To supplement the evidence from the above graphical analysis, we proceeded as follows. We first verified that each curve in Figure 1 has indeed an inverted-U shape by applying the same test that we used to test H1 (Lind and Mehlum 2010). The results of the tests confirm that in each curve the extremum point falls within the range of EXP. We then compared the exact estimations of the extremum point positions in the curves obtained by plugging in values of Change in Technical Regulations equal to the mean minus and plus one standard deviation. The analyses confirmed and specified the insights of the graphical analysis as the former estimate (CTRmean−SD: B = 2.106, p < 0.01) resulted to be greater than the latter (CTRmean+SD: B = 1.089, p < 0.01). Finally, we performed a statistical test that rejected the hypothesis that the difference between CTRmean−SD and CTRmean+SD is null (B = 1.144, p < 0.05), thus providing full support for H2.
Essentially, our statistical results indicate that although the Extent of Firm Exploration has an inverted-U relationship with Performance, the value of exploration at which performance peaks decreases as environmental (i.e., regulatory) changes increase in magnitude (i.e., become more radical).10
Qualitative Analysis Methods
Our quantitative model above relies on precise metrics of the Magnitude of Regulatory Changes and firm strategic choices regarding the Extent of Firm Exploration and Performance, thus enabling a faithful test of the alternate logic put forth in this paper—i.e., that environment changes of high magnitude disturb the fit of system architecture, thus causing the optimum trade-off point between exploration and performance to recede. In this section, we take further steps to articulate the precise nature of this underlying logic by grounding an in-depth qualitative analysis on historical archival data that helps reveal the logical threads behind the empirical effects shown earlier. Our methodological approach is consistent with other well-known studies of organizational capabilities involving complex processes (e.g., Gavetti 2005). Following accepted practices (e.g., Eisenhardt 1989, Siggelkow 2007, Yin 2008), we select a representative season, i.e., one with a radical regulation change, and contrast its effects across multiple teams following diverse strategies (i.e., engaging in more or less extensive exploration). In this study, our specific focus is the 2009 season, and the particular radical component involved is a new energy-efficient technology known as the kinetic energy recovery system—or simply, KERS.
Industry experts agree that this season gave an acute demonstration of the different teams’ approaches to innovation vis-à-vis the changes promoted by the FIA (Aversa 2013). In the words of Sebastian Vettel, a Red Bull team driver, 2009 saw “the biggest change in history of F1,” one that he felt would “spice up the race” (AutomotiveTV.com 2009). Furthermore, the relative recentness of this season and the enormous interest it excited in the media, industry, and fans afford us access to a vast selection of secondary data. We used online (e.g., Web crawlers) and off-line (e.g., libraries, archives) search mechanisms to scan multiple sources (e.g., videos, articles, industry reports, interviews, books, audio files, pictures, and blueprints) to examine all the managerial, strategic, and competitive aspects that characterized the season, consulting over 300 documents (readily available from the authors on request), the vast majority of which are used by F1 insiders themselves (e.g., Formula1.com, BBC Sport archives, Autosport.com, FIA official regulations, Racecar Engineering, the F1 special report in the Financial Times online, etc.). Three scholars intimately familiar with F1 examined all these files independently multiple times, identifying keywords and critical interpretations, and afterward discussed the archival data together and sought a fit between their collective interpretations and information from these external sources. To strengthen the reliability of our triangulation, we followed the suggestion of Gioia et al. (2013) that one rater should act as a “devil’s advocate,” openly challenging the validity of the ideas presented by the others.
This thorough archival search helped us build a broad map of events that tracked race performance back to the challenges of fitting new technologies to the cars’ architectures, and further back to managerial choices about the extent of their teams’ explorations of the external environment. For instance, when cars failed, we searched for technical reports that provided interpretations of the causes. Thus, we were able to trace car performance and championship results against technological changes and identify the core mechanisms affecting vehicle architecture and component choices, which in turn correspond to teams’ choices about their exploration levels in that season. Because official sources often report quotes and interviews from experts and F1 professionals (e.g., drivers, managers, directors, suppliers), we were able to ground our interpretations on direct comments from the very people who lived those events. And their retrospective bias was minimized because of the temporal proximity of the circumstances—for example, the articles consulted yielded quotes from postrace press conferences, where team managers and drivers provided their immediate and impromptu interpretations of the situation. We selected a set of the most significant quotes from these protagonists, and use them to enrich our descriptive narrative of the events in the section below. We then aggregated the first-order data into broader second-order constructs that represent the central building blocks of our conceptual model on the performance effects of exploration in changing environments (see Table 3). Following accepted practices (e.g., Locke 2001, Maitlis and Lawrence 2007, Stigliani and Ravasi 2012), we summarized both first- and second-order categories and connected them to the basic interaction model that informs our quantitative analysis presented earlier.
|
Table 3: Qualitative Codification of the Model’s Variables, Mechanisms, and Effects on Performance
| Model | Second-order constructs | First-order constructs | Empirical evidence |
|---|---|---|---|
| Independent variable (main effect) | High firm exploration | KERS (Ferrari, McLaren, BMW, Renault) |
|
| Low firm exploration | Double diffuser (Brawn GP); Improved exhaust and side-pod (Red Bull) |
| |
| Independent variable (moderator) | Radical regulation change | Redefinition of the product architecture |
|
| R&D limitations |
| ||
| Underlying mechanisms | Compound effects of radical regulation change on high firm exploration | Mechanism 1: Problems in architectural redesign |
|
| Mechanism 2: Time-based cognitive limitations |
| ||
| Effects on the dependent variable | Effects on performance | Negative performance for the teams who opted for high exploration |
|
| Positive performance for the teams who opted for low exploration |
| ||
Finally, in collecting qualitative data from our panel, we interviewed external informants from very different fields (e.g., academia, F1 racing, expert media, motorsport historians, and F1 fans) to assess the face validity of the causal interpretations we offer in our theoretical model. This work involved 35 hours of interaction with a total of nine external informants, who overwhelmingly corroborated our interpretations, giving us confidence about the robustness and external validity of the theoretical inferences we present. We review the regulatory changes that affected car design in 2009, analyze how teams reacted in terms of their strategic exploration choices, and finally identify the mechanisms underlying the interactions between environmental changes and exploration as it affected team performance in the F1 championship in that season.
Qualitative Analysis Results
Following some years of relative technological stability, the FIA introduced several new rules in 2009 that affected all components of F1 race cars: engine, chassis, aerodynamics, mechanics, tires, and electronics. These diverse parts have such a symbiotic codependence that even minute changes in one (e.g., aerodynamics, engine) could affect multiple other parts (e.g., brake mechanics, weight) and have subsequent effects elsewhere (e.g., tire efficiencies), so the challenges of architectural fit are quite immense, reflecting the complex nature of the race car as a system. In addition to the challenges resulting from these mandatory technological changes, the teams had to cope with major limitations on their research and development (R&D) resources in 2009: specifically, FIA banned all in-season testing, put a strict cap on wind-tunnel simulation time, and allowed only a maximum of eight engines per driver over the season. These resource restrictions were meant to equalize the playing field and boost rivalry, but they gave F1 teams less time to study engineering specifics for the season, and so curtailed their ability to understand fully the consequences of the technological advancements outlined in the new season regulations and achieve a well-balanced car. Many teams worked around these limits by using official races to test innovations, although this approach increased their risks of failure and hit the more innovative teams especially hard.
As noted above, in addition to these requirements, the FIA’s 2009 guidelines also allowed for optional technological advancements, such as the KERS, a device that stores the kinetic energy from the waste heat created by the car’s brakes. Once converted into electrical power and stored in a dedicated battery, this energy is then made available for acceleration. Although there was an overall push in F1 toward the development of such fuel-efficient ecologically friendly technologies, this initiative also promised to increase viewer excitement as the KERS facilitates overtaking. But the FIA established very strict rules regarding its output and use, for instance, the system could only deliver a maximum of 80 extra horsepower (about 10% over current output), and was only allowed to be turned on for 6.6 seconds per lap, either in a single or in multiple short bursts. No energy recovery system had ever been adopted in F1 racing before, such that not even the FIA had been able to provide base engineering guidelines. The core concept was based on a prototypical hybrid technology, the mechanical and electric principles of which were still largely unknown in the industry; so KERS was new in absolute terms, even to the most experienced teams. The FIA allowed teams significant creative room around the KERS design and mechanics:
Unlike the engine, there is full development freedom on KERS. And like any new technology it’s only natural to expect the system to develop as you learn more about it. Every team will be updating their systems during the season.
(Paddy Lowe, McLaren Engineering Director; Formula1.com 2008)
These qualities—that it was not a requirement, that it was entirely new, and that teams were free to explore it—make the KERS a suitable illustration for studying our underlying logic. In fact, the extensive exploration of the KERS core technology and design that teams undertook in the 2009 season, along with the dramatic reduction in their analytical and R&D assets (that stressed their engineers’ cognitive limits) significantly increased the complexity of fitting and rebalancing the delicate architecture of F1 cars. In the words of industry insiders:
KERS requires a lot of fine-tuning to the car. It has to recharge itself—so when you press the brakes, it generates an extra resistance that you have to somehow compensate for to balance it out. That means interacting with the engine braking and the brake balance. You just have to find the best compromise; it’s not just installing the KERS and going quicker, you have to balance it into the whole system.
(Pedro De La Rosa, McLaren test driver; Formula1.com 2008)
KERS does require a little extra attention from the driver. And it certainly harms your weight distribution. You have less weight to play with, so set-up work becomes a little trickier.
(Christian Klien, BMW test driver; Formula1.com 2009)
In line with their continuous enthusiasm for groundbreaking innovations, all the major teams—Ferrari, BMW, Renault, Toyota, Williams, and McLaren—responded with great interest to the FIA’s suggestions about introducing the KERS, and invested considerable preseason R&D resources into testing the device (i.e., they opted for higher exploration). With the exception of Toyota and Williams, they all deployed KERS-equipped cars at the first 2009 Grand Prix, a few months later. But the FIA cap on R&D activities increased the uncertainty around the system, and turned teams’ initial enthusiasm into concerns; they actually began to wonder whether the efforts, costs, and risks involved would be sufficiently repaid by the potential benefits.
In contrast, the less explorative teams avoided the KERS altogether, explaining their decisions by pointing to the poor results from preseason tests and budget limits. Ross Brawn, the celebrated former Ferrari technical director and (from 2009) Brawn GP team principal foresaw some of the critical issues the KERS would bring in terms of its value, and the many challenges involved in debugging the car’s architectural fit:
The theoretical advantage of having KERS is perhaps 2 or 3 tenths of a second per lap (…) but you lose in terms of weight, packaging, and torsional moment at the back. In any case, there is no clear decision on KERS. I think it will take a while before we can eliminate the disadvantages. There will be a number of KERS versions, and perhaps…more versions that we haven’t thought of so far. For us the system only starts to work when we overcome the disadvantages.
(Ross Brawn, Brawn GP Technical Director; F1 Technical 2009)
Following an alternative exploration strategy, the teams that decided to forgo developing KERS (including Brawn GP and Red Bull, both new upstart teams at that time) undertook instead significant efforts to optimize existing components (i.e., they opted for less extensive exploration). For example, they both introduced aerodynamic undersides, known as double diffusers, and improved their sidepods and exhaust systems. In contrast to the KERS, these changes were considered more incremental in nature and represented relatively marginal improvements of existing components based on established field-specific knowledge, to comply with the 2009 FIA rules. Ross Brawn affirmed that the double diffuser was “an innovative approach to an existing idea,” and, despite various complaints from rival teams, the FIA declared it a “legal adaptation” (Aversa 2013, p. 16). Adrian Newey, Red Bull’s chief technical director, also opted for a moderately conservative exploration approach, as his team expressed concerns over the architectural fit costs of the KERS and suggested it was unadvisable to push exploration far beyond what the regulation required:
We have taken a clean sheet, blue-sky approach, looking at the implications of the rules and how to interpret them,…not changing things simply for the sake of it.
(Adrian Newey; Formula1.com 2009)
And indeed, Ross Brawn’s concerns materialized in the exploration-prone teams’ experiences. Even in the pretesting season, the adoption of the KERS revealed problems across interfaces with various other components. What complicated things was not merely the fact that the KERS itself was still being developed, but that the testing of its effective integration during the first (i.e., premanufacture) stages of vehicle design was limited to simple simulations. In the words of an industry insider:
The KERS is a complex system, not only technologically regarding the battery and the control system, but also regarding the logistical management of the parts, which is very complex.
(Luca Marmorini, Ferrari Powertrain Chief Engineer; Formula1.com 2011)
Because of the tightly embedded nature of the car’s multiple components, the KERS also imposed technical limitations on the evolution of the general car architecture. For example, FIA imposes minimum-weight rules for safety reasons, which in 2009 was 1,333 lbs, driver included. By locating ballast units around the car, teams could optimize the car balance taking the cars’ actual weight up to the minimum required. But the KERS added around 66 lbs of nonadjustable weight, thus raising balancing and torsional problems:
In practice, constructors build their racing cars much lighter than the regulations require, and then bring them up to the mandatory minimum by adding ballast as low down as possible, and where it will best improve the vehicle’s handling and reduce its tyre wear. That depends on the driver and the circuit. With less ballast to distribute optimally around the car, a heavier driver is already at a competitive disadvantage. Include KERS and the car could be out of the running altogether, despite having a peak power 10% more than normal. The extra weight could also rob the car of its full fuel load, forcing it to make extra pit stops during a race.
(The Economist 2009)
In subsequent phases, when drivers began testing the F1 cars, other system misfit issues arose. Because the KERS boost could only be activated in certain circumstances, it required mental as well as visual agility from drivers to track panel indicators and nuances of the racetrack itself, which did not fit every driving style, and in fact negatively impacted performance for some of them:
It’s how much I take my eyes off the track, that’s the worry. …I had headaches the first time…because you’re trying to read what the steering wheel says.
(Rubens Barrichello, Brawn GP driver; Spurgeon 2011b)
Compounding the ballast distribution problem, the KERS was hard to implement in cars with heavy drivers. Some teams that mounted the KERS forced their drivers to undergo rigid diets to address the problem of nonadjustable weight in the car architecture. But these diets impacted their physical abilities, and several of them struggled to perform during races:
F1 drivers found themselves not always in the best of health thanks to their weight loss. During the extreme heat and physical strain of some of the Formula 1 races, driver[s] can lose up to 5 kilos of weight. At the hottest early race of the season in 2009, Alonso also found himself in another very difficult situation: His water bottle broke and he had nothing to drink throughout the race. Having lost 5 kilos over the winter, then a further 5 kilos or so during the race, and without anything to drink, the Spanish driver collapsed after the race in a state of dehydration.
(Spurgeon 2011a)
With the added limitations on testing resources, teams struggled to balance their vehicles even as the season progressed. The fit difficulties also led to vehicle reliability issues that continued throughout the season, in the form of electrical shocks, batteries overheating, and even fires. In fact, the 2009 season brought an increased number of car breakdowns, especially in teams that adopted the KERS:
And as it was in an early stage of development as the season began, it was also unreliable for many teams. The Ferrari team suffered KERS breakdowns on race weekends in what became its worst season start in decades when it failed to score any points in the first three races.
(Spurgeon 2010)
Given these mounting problems, some teams took the radical step of cancelling their adoption of the KERS:
We’re keeping working on our KERS. I’m not saying we won’t run it this year but it will be difficult to run it on the car and have the car set in its optimum performance window.
(Patrick Head, Williams technical director; Formula1.com 2008)
It was not until the 2011 season that teams finally figured that an adjustable flap—the drag reduction system (DRS)—would prove to be the only way to get the best out of the KERS.
Essentially, qualitative evidence suggests that organizations are likely to find radical regulatory changes challenging, in that they magnify the need to redefine and reshape product system architecture throughout the entire product development process. For this reason, in this environment, strategies of greater exploration are likely to prove suboptimal. Based on our analysis of the qualitative evidence above, Figure 2 highlights the causal logic in this process by isolating two mechanisms that make system rebalancing a complex task: (a) novel components drastically complicate the problems of architectural design (Mechanism 1), particularly in the design and prototyping phases, and (b) organizations’ time-based cognitive limitations (Mechanism 2) can damage their ability to overcome such challenges promptly, particularly during the product’s actual life.

The performance implications arising from different exploration-based strategies corroborate our logic above. To highlight broader nuances, we consider both the Constructors’ and the Drivers’ Championships. The especially turbulent regulatory environment of the 2009 season challenged all teams and led to general decreases in car speeds compared to the previous year. And it is clear that the teams that explored farther afield (i.e., experimented with the KERS) had an even rougher year and suffered significant performance handicaps. F1 teams spent a total of US$64 million experimenting with the KERS technology in 2009, but the innovation turned out to be less effective than teams had initially hoped. In their best laps, KERS-equipped cars, although super charged with some 10% additional horsepower, gained only two- or three-tenths of a second, and saved only 0.021 liters of fuel.
But more telling are the overall performance results, when these gains are taken together with the difficulties of balancing the car architecture (brakes, ballast weight, driver fit, etc.). Published reports highlight that the teams officially regretted their decision to explore the KERS in the 2009 season. The teams who ended up with the best championship results were those who opted for standard, reliable, no-frills cars that, whereas they complied strictly with the new FIA regulations, stuck to a strategy of more moderate exploration based on technology optimization of well-established components, such as Brawn GP’s double diffuser and Red Bull’s improved sidepod and exhaust. The season ended up with a rare result in F1 history, with two young and relatively inexperienced teams winning first (Brawn GP) and second places (Red Bull) in the Constructor’s Championship, recording substantial point leads over the budget-rich and more highly innovative Ferrari, McLaren, Williams, Renault, and BMW teams. Interestingly, Ferrari (third place) and McLaren (fourth place) scored less than half of the points of the two top-ranked teams, whereas BMW (fifth place) only began earning more points toward the end of the season, when it decided to suspend the KERS project. As “rookies,” Brawn GP and Red Bull could hardly have been predicted to do so well. Brawn GP was created in 2009, from a “last-minute” management buyout of the failing Honda Racing F1 team,11 whereas Red Bull in turn emerged from the ashes of Jaguar GP, which is remembered as one of the least successful F1 ventures. In line with the constructor’s ranked results, the Driver Championship went to Jenson Button (Brawn GP), who had been a comparatively unsuccessful driver since his debut in 2000, had not won a championship before, and had only achieved mediocre results in the two previous seasons (15th in 2007 and 18th in 2008). The young and inexperienced Sebastian Vettel of Red Bull came second, whereas Rubens Barrichello (Brawn GP) and Mark Webber (Red Bull) finished third and fourth. The first top-team driver was Lewis Hamilton (fifth), who only amassed half as many points as Button. Analysts observed that the exploration of the KERS correlated negatively with race performance:
After years of domination by McLaren, Mercedes and Scuderia Ferrari, this season saw an underdog driver win a Grand Prix. It was even more surprising as it was the teams without KERS that were doing well in the championship.
(TheSportsCampus.com 2010)
The negative effects of adopting the KERS were particularly visible given the qualities of teams who lost out, but could normally have expect better results: higher budgets, better drivers, longer experience, and greater visibility, among others. In sum, we believe the KERS case offers useful theoretical insights that pinpoint the precise logical thread underlying the findings from our quantitative empirical model. When environmental changes are radical, firms are likely to have to cope with perhaps substantial problems of product architectural fit and significant cognitive limits inherent in a fiercely competitive and technologically dynamic environment involving complex systems. We find that dynamic environments can erode the rewards of intense exploratory efforts aimed at advancing technological frontiers, which suggests that careful analyses are required of how and when exploration will or will not pay off.
Although we have largely focused on illustrating a context of radical change, as our empirical model suggests, our qualitative data support the evidence that the issues that KERS adopters faced in 2009 failed to materialize in a context of limited change of the technical regulations. Take as a representative example the case of Williams’ car in 1993—a quite stable season in terms of regulations changes.
Designed by Patrick Head and Adrian Newey, Williams’ FW15C car introduced some radically innovative solutions in the 1993 F1 season, such as antilock brakes, traction control, and active suspension, together with an improved Renault engine. Official sources agree the FW15C was the most technologically sophisticated Formula One car of all time. Williams’ driver Alain Prost won the driver’s title and with 10 victories in 16 attempts, and Williams convincingly grabbed the Constructor’s Championship. The car had its debut in a year of minor regulatory changes, which did not create particular challenges in fitting the new solutions within the car architecture, which proved to be fast and reliable from the very beginning. Official sources claim the following:
Adapted to minor regulations changes, the FW15 did eventually make its competition debut at the start of the 1993 season as the FW15C. Unlike the FW14, it was designed for the latest electronic devices like the fully active suspension, so it was a much tidier package. One of the biggest tricks up the FW15C’s sleeve was the hugely sophisticated active suspension system that was developed in-house at Williams. This allowed the suspension to be continuously optimised for each section of the track. Another feature was a “push-to-pass” button, which would raise the rear ride-height and as a result reduce the drag created by the diffuser. In addition to the active suspension the 1993 Williams also featured traction control, ABS and fly-by-wire controls. …In the next years the teams tried to reintroduce many of the driver aids but the Formula 1 cars were never so comprehensively equipped as the FW15C. This makes the Renault-engined machine perhaps the most advanced Grand Prix car ever built.
(Ultimatecarpage.com)
Discussion and Conclusion
In this paper we examine the association between exploration and performance as the environment undergoes changes of varying magnitudes. Consistent with prior literature, we first propose that performance follows exploration in an inverted-U trend, i.e., it first rises to an optimum peak and then progressively drops toward a negative tendency (H1). But our theoretical logic stresses a distinct rationale vis-à-vis prior literature in that the underlying mechanism behind this well-known curvilinear relation reflects the need to ascertain an architectural reorientation of components within a complex system. Furthermore (and rather more importantly), we propose and find that environmental change—considered as industrial regulatory shifts that vary from incremental to radical (Abernathy and Clark 1985)—negatively moderates this exploration/performance relationship, such that the more radical the regulatory changes are, the lower the level of exploration that will be required to reach the peak (i.e., optimal) performance payoff (H2). We obtain empirical support for our model from a 30-year population-level panel data set from the Formula One racing industry, while we ground a qualitative case discussion on a particular race season (i.e., 2009) to unveil the underlying logic of our theory as an event of system architectural misfit.
Our study makes significant contributions to management and organization literatures. Previous studies have tended to suggest that there are positive gains to increasing exploration as environments change (Aghion et al. 2005, Blundell et al. 1999, Geroski 1995, Jansen et al. 2006). For example, Tushman and Anderson (1986, p. 445) explain that incremental environmental changes tend to lead firms to pursue lower exploration strategies because their core know-how tends to be confirmed, and they tend to reach higher efficiency levels through local learning; in contrast, radical environmental changes tend to induce firms to pursue greater exploration strategies because their core know-how tends to be destroyed. Although we agree with this line of argument regarding the benefits of greater exploration, we consider that the increased challenges implicit in achieving successful architectural fit in complex modular technological systems and the cognitive limitations involved in facing radical changes in such environments can more than offset these gains, and suggest a more circumspect enthusiasm for greater levels of explorative search. Thus, we argue that increases in the magnitude of environmental changes can require different strategies from those suggested in prior literature, such that firms may stand to gain from less, not more, exploration as the magnitude of environmental changes rises. In fact, a recent pioneering study by Posen and Levinthal (2012) has already cautioned that environmental changes do not automatically suggest strategies of greater exploration. Through an elegant modeling and simulation analysis, they demonstrate that as environments change ever more frequently, the best level of firm exploration actually recedes, given that the novelties from exploratory efforts lose value much more quickly when the environment changes constantly. We concur with them in seeing a decreasing function of exploration vis-à-vis environmental changes, rather than a generally increasing one.
But the difference between our study and those examining the frequency of environmental change (e.g., Brusoni et al. 2007, Posen and Levinthal 2012) is not merely one of domain. Earlier research has often assumed frequency to be homologous to, or even a substitute for, magnitude (McCarthy et al. 2010, p. 608). But, if assessments of the former help identify the value of exploration on the basis of how quickly the novelty of inventions erodes, we stress that analyses of the latter are needed to identify misfit in systems in their entirety. The latter argument builds on the philosophical tradition that reflects theories of complex architectures of interdependent parts (Simon 1962), in which the value of new knowledge matters less than its type. For instance, we may detect very frequent environmental changes of the incremental (i.e., competence enhancing) kind, which will relieve firms from the need to search far afield to discover new technologies. But a single (i.e., infrequent) radical change (i.e., competence destroying) may demand an exploration strategy that addresses matters beyond the quick loss of a component’s novelty and requires a thorough understanding about how quickly a firm’s system integration capabilities may reach their limits.
The two logics (i.e., whether the novelty of a component discovered via exploration dwindles more quickly versus whether the firm is less capable of integrating new components into a system with other interdependent parts) operate at separate levels and imply different logical predictions. In our specific F1 environment, regulatory changes are utterly predictable in their frequency (the FIA releases new rules every year at its preseason meeting), enabling teams to rule out unexpected technical changes and engineer new components ahead of time. But the magnitude of these changes can vary drastically, so the observed curvilinear performance value of exploration highlights a key—but so far overlooked—logical mechanism about system complexity and modular interdependence. Hence, the performance of a system may crumble even when exploration brings about superior technologies at the component level. In this regard, it is important to underline that our research further departs from Posen and Levinthal’s (2012), since whereas their simulation model considers issues linked with the search for optimal strategies in frequently changing environments, we focus on firm challenges in executing their change efforts. Hence, by discriminating between the frequency and the magnitude of environmental change, we attempt to both answer the call for greater precision in the conceptualization of environmental change (McCarthy et al. 2010, p. 604) and to extend recent propositions about the receding value of exploration in extant literature (i.e., Posen and Levinthal 2012) to new domains.
Accordingly, our study demonstrates that architectural knowledge must be considered when changes vary from incremental to radical, and so present different challenges to a firm’s know-how (Baldwin and Clark 2000, 2003; Brusoni et al. 2001; Ethiraj and Levinthal 2004). The notions of system complexity (Simon 1962) and architectural fit (Henderson and Clark 1990) shed light on various areas of management research, such as organizational form heterogeneity (Levinthal 1997, p. 935; Siggelkow and Rivkin 2005), variance in organizational evolution paths (Levinthal and Marino 2015, Siggelkow 2002), and the balance of novel and existing managerial decisions (Rivkin and Siggelkow 2003). Our study not only builds on this tradition, but in fact brings the notion of system integration capabilities (Brusoni et al. 2001, 2007; Prencipe 1997) to the study of exploration on the part of firms facing shifts of greater magnitude in their environments. This concept of capabilities gains further relevance insofar as our qualitative analysis demonstrates that they can be a decisive factor in determining how far exploration can help or hinder the performance of organizations that compete on the basis of complex systems. More generally, we warn that the relationship between exploration and performance is moderated by environmental (i.e., regulatory) changes that challenge firms to integrate new components into their complex product architectures. This warning is particularly relevant considering the tendency stressed in prior literature that firms engage in riskier exploration efforts when environmental changes make adaptation more problematic (Denrell and March 2001).
Along these lines, the competing approaches by F1 teams revealed by our 2009 season case study yield insights into the intricacies of the underlying theoretical causal mechanisms. In fact, this independent case analysis reveals that the significant perceptual challenges firms can suffer when confronted by major environmental changes are at the root of the problems of architectural fit (Gavetti and Levinthal 2000, Tripsas and Gavetti 2000). In line with our findings of an inverted-U-shaped relationship between exploration efforts and performance outcomes, there seems to be a limit to the amount of change organizations can handle, beyond which they are unable to foresee the real benefits of more exploration, or even synchronize new technologies with all the other changes that are in progress. Hence, as we integrate architectural fit and cognitive challenges, we also contribute to the literature on modularity and fit (Ethiraj and Levinthal 2004, Siggelkow 2002) by unveiling some of the underlying mechanisms that influence the interplay between contingencies and technological architectures. In fact, our analysis confirms prior findings that awareness of time and deadlines play a key role in achieving organizational goals (Gersick 1988). More precisely, our data suggest that a timely cognitive awareness of the complexity of their own product maps allowed successful F1 teams to best estimate the optimal level of exploration their development projects required. Thus, we also contribute to prior empirical literature focused on information processing as a key aspect to be considered in understanding exploration timing by providing a more specific link of between the cognitive limitations associated with intense exploration and the consequences for complex product architectures (Walsh 1988). Furthermore, our study identifies a contingency in which the reference point that serves best to identify the optimal pace of strategic change shifts from the sphere of the competitors’ action to that of the environment. Specifically, this contributes to the debate on the relative speed of change (Brown and Eisenhardt 1995, Gersick 1994, Katila and Chen 2008, Nadkarni and Narayanan 2007b) by suggesting that when environmental shifts are radical, the pace of a firm’s change may be more constrained by the internal execution of highly innovative projects than by its limited perceptions of competitors’ moves. More broadly, we also respond to the suggestion by Gavetti et al. (2007) that analyzing organizational action and dynamics requires multiple lenses that include both behavioral and cognitive perspectives.
When it comes to assessing the value of regulatory changes to spurring innovation, a growing group of strategy and management scholars (e.g., Butler and Carney 1986, Hambrick and Abrahamson 1995, Kale and Anand 2006, Porter 1996, Wiseman and Catanach 1997) have made significant contributions. We build on this tradition by offering a systematic analysis of well-codified changes in the magnitude of technological shifts. We think that a careful scrutiny of specific theory elements, rather than the all-inclusive event case study approach often adopted, may help refine many of the theories prevalent in the field. Moreover, the study of regulatory changes also implies that policy makers interested in fostering innovation (Porter 1996) should be conscious of the organizational costs associated with firms’ exploration efforts (a few are made explicit in our model), to avoid decreases (rather than the intended increases) in overall welfare for buyers and sellers. Finally, our empirical setting offers a unique opportunity to study firm behaviors under environmental changes generated exogenously by an independent authority. So our setting represents a useful laboratory in which to study these dynamics in isolation—an empirical task that can be very challenging in other industries.
Our study also suggests important implications for practice. Managers often display a bias toward action, in which they tend overwhelmingly to believe that there is an ever-increasingly positive relationship between exploration and performance gains (Peters and Waterman 1982). Organizations already accustomed to changing are more likely to change in the future (Beck et al. 2008). In our study we suggest that this approach can be mistaken, especially when environmental changes increase in magnitude. Once implicit systems-fit costs are considered, a more favorable approach to exploration may be advisable, not when the environment destroys the know-how base from which firms compete (i.e., when regulatory changes are radical), but precisely when such changes are incremental, when firms are more prone to merely refining existing know-how and confirming current competences. So managerial discretion is needed to assess not only the firm’s level of cognitive inertia (Tripsas and Gavetti 2000), but also its cognitive capacity to develop exploratory solutions to respond to radically shifting environments. Different individual approaches (i.e., of managers versus entrepreneurs) toward exploration have also been recently investigated in a series of studies that use a neuroscience lens to study systematic bias toward action (Laureiro-Martínez et al. 2014, 2015). Our analysis in the F1 industry contributes to this recent stream of research by exploring the “macrofoundations” of these mechanisms and biases.
Along those lines, our study suggests that less exploration is better in radically changing environments, and that imitation and even reverse engineering of technologies may be the best approaches where firm’s operating environments undergo changes of greater magnitude, a notion that is consistent with recent anecdotal studies praising the value of copycat strategies in turbulent environments (Jenkins 2014, Shenkar 2010). In other words, we believe our theory can inform firms considering imitation—as an alternative to developing new products themselves—that such an approach is likely to increase in value as the magnitude of environmental change rises. So our study helps explain competitive dynamics that span well beyond the F1 industry, such as the failure of GM and other car manufacturers to shift their core knowledge fundamentally toward electrical vehicles at a time when external contingencies favor more prudent efforts to change established gasoline engines into hybrids, or to increase their efficiency, as Ford did with the EcoBoost technology (Posen and Levinthal 2012).
Certainly our study is not perfect, and it points the way to important opportunities for further inquiries. Former research has already addressed limitations and parallels between F1 and other knowledge-intensive sectors such as research-intensive industries like medical instrumentation and aerospace (Aversa et al. 2015; Jenkins 2010, 2014; Pinch and Henry 1999). If on the one hand F1 firms face extremely complex technological challenges, they also enjoy the benefits of an almost intelligible competitive arena, where sources of change (e.g., updates in the regulations or players’ moves) are easier to track and forecast compared to what happens in other industries. This makes F1 a special field where the most critical success factor is perhaps related to adapting the delicate product architecture to exogenous changes, rather than forecasting possible scenarios beforehand. On the other hand, the joint effect of fast-moving and regulatory forces (aimed at maximizing competitive balance) dampen the life cycle of an innovation—and its related rents—and thus strongly reduce the possibility of long-term competitive advantages. Thus, our results better apply to highly dynamic contexts, whereas in traditional industries firms’ exploratory innovation might be able to provide longer superior rents before urging the firm toward additional efforts. It is noteworthy that to engender internal consistency and deeper understanding of the relationship between optimal exploration and environmental change, we developed our study within a single industry, and our empirical F1 setting may involve some idiosyncratic limitations, such as the impossibility of using an economic profitability measure as a proxy for firm performance. Hence, future research that expands our analysis to other industries may need to address other dimensions of environmental change, and additional analyses could also tackle other environmental conditions that might induce such inflection points, such as the focus of change. Finally, despite the merits of our combined quantitative–qualitative (i.e., quanti–quali) empirical approach, involving both broad statistical analyses and fine-grained mechanisms unearthed by a grounded case analysis, further research may develop empirical research designs that can operationalize and test our suggested mediators, as well as the main associations, in other ways.
All in all, we conclude that environmental shifts should not simply induce firms to adopt strategies involving greater or lower levels of exploration mechanically. Instead, more specific and environmental-specific analyses should be used to identify the intrinsic costs and benefits of such endeavors, particularly those pertaining to system architecture. The question regarding the appropriate organizational response to environmental change is a central topic for organizations and strategic management, so understanding the tensions involved will remain a fertile ground for new inquiries. We hope our study will help motivate more such initiatives.
The authors are grateful to senior editor Giovanni Gavetti and the anonymous reviewers for their exceptional guidance during the review process. They also thank Charles Baden-Fuller, Simone Ferriani, Hans Frankort, Patricia Friedrich, Marco Giarratana, Daniel Levinthal, Gianni Lorenzoni, Hart Posen, Simone Santoni, Davide Ravasi, Murat Tarakci, Giulia Gambelli, and colleagues in the management department at the Cass Business School for their comments and suggestions. Errors are the authors’. Earlier versions of this paper were presented at the conference meetings of the Academy of Management in Orlando, Florida, and the Strategic Management Society in Atlanta, Georgia, as well as at research seminars at the Cass Business School in London, LUISS Business School in Rome, and the Wharton Business School in Philadelphia, among others. This work was supported by the European Commission’s Marie-Curie Actions [Project nr. 301688, Project Acronym AJ86RH5GYM, FP7-PEOPLE-2011-IEF] and the Engineering and Physical Sciences Research Council [EPSRC UK; EP/K039695/1 Building Better Business Models].
1 See Gupta et al. (2006) for a comprehensive review of these different positions.
2 Simon (1962) refers to this as the system’s degree of decomposability (cf. Nickerson and Zenger 2004).
3 Assuming a rather stable environment (or one that only changes incrementally), firms with context-specific capabilities will earn a competitive advantage over those that possess context-generic capabilities (Porter 1985). But as the environment changes more radically, the Context specificity of the resource (and hence, its value superiority) decreases quickly, so eroding this advantage. For example, the use of pesticides in farming is known to boost crop yields, and sellers of patented formulas have an edge over rivals that sell generics. However, should the patented formula suffer from new regulatory bans, this competitive advantage would end. As the literature argues, this “equalization” would drive firms into new explorative endeavors.
4 Regulations may be aimed at introducing or restricting the use of new technologies, but qualitative evidence (available from the authors on request) reveals that in both cases they produce similar effects on firms’ behaviors. In fact, the evidence we examine shows that regulatory changes end up enhancing technological heterogeneity at the firm level, as players always strive to find ways to work around the regulations. Thus, a regulation may forbid a specific solution, but often does not concomitantly ban all the alternative devices/solutions that could be used as functional alternatives. Another key aspect regarding the distinct types of technical regulations is that the changes in the rules may, in theory, have contrasting effects in different organizations. However, the qualitative data coded during our study show little evidence in support of this argument.
5 Cars that failed to finish a race were automatically assigned to the last position in that race.
6 Since the persistence of the dependent variable could cause weak instrument problems, we opted to use the system-GMM estimation rather than the difference-GMM technique (Arellano and Bond 1991, 1998).
7 The robust standard errors were computed conventionally by applying the Windmeijer (2005) correction. The Sargan–Hansen test did not report significant coefficients for either model, indicating that our instruments were suitable; similarly, the results of the Arellano–Bond tests indicate the absence of second-order autocorrelation.
8 Note that Lind and Mehlum (2010) observe that determining whether the (1 − 2α) confidence interval for the extremum is within the range of the x variable is equivalent to running the Sasabuchi (1980) test at the α level of significance.
9 As the environment changes more radically, the level of performance registered at the peak of the inverted-U shape (unsurprisingly) decreases. In fact, because environmental shocks generally render existing products and technologies less valuable, it is plausible that immediately after such shocks occur, even top performers can only achieve suboptimal product configurations.
10 Our framing assumes environmental changes to be exogenous to the activities of firms, that is, as resulting from impositions by an external agency, rather than from a Schumpeterian process triggered by the firms themselves. But one can still suspect regulatory changes in F1 may be endogenous—for example, that they may involve favoritism, or some other superordinate interest by a team with undue influence on the FIA—and so question the validity of the analysis. To examine this possibility, we inspected the reasoning the FIA gave for each proposed regulatory change closely, and in each case found that they aimed to decrease team dominance and improve public welfare (e.g., rules to reduce negligent behavior and improve driver safety, technical standards to improve the chances of vehicle overtaking and thus increase fan entertainment, budget limitations to reduce costs and balance the chances of cash-rich against cash-poor teams, and rules regarding sponsorship display in cars to improve revenue). We also verified whether the issuance of new rules coincided with the dominance of particular teams. Indeed, we found that the 2009 regulatory shock was partly deliberately intended to break a rapidly increasing concentration in performance and team dominance. To check for the robustness of the results, we repeated the regression analysis excluding that year, but found no relevant variations in the findings for either the estimates of the coefficients or their statistical significance.
11 Nick Fry and Ross Brawn (former general manager and technical director at Honda F1, respectively) took over the company and re-founded it as Brawn GP, after several failed attempts to find an alternative buyer.
References
- (1985) Innovation: Mapping the winds of creative destruction. Res. Policy 14(1):3–22.Crossref, Google Scholar
- (2005) Competition and innovation: An inverted U relationship. Quart. J. Econom. 120(2):701–728.Google Scholar
- (1991) Multiple Regression: Testing and Interpreting Interactions (Sage Publications, Thousand Oaks, CA).Google Scholar
- (1964) Notes on the Synthesis of Form (Harvard University Press, Cambridge, MA).Google Scholar
- (2010) Alliance activity as a dynamic capability in the face of a discontinuous technological change. Organ. Sci. 21(6):1213–1232.Link, Google Scholar
- (1991) Some tests of specification for panel data: Monte Carlo evidence and an application to employment equations. Rev. Econom. Stud. 58(2):277–297.Crossref, Google Scholar
- (1998) Dynamic panel data estimation using DPD98 for GAUSS. Institute for Fiscal Studies, London.Google Scholar
- (2011) The importance of regulation-induced innovation for sustainable development. Sustainability 3(1):270–292.Crossref, Google Scholar
- (1985) Using regulation to change the market for innovation. Harvard Environ. Law Rev. 9(2):419–466.Google Scholar
- (2013) Case study: Innovation in a competitive sector. Brawn GP and Red Bull rejected Kers. Financial Times (April 8), 14.Google Scholar
- (2015) Business model configurations and performance. A qualitative comparative analysis in Formula One racing, 2005–2013. Indust. Corporate Change 24(3):655–676.Crossref, Google Scholar
- (2000) Design Rules: The Power of Modularity (MIT Press, Cambridge, MA).Crossref, Google Scholar
- (2003) Managing in an age of modularity. Garud R, Kumaraswamy A, Langlois RN, eds. Managing in the Modular Age: Architectures, Networks, and Organizations, Chap. 5 (Blackwell Publishers, Oxford, UK).Google Scholar
- (2009) A Companion to Econometric Analysis of Panel Data (John Wiley & Sons, London).Google Scholar
- (2005) Probing interactions in fixed and multilevel regression: Inferential and graphical techniques. Multivariate Behavioral Res. 40(3):373–400.Crossref, Google Scholar
- (2003) Strategic decision speed and firm performance. Strategic Management J. 24(11):1107–1129.Crossref, Google Scholar
- (2000) Making the next move: How experiential and vicarious learning shape the locations of chains’ acquisitions. Admin. Sci. Quart. 45(4):766–801.Crossref, Google Scholar
- (2008) Momentum or deceleration? Theoretical and methodological reflections on the analysis of organizational change. Acad. Management J. 51(3):413–435.Crossref, Google Scholar
- (2006) The influence of founding team company affiliations on firm behavior. Acad. Management J. 49(4):741–758.Crossref, Google Scholar
- (1998) Initial conditions and moment restrictions in dynamic panel data models. J. Econometrics 87(1):115–143.Crossref, Google Scholar
- (1999) Market share, market value and innovation in a panel of British manufacturing firms. Rev. Econom. Stud. 66(3):529–554.Crossref, Google Scholar
- (2007) Competitive crowding and risk taking in a tournament: Evidence from NASCAR racing. Admin. Sci. Quart. 52(2):208–247.Crossref, Google Scholar
- (1988) Strategic decision processes in high velocity environments: Four cases in the microcomputer industry. Management Sci. 34(7):816–835.Link, Google Scholar
- (1995) Product development: Past research, present findings, and future directions. Acad. Management Rev. 20(2):343–378.Crossref, Google Scholar
- (2001) Unpacking the black box of modularity: Technologies, products and organizations. Indust. Corporate Change 10(1):179–205.Crossref, Google Scholar
- (2006) Making design rules: A multidomain perspective. Organ. Sci. 17(2):179–189.Link, Google Scholar
- (2001) Knowledge specialization, organizational coupling, and the boundaries of the firm: Why do firms know more than they make? Admin. Sci. Quart. 46(4):597–621.Crossref, Google Scholar
- (2007) The value and costs of modularity: A problem solving perspective. Eur. Management Rev. 4(2):121–132.Crossref, Google Scholar
- (1986) Strategy and strategic choice: The case of telecommunications. Strategic Management J. 7(2):161–177.Crossref, Google Scholar
- (2013) Weaving straw into gold: Managing organizational tensions between standardization and flexibility in microfinance. Organ. Sci. 25(1):1–28.Link, Google Scholar
- (2010) What’s in it for them? Advantages of higher-status partners in exchange relationships. Acad. Management J. 53(1):149–166.Crossref, Google Scholar
- (1972) Organization structure and strategies of control: A replication of the Aston study. Admin. Sci. Quart. 17(2):163–177.Crossref, Google Scholar
- (1983) Applied Multiple Regression/Correlation Analysis for the Social Sciences (Lawrence Erlbaum Associates, Hillsdale, NJ).Google Scholar
- (2009) Optimal structure, market dynamism, and the strategy of simple rules. Admin. Sci. Quart. 54(3):413–452.Crossref, Google Scholar
- (2001) Adaptation as information restriction: The hot stove effect. Organ. Sci. 12(5):523–538.Link, Google Scholar
- (1984) Dimensions of organizational task environments. Admin. Sci. Quart. 29(1):52–73.Crossref, Google Scholar
Economist, The (2009) Boost for Formula One: Racing cars borrow a trick from the Toyota Prius (May 20), http://www.economist.com/node/13350762.Google Scholar- (1989) Building theories from case study research. Acad. Management Rev. 14(4):532–550.Crossref, Google Scholar
- (2004) Modularity and innovation in complex systems. Management Sci. 50(2):159–173.Link, Google Scholar
- (1984) Organization strategy and structural differences for radical versus incremental innovation. Management Sci. 30(6):682–695.Link, Google Scholar
- (2005) Cognition and hierarchy: Rethinking the microfoundations of capabilities’ development. Organ. Sci. 16(6):599–617.Link, Google Scholar
- (2000) Looking forward and looking backward: Cognitive and experiential search. Admin. Sci. Quart. 45(1):113–137.Crossref, Google Scholar
- (2007) Neo-Carnegie: The Carnegie School’s past, present, and reconstructing for the future. Organ. Sci. 18(3):523–536.Link, Google Scholar
- (2014) Big data and management. Acad. Management J. 57(2):321–326.Crossref, Google Scholar
- (1988) Time and transition in work teams: Toward a new model of group development. Acad. Management J. 31(1):9–41.Crossref, Google Scholar
- (1994) Pacing strategic change: The case of a new venture. Acad. Management J. 37(1):9–45.Crossref, Google Scholar
- (1995) Market Structure, Corporate Performance and Innovative Activity (Clarendon Press, Oxford, UK).Google Scholar
- (2011) Why leaders don’t learn from success. Harvard Bus. Rev. 89(4):68–74.Google Scholar
- (2013) Seeking qualitative rigor in inductive research: Notes on the Gioia methodology. Organ. Res. Methods 16(1):15–31.Crossref, Google Scholar
- (1990–2010) Who Works in Formula One (all editions between 1990 and 2010) (Who Works Sports Guides, London).Google Scholar
- (2006) The interplay between exploration and exploitation. Acad. Management J. 49(4):693–706.Crossref, Google Scholar
- (1995) Assessing managerial discretion across industries: A multimethod approach. Acad. Management J. 38(5):1427–1441.Crossref, Google Scholar
- (1977) The population ecology of organizations. Amer. J. Sociol. 82(5):929–964.Crossref, Google Scholar
- (1990) Architectural innovation: The reconfiguration of existing product technologies and the failure of established firms. Admin. Sci. Quart. 35(1):9–30.Crossref, Google Scholar
- (2006) Exploratory innovation, exploitative innovation, and performance: Effects of organizational antecedents and environmental moderators. Management Sci. 52(11):1661–1674.Link, Google Scholar
- (2010) Technological discontinuities and competitive advantage: A historical perspective on Formula 1 motor racing 1950–2006. J. Management Stud. 47(5):884–910.Crossref, Google Scholar
- (2014) Innovate or imitate? The role of collective beliefs in competences in competing firms. Long Range Planning 47(4):173–185.Crossref, Google Scholar
- (2001) Trajectories in the evolution of technology: A multi-level study of competition in Formula 1 racing. Organ. Stud. 22(6):945–969.Crossref, Google Scholar
- (2010) The shifting geography of competitive advantage: Clusters, networks and firms. J. Econom. Geography 10(4):599–618.Crossref, Google Scholar
- (2006) Regulatory liberalization and the decline of emerging economy joint ventures: The case of India. Calif. Management Rev. 43(3):61–76.Google Scholar
- (2008) Effects of search timing on innovation: The value of not being in sync with rivals. Admin. Sci. Quart. 53(4):593–625.Crossref, Google Scholar
- (2003) Formula one motor racing. HBS Case 9-703-412, Harvard Business School, Boston.Google Scholar
- (2009) Exploration and exploitation: Internal variety and environmental dynamism. Strategic Organ. 7(11):11–41.Crossref, Google Scholar
- (1997) Industry life cycles. Indust. Corporate Change 6(1):145–182.Crossref, Google Scholar
- (1998) The co-evolution of strategic alliances. Organ. Sci. 9(3):255–264.Link, Google Scholar
- (2015) Understanding the exploration–exploitation dilemma: An MRI study of attention control and decision-making performance. Strategic Management J. 36(3):319–338.Crossref, Google Scholar
- (2014) Frontopolar cortex and decision-making efficiency: Comparing brain activity of experts with different professional background during an exploration–exploitation task. Front. Human Neurosci. 7:927. doi: 10.3389/fnhum.2013.00927.Crossref, Google Scholar
- (1968) Evolution in Changing Environments: Some Theoretical Explorations (Princeton University Press, Princeton, NJ).Google Scholar
- (1997) Adaptation on rugged landscapes. Management Sci. 43(7):934–950.Link, Google Scholar
- (2015) Three facets of organizational adaptation: Selection, variety, and plasticity. Organ. Sci. 26(3):743–755.Link, Google Scholar
- (2010) With or without U? The appropriate test for a U-shaped relationship. Oxford Bull. Econom. Statist. 72(1):109–118.Crossref, Google Scholar
- (2001) Grounded Theory in Management Research (Sage Publications, Thousand Oaks, CA).Google Scholar
- (2007) Triggers and enablers of sensegiving in organizations. Acad. Management J. 50(1):57–84.Crossref, Google Scholar
- (1991) Exploration and exploitation in organizational learning. Organ. Sci. 2(1):71–87.Link, Google Scholar
- (1996) Continuity and change in theories of organizational action. Admin. Sci. Quart. 41(2):278–287.Crossref, Google Scholar
- (2006) Rationality, foolishness, and adaptive intelligence. Strategic Management J. 27(3):201–214.Crossref, Google Scholar
- (1961) The decisions of engineering design. IEEE Trans. Engrg. Management 8(2):55–71.Google Scholar
- (2010) A multidimensional conceptualization of environmental velocity. Acad. Management Rev. 35(4):604–626.Crossref, Google Scholar
- (2010) The Great Encyclopedia of Formula 1 (Chronosports, London).Google Scholar
- (2007a) Strategic schemas, strategic flexibility, and firm performance: The moderating role of industry clockspeed. Strategic Management J. 28(3):243–270.Crossref, Google Scholar
- (2007b) The evolution of collective strategy frames in high- and low-velocity industries. Organ. Sci. 18(4):688–710.Link, Google Scholar
- (1981) Biases in dynamic models with fixed effects. Econometrica: J. Econometric Soc. 49(6):1417–1426.Crossref, Google Scholar
- (2004) A knowledge-based theory of the firm—The problem-solving perspective. Organ. Sci. 15(6):617–632.Link, Google Scholar
- (1982) In Search of Excellence: Lessons from American’s Best-Run Companies (Harper and Row, New York).Google Scholar
- (1999) Paul Krugman’s geographical economics, industrial clustering and the British motor sport industry. Regional Stud. 33(9):815–827.Crossref, Google Scholar
- (1992–2010) Formula 1: Technical Analysis (all editions between 1992 and 2010) (Giorgio Nada Editore, Milan).Google Scholar
- (1985) Competitive Advantage: Creating and Sustaining Superior Performance (Free Press, New York).Google Scholar
- (1996) America’s green strategy. Welford R, Starkey R, eds. Business and the Environment: A Reader, Chap. 5 (Taylor & Francis, Washington, DC).Google Scholar
- (2012) Chasing a moving target: Exploitation and exploration in dynamic environments. Management Sci. 58(3):587–601.Link, Google Scholar
- (1997) Technological competencies and product’s evolutionary dynamics a case study from the aero-engine industry. Res. Policy 25(8):1261–1276.Crossref, Google Scholar
- (2003) Balancing search and stability: Interdependencies among elements of organizational design. Management Sci. 49(3):290–311.Link, Google Scholar
- (2009a) A note on the theme of too many instruments. Oxford Bull. Econom. Statist. 71(1):135–158.Crossref, Google Scholar
- (2009b) How to do xtabond2: An introduction to difference and system GMM in Stata. Stata J. 9:86–136.Crossref, Google Scholar
- (2015) When leaders follow: Avoiding dethronement through imitation. Acad. Management J. Forthcoming.Crossref, Google Scholar
- (2001) Incumbent’s advantage through exploting complementary assets via interfirm cooperation. Strategic Management J. 22(6–7):687–699.Crossref, Google Scholar
- (1980) A test of a multivariate normal mean with composite hypotheses determined by linear inequalities. Biometrika 67(2):429–439.Crossref, Google Scholar
- (2010) Copycats: How smart companies use imitation to gain a strategic edge. Strategic Direction 26(10):3–5.Crossref, Google Scholar
- (2002) Evolution toward fit. Admin. Sci. Quart. 47(1):125–159.Crossref, Google Scholar
- (2007) Persuasion with case studies. Acad. Management J. 50(1):20–24.Crossref, Google Scholar
- (2005) Speed and search: Designing organizations for turbulence and complexity. Organ. Sci. 16(2):101–122.Link, Google Scholar
- (1962) The architecture of complexity. Proc. Amer. Philos. Soc. 106(6):467–482.Google Scholar
- (1976) How complex are complex systems? PSA: Proc. Biennual Meeting of the Philosophy Sci. Assoc., 2(Symposia and invited papers), 507–522.Crossref, Google Scholar
- (1999) Can there be a science of complex systems? Bar-Yam Y, ed. Unifying Themes in Complex Systems (Perseus Press, Cambridge, MA).Google Scholar
- (2000) Aging, obsolescence, and organizational innovation. Admin. Sci. Quart. 45(1):81–112.Crossref, Google Scholar
- (2010) Formula 1’s kinetic energy recovery system. About.com—Formula 1 and Other Car Racing. Last accessed April 27, 2015, http://formula1.about.com/od/car1/a/kers.htm.Google Scholar
- (2011a) Formula 1 drivers are lightweight again. About.com—Formula 1 and Other Car Racing. Last accessed April 27, 2015, http://formula1.about.com/od/drivers/a/Driver_Weights.htm.Google Scholar
- (2011b) Skills, thrills—and buttons—for F1 drivers. New York Times (April 8), http://www.nytimes.com/2011/04/09/sports/autoracing/09iht-SRPRIX09.html?_r=0.Google Scholar
- (2011) The impact of regulation on innovation in the United States: A cross-industry literature review. Inform. Tech. Innovation, 1–29.Google Scholar
- (2012) Organizing thoughts and connecting brains: Material practices and the transition from individual to group-level prospective sensemaking. Acad. Management J. 55(5):1232–1259.Crossref, Google Scholar
- (1997) Dynamic capabilities and strategic management. Strategic Management J. 18(7):509–533.Crossref, Google Scholar
- (2000) Capabilities, cognition and inertia: Evidence from digital imaging. Strategic Management J. 21(10–11):1147–1162.Crossref, Google Scholar
- (1986) Technological discontinuities and organizational environments. Admin. Sci. Quart. 31(3):439–465.Crossref, Google Scholar
- (1985) Organizational evolution: A metamorphosis model of convergence and reorientation. Res. Organ. Behav. 7:171–222.Google Scholar
- (1988) Selectivity and selective perception: An investigation of managers’ belief structures and information processing. Acad. Management J. 31(4):873–896.Crossref, Google Scholar
- (1989) Characterizing environmental variation. Acad. Management J. 32(4):867–882.Crossref, Google Scholar
- (2005) A finite sample correction for the variance of linear efficient two-step GMM estimators. J. Econometrics 126(1):25–51.Crossref, Google Scholar
- (1997) A longitudinal disaggregation of operational risk under changing regulations: Evidence from the savings and loan industry. Acad. Management J. 40(4):799–830.Crossref, Google Scholar
- (2008) Case Study Research: Design and Methods (Sage Publications, Thousand Oaks, CA).Google Scholar
- (2012) Apple Inc. in 2012. HBS Case 712-490, Harvard Business School, Boston.Google Scholar
Alessandro Marino is assistant professor of strategic management and a member of the graduate faculty at LUISS University. He received his Ph.D. in strategy from the Wharton School, University of Pennsylvania. His research interests include organizational adaptation and learning and competitive strategy, with a particular emphasis on the role of capabilities and routines.
Paolo Aversa is assistant professor of strategy and a member of the Faculty of Management at Cass Business School, City University London. He received his Ph.D. from the University of Bologna and spent his post-doc at the Wharton School, University of Pennsylvania. His research interests include technological innovation, buyer–supplier alliances, and business models.
Luiz Mesquita is an associate professor of strategy and organization at the W. P. Carey School of Business, Arizona State University. He received his Ph.D. in strategy from Purdue University. His research examines coordination and synergies among multiple agents in a system, involving collective strategies in innovation and performance as well as alliances and competition.
Jaideep Anand is the William H. Davis Chair and Dean’s Distinguished Professor of Strategy at the Fisher College of Business, Ohio State University. He earned his Ph.D. degree from the Wharton School, University of Pennsylvania. His interests include redeployment of firm resources across organizational, national and industry boundaries and the effect of uncertainty and complexity on firm growth.